

Abstract
Background.
Bicuspid aortic valve–associated ascending thoracic aortic aneurysms (BAV-aTAAs) carry a risk of acute type A dissection. Biomechanically, dissection may occur when wall stress exceeds wall strength. Our aim was to develop patient-specific computational models of BAV-aTAAs to determine magnitudes of wall stress by anatomic regions.
Methods.
Patients with BAV-aTAA diameter greater than 4.5 cm (n = 41) underwent electrocardiogram-gated computed tomography angiography. Three-dimensional aneurysm geometries were reconstructed after accounting for prestress and loaded to systemic pressure. Finite element analyses were performed with fiber-embedded hyperelastic material model using LS-DYNA software (LSTC Inc, Livermore, CA) to obtain wall stress distributions. The 99th percentile longitudinal and circumferential stresses were determined at systole.
Results.
The 99th percentile longitudinal wall stresses for BAV-aTAAs at sinuses of Valsalva, sinotubular junction (STJ), and ascending aorta were 361 ± 59.8 kPa, 295 ± 67.2 kPa, and 224 ± 37.6 kPa, respectively, with significant differences in ascending aorta vs sinuses (P < 1 × 10⁻¹³) and STJ (P < 1 × 10⁻⁶). The 99th percentile circumferential wall stresses were 474 ± 88.2 kPa, 634 ± 181.9 kPa, and 381 ± 54.0 kPa for sinuses, the STJ, and the ascending aorta, respectively, with significant differences in the ascending aorta vs sinuses (P = .002) and STJ (P < 1 × 10⁻¹³).
Conclusions.
Wall stresses, both circumferential and longitudinal, were greater in the aortic root, sinuses, and STJ than in the ascending aorta on BAV-aTAAs. These results fill a fundamental knowledge gap regarding biomechanical stress distribution in BAV-aTAA patients, which when related to wall strength may provide prognostication of aTAA dissection risk by patient-specific modeling.
Bicuspid aortic valve (BAV) is the most common cardiac congenital abnormality, affecting 1% to 2% of the population.1 BAV is associated with ascending thoracic aortic aneurysms (aTAAs), which grow at a faster rate and tend to dissect at younger age, with a larger size at time of dissection than their tricuspid aortic valve (TAV)-aTAA counterparts.2–4 While BAV-aTAAs have a similar low dissection rate as do TAV-aTAAs, their risk of dissection is higher than in the general population.2–4 Despite advances in surgical techniques, imaging, and screening strategies, overall in-hospital dissection mortality remains as high as 25%.5 To prevent this cardiovascular catastrophe, the American College of Cardiology/American Heart Association guidelines recommend elective surgical repair for all aTAAs with diameter greater than or equal to 5.5 cm, growth rate greater than or equal to 0.5 cm/y, or diameter greater than or equal to 5.0 cm with a family history of aortic dissection. Patients undergoing primary aortic valve replacement are also eligible for preventive surgery with aTAA diameter greater than 4.5 cm.6 Guidelines no longer distinguish between BAV-associated and TAV-associated aTAAs, and the 2016 American College of Cardiology/American Heart Association statement expanded diameter criteria for asymptomatic BAV-aTAA to 5.5 cm from 4.5 cm, citing a lack of evidence regarding diameter and dissection risk.7 Acute type A dissection is a complex hemodynamic and biomechanical phenomenon that is not well captured or predicted by diameter.8 The International Registry of Acute Aortic Dissection reported that in type A dissection patients, 59% had aortic diameter less than 5.5 cm and 40% had diameter less than 5 cm,9 while ~90% of aTAA patients failed to meet elective surgical repair guidelines before the event.10 BAV-aTAAs showed similar trends, with 12.5% of dissections occurring at a diameter less than 5 cm.11 There is a need for patient-specific aTAA surgical repair criteria.
Biomechanically, aortic dissection can occur when wall stress exceeds wall strength.12 Despite similar collagen content, mechanical failure testing of BAV-aTAA suggests greater wall strength than in TAV-aTAA,13,14 highlighting the importance of studying wall stress to understand BAV-aTAA behavior. The law of Laplace linearly relates wall stress to both diameter and pressure, assuming a perfect cylindrical geometry, but is unable to predict wall stresses in complex surfaces such as aTAA geometries. Finite element analysis (FEA) is a validated computational method that can be used to determine failure modes and stresses that are otherwise impossible to directly measure in vivo. Prior studies have applied FEA to patient-specific aTAAs, demonstrating that regions of peak stress can be found in regions where clinical dissection is often observed.8,15,16 However, limited data exist regarding the distribution of BAV-aTAA wall stress.15,16 Patient-specific BAV-aTAA wall stresses can be accurately characterized from precise 3-dimensional computational models. BAV-aTAA wall stress profiles could be potentially helpful to identify regions of intrinsic vulnerability and guide clinical decision making. The aim of this study was to determine magnitudes of wall stress by anatomic regions on BAV-aTAAs.
Material and Methods
Patients with electrocardiogram-gated computed tomography angiography (CTA) undergoing routine aneurysm surveillance were evaluated for BAV-aTAA with diameter greater than 4.5 cm. Patients with motion artifact or poor image quality resolution were excluded. Patients were required to have neither a history of aortic valve surgery nor isolated aortic root dilatation. BAVs were not differentiated by subtype. This study was approved by the Committee on Human Research at the University of California San Francisco Medical Center and Institutional Review Board at San Francisco Veterans Affairs Medical Center.
BAV-aTAA Geometry Reconstruction
DICOM (Digital Imaging and Communications in Medicine) CTA images were imported into MeVisLab (MeVis Medical Solutions AG, Bremen, Germany) for segmentation. Patient-specific 3-dimensional aTAA geometries, from the left ventricular outflow tract to the descending thoracic aorta, were reconstructed from CTA slices orthogonal to the long axis of the aorta. The aortic wall was meshed into 19,008 hexahedral elements (TrueGrid version 3.1.3; XYZ Scientific, Inc, Livermore, CA) to create geometric mesh. LS-DYNA R10 (LSTC Inc, Livermore, CA), a FEA software package, was used for pressure loading simulations and data analysis.
Zero-Pressure Geometry and FE Simulations
CTA images were obtained under in vivo physiologic blood pressure conditions. To account for this prestress, a modified update-Lagrangian method was applied to obtain zero-pressure aTAA geometries. The aTAA wall was assumed to be incompressible, uniform, hyperelastic, and anisotropic; and modeled according to our previously described user-defined fiber-embedded hyperelastic material model.17 The aortic root is a dynamic structure with movement during the cardiac cycle. Axial displacement at the root may increase peak longitudinal stress up to 50%.18 Translational motion was fixed proximally at the left ventricular outflow tract, 20 mm below the annulus, to allow aortic root motion during the cardiac cycle and fixed distally at the descending thoracic aorta to account for the physiologic effects of the ligamentum arteriosum without constraints to rotational motion. FE simulations were performed by applying pressure loading conditions representative of human physiologic arterial pressure to the aTAA inner lumen. Simulations consisted of initial inner lumen pressurization and stabilization from 0 mm Hg to 80 mm Hg over a 4-second duration, then the cardiac cycle was simulated by an increase from 80 mm Hg to 120 mm Hg over 300 ms, followed by a decrease back to 80 mm Hg over 500 ms. Averaged BAV-aTAA material properties, along with uniform aTAA thickness of 1.75 mm, were applied based on previous biaxial stretch testing.19 Figure 1 and the Supplemental Video provide a schematic of the process from geometry creation, mesh generation, and FEA.
Figure 1.
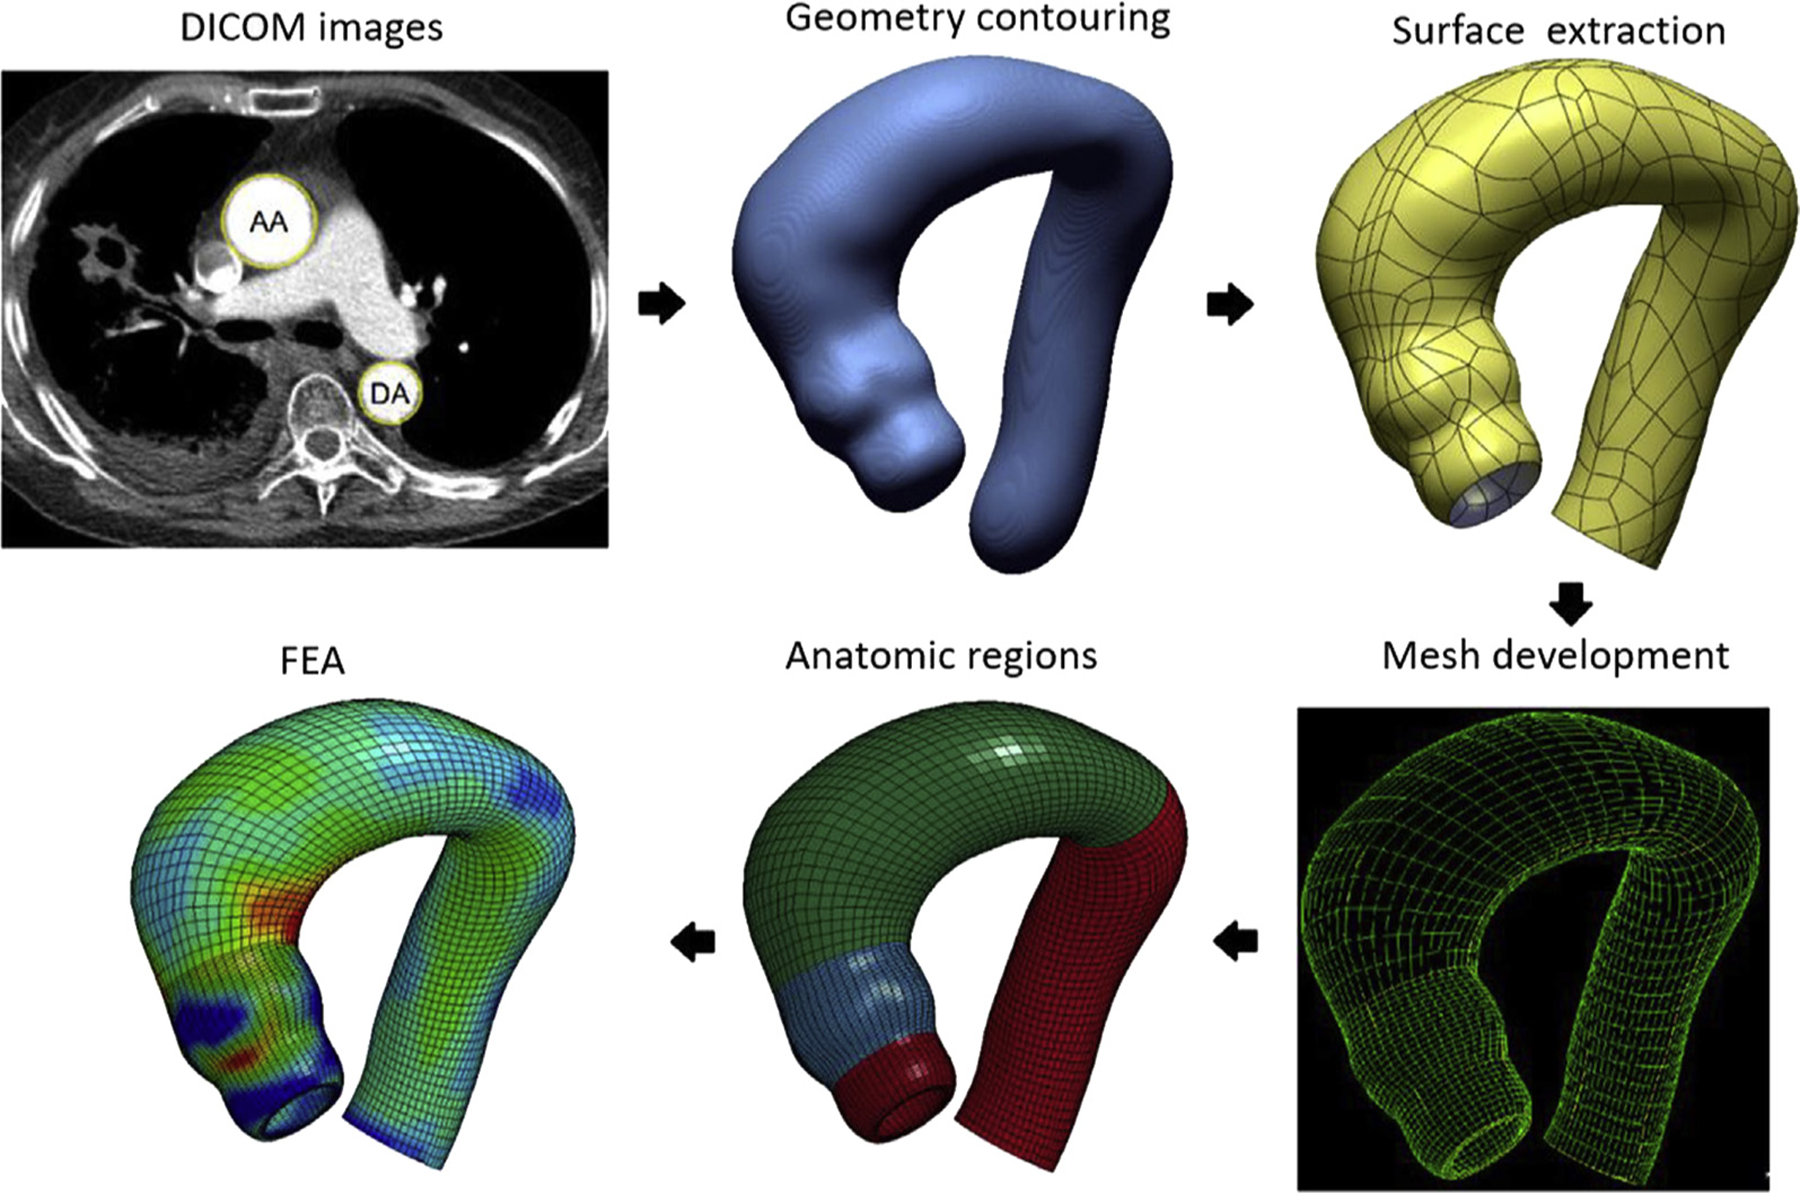
Schematic of finite element modeling process: Digital Imaging and Communications in Medicine (DICOM) images to geometric contouring (blue) to mesh development (yellow and green), anatomic regions defined in color, and finally finite element analysis (FEA).
Data and Statistical Analysis
In this study, FEA computes the mechanical stresses due to hydrostatic loads on the aortic wall. Shear stress represents the contribution of blood flow on wall stress, which is orders of magnitude less than the contribution from blood pressure.20 Analysis was performed utilizing 99th percentile wall stresses to avoid artifacts arising from inhomogeneities in the mesh, as previously described.16,21 Peak wall stresses will heretofore refer to 99th percentile wall stresses. Peak circumferential and longitudinal wall stresses were calculated at the sinuses of Valsalva, sinotubular junction (STJ), and ascending aorta (AscAo) using LS-DYNA postprocessing software. Reproducibility was tested with 3 independent investigators developing a subset of 17 patient-specific models and running FE simulations. Wall stresses in these regions were compared using 1-way repeated-measures analysis of variance with Greenhouse-Geisser correction for sphericity departure. The Tukey’s honestly significant difference test was utilized for pairwise comparisons when analysis of variance showed statistical significance. The STJ and AscAo were further subdivided into greater and lesser curvatures and compared using a paired-sample t test. BAV-aTAA models were classified by either STJ effacement or aortic dilation morphology, and as previously proposed by Della Corte and colleagues,22 into predominantly root vs AscAo dilated phenotypes. Peak wall stresses between the root and AscAo dilation phenotype as well as between aTAAs with and without STJ effacement were compared at different regions using unpaired-sample t tests. Values are reported as mean ± SD. A P value less than .05 was considered statistically significant. Statistical analyses were performed using R version 3.5.1 software (R Foundation for Statistical Computing, Vienna, Austria).
Results
Clinical Profiles
There were 41 male BAV-aTAA patients, with mean age of 66 ± 9 years. Mean aTAA diameter was 5.05 ± 0.46 cm. Patient characteristics are summarized in Table 1.
Table 1.
Population Characteristics
| Characteristic | Bicuspid Aortic Valve (N = 41) |
|---|---|
| Age, y | 66 ± 9 |
| Male | 41 (100) |
| Diameter, cm | 5.05 ± 0.46 |
| Risk factors | |
| Hypertension | 35 (85.4) |
| Smoking | 20 (48.8) |
| Diabetes mellitus type 2 | 6 (14.6) |
| Diabetes mellitus type 1 | 1 (2.44) |
| Hyperlipidemia | 31 (71.6) |
| CAD | 19 (46.3) |
| PVD | 4 (12.2) |
| COPD | 2 (4.88) |
| CVA | 4 (9.76) |
| CKD | 3 (7.32) |
| Arrhythmia | 26 (63.4) |
| MI | 4 (9.76) |
| EF, % | 60.5 ± 10.1 |
| Hemodialysis | 0 (0) |
| Prior PCI | 4 (9.76) |
| Prior cardiac surgery | 4 (9.76) |
| Aortic stenosis | |
| None | 13 (31.7) |
| Trace | 0 (0) |
| Mild | 5 (12.2) |
| Moderate | 6 (14.6) |
| Severe | 17 (41.5) |
| Total | 28 (68.3) |
| Aortic regurgitation | |
| None | 11 (26.8) |
| Trace | 10 (24.4) |
| Mild | 9 (22.0) |
| Moderate | 8 (19.5) |
| Severe | 3 (7.32) |
| Total | 30 (73.2) |
| Mixed aortic valve disease | 16 (39.0) |
Values are mean ± SD or n (%).
CAD, coronary artery disease; CKD, chronic kidney disease; COPD, chronic obstructive pulmonary disease; CVA, cerebrovascular accident; EF, ejection fraction; MI, myocardial infarction; PCI, percutaneous coronary intervention; PVD, peripheral vascular disease.
BAV-aTAA Wall Stresses
There was a significant effect of region on peak circumferential wall stresses for the sinuses (474 ± 88.2 kPa), STJ (634 ± 181.9 kPa), and AscAo (381 ± 54.0 kPa) at systolic pressure (F = 46, P < 1 × 10⁻¹²), which were significantly lower at the AscAo than in the sinuses (P = .002) and STJ (P < 1 × 10⁻¹³), and higher in the STJ than in the sinuses (P < 1 × 10⁻⁷) (Figure 2A). Peak longitudinal wall stresses in the sinuses (361 ± 59.8 kPa), STJ (295 ± 67.2 kPa), and AscAo (224 ± 37.6 kPa) at systolic pressure also differed by region (F = 61, P < 1 × 10⁻¹⁵) and were lower in the AscAo than in the sinuses (P < 1 × 10⁻¹³) and STJ (P < 1 × 10⁻⁶) and higher in the sinuses than in the STJ (P < 1 × 10⁻⁵) (Figure 2B). Similar trends were found at diastolic pressure. Representative wall stress profiles in BAV patients are shown in Figure 3. For a 17-patient subset, 3 independent investigators performed geometric contouring, meshing, and FEA. Interinvestigator variability had overall mean percentage differences of 7% ± 4% and 5% ± 2% for the peak circumferential and longitudinal wall stresses, respectively, without significant differences (P = .4) between investigators.
Figure 2.
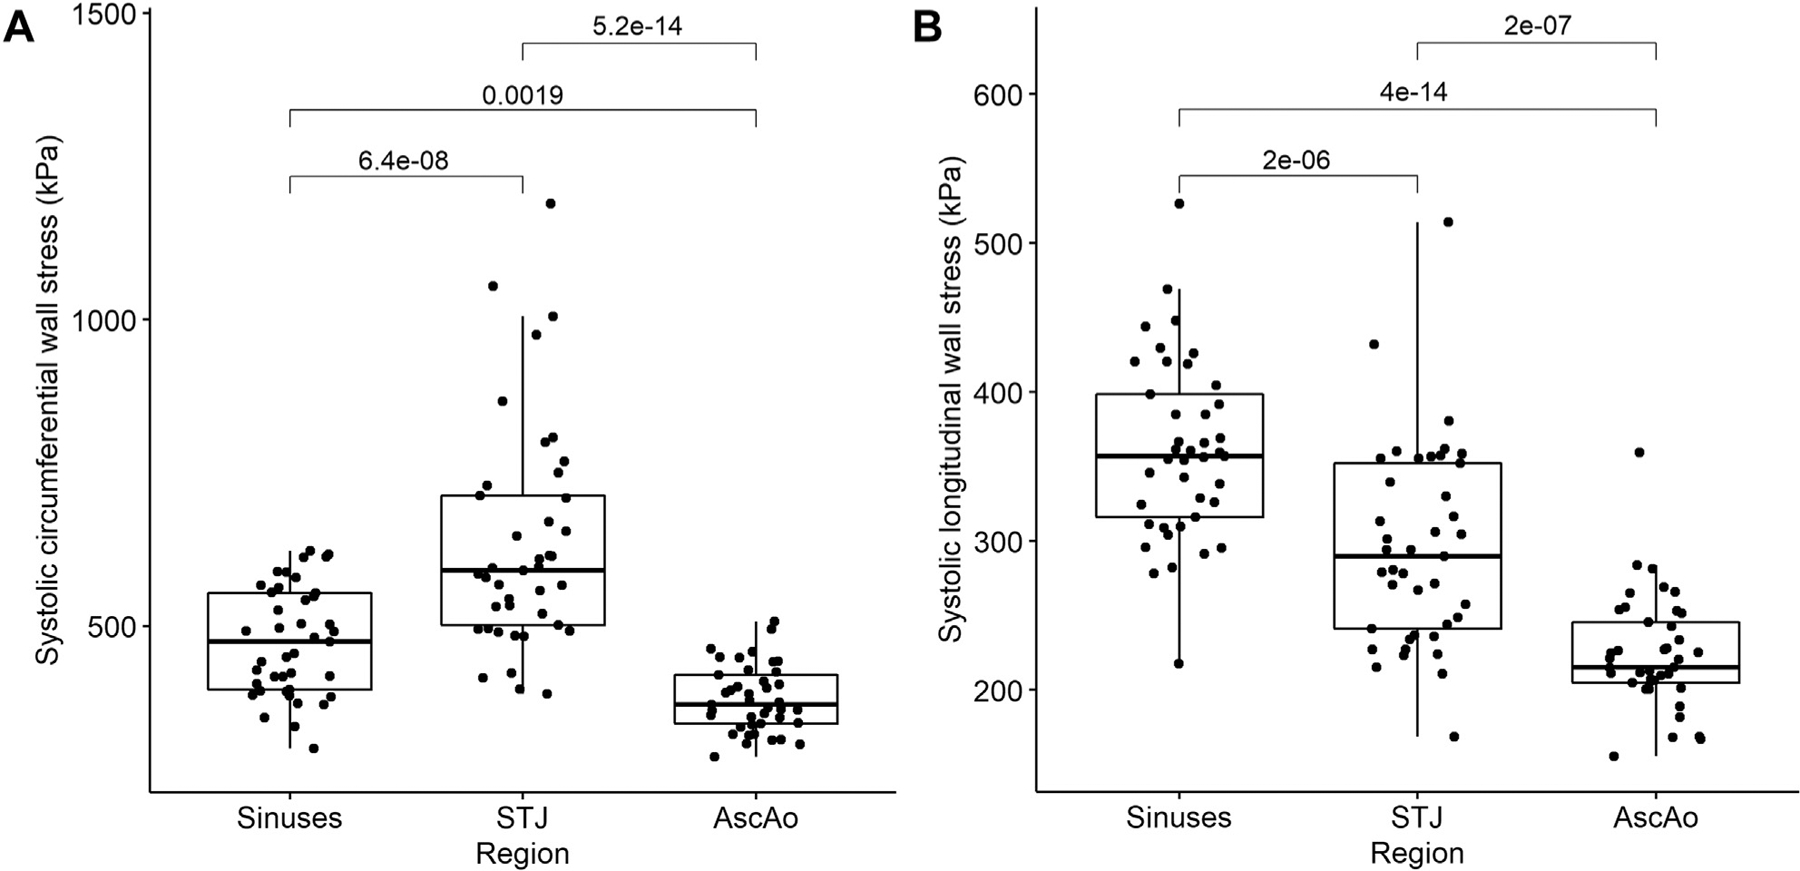
Relationship between peak (A) circumferential and (B) longitudinal wall stresses and aortic region. Mean (horizontal line), 25th and 75th percentiles (box), range (whiskers), and observations (dots). (AscAo, ascending aorta; STJ, sinotubular junction.)
Figure 3.
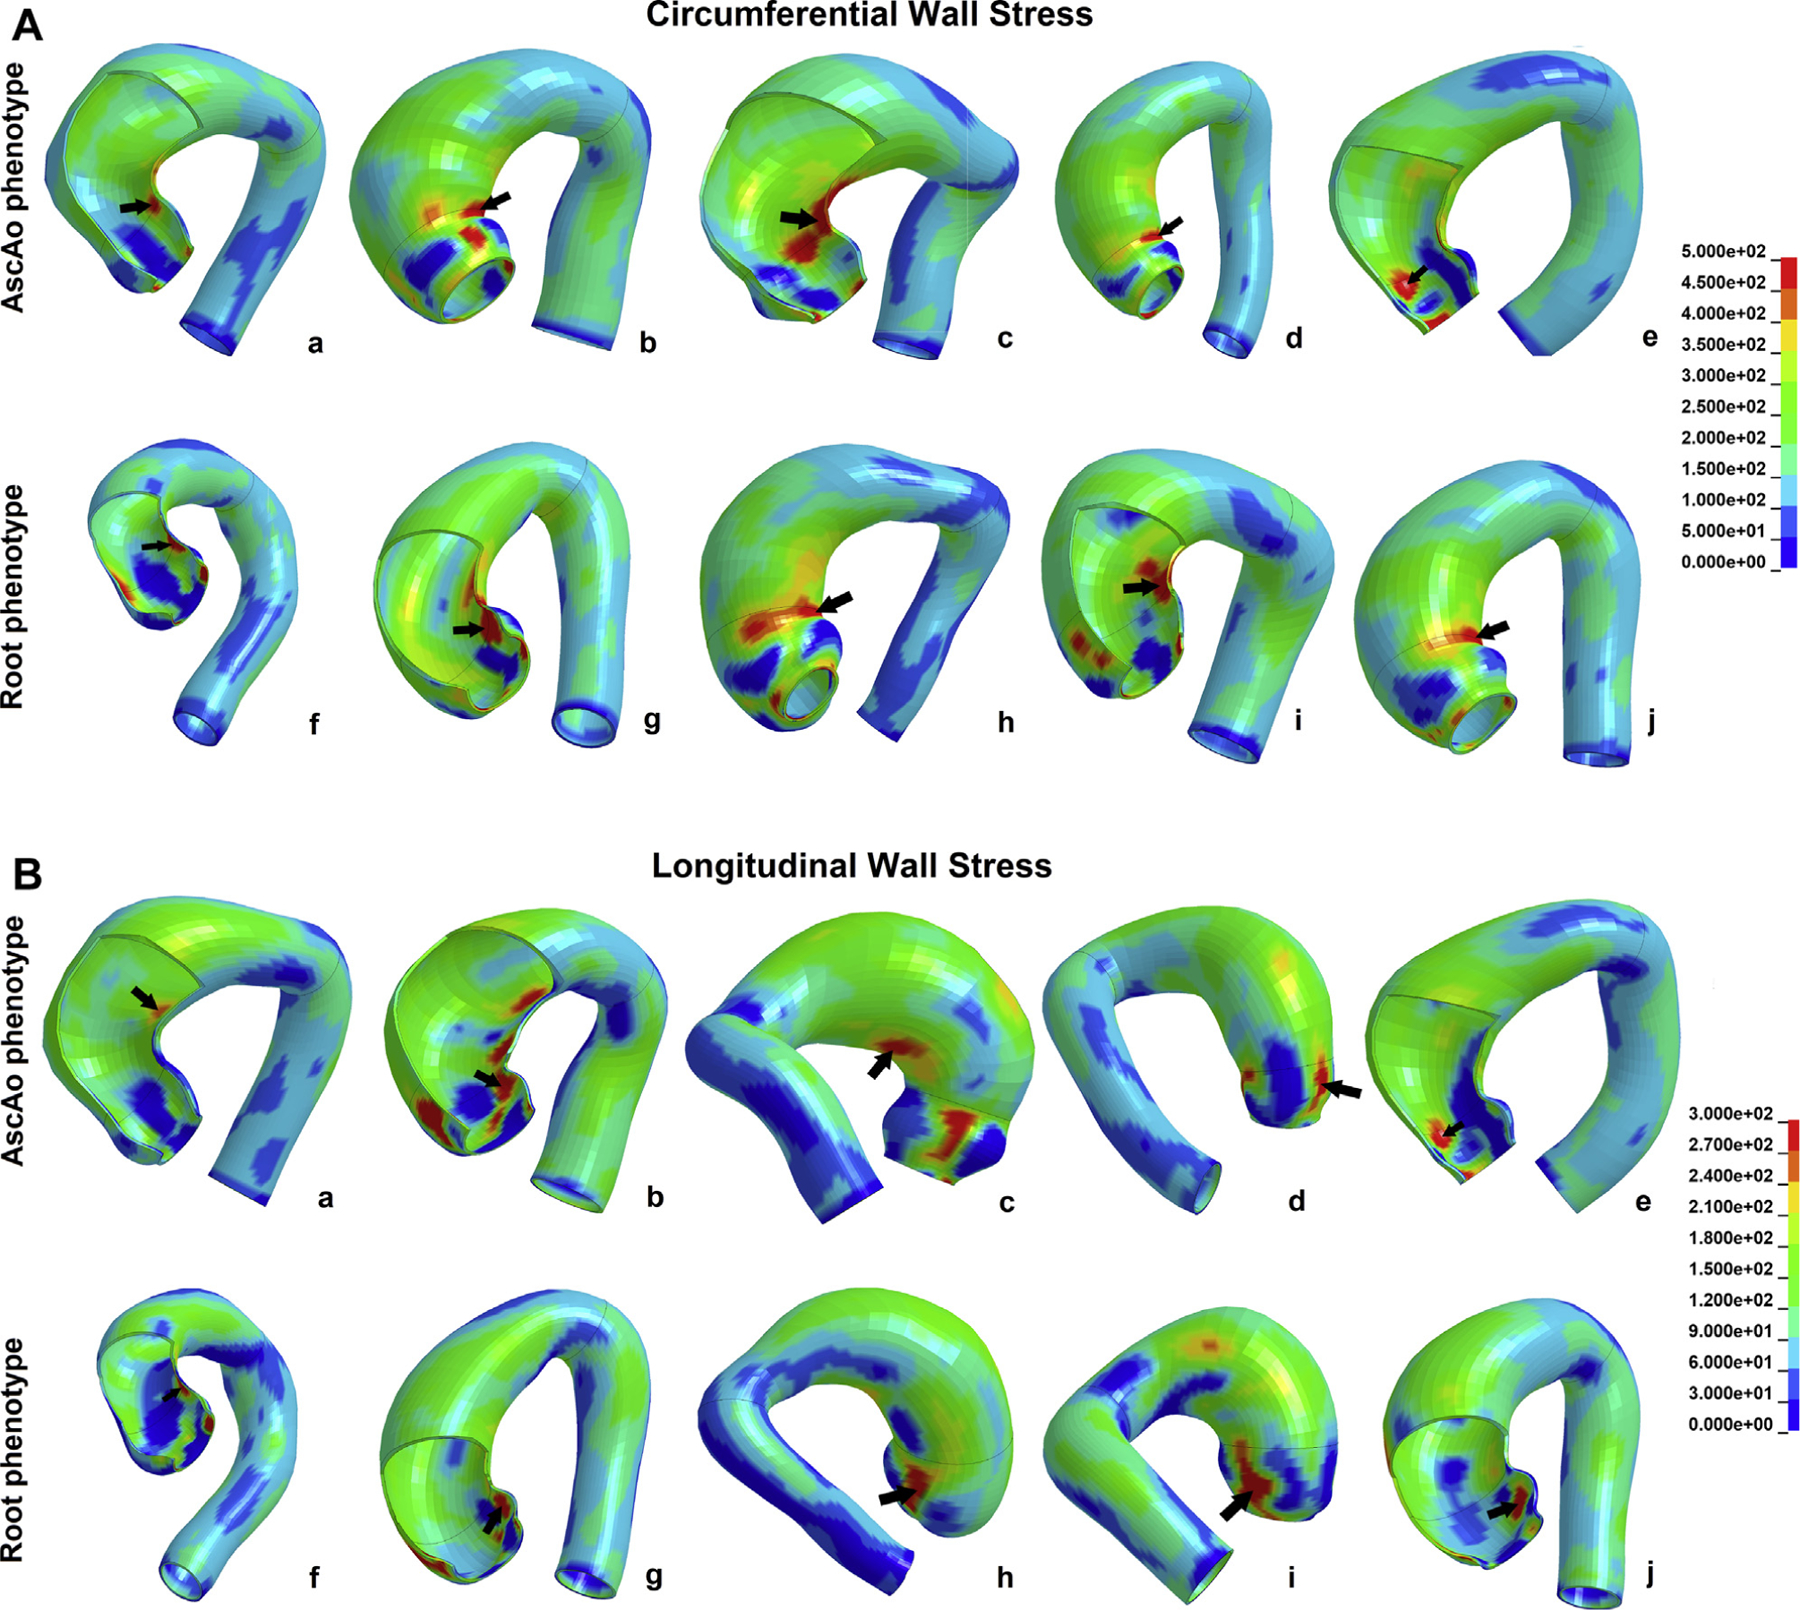
(A) Characteristic bicuspid aortic valve–associated ascending thoracic aortic aneurysm circumferential wall stress profiles in (a-e) the ascending aorta (AscAo) and (f-j) the root phenotype. (B) Characteristic bicuspid aortic valve–associated ascending thoracic aortic aneurysm longitudinal wall stress profiles in (a-e) the AscAo and (f-j) the root phenotype.
Greater vs Lesser Curvature
Peak AscAo circumferential wall stresses at systole were located at the lesser curvature in 35 (83.3%) aTAAs and larger at lesser than at greater curvature (378 ± 55.4 kPa vs 326 ± 41.4 kPa; P < 1 × 10⁻⁵). Peak AscAo longitudinal stresses at systole were significantly different between greater and lesser curvature (199 ± 25.6 kPa vs 218 ± 40.5 kPa; P = .016). Peak STJ circumferential wall stresses were located at lesser curvature in 38 (90.5%) aTAAs and larger at lesser than at greater curvature (631 ± 185.2 kPa vs 416 ± 82.3 kPa; P < 1 × 10⁻⁸). Peak STJ longitudinal stresses were not significantly different between lesser and greater curvature (274 ± 69.0 kPa vs 278 ± 68.8 kPa; P = .81). Similar trends were found at diastolic pressure. Representative curvatures stress profiles are shown in Figure 4.
Figure 4.
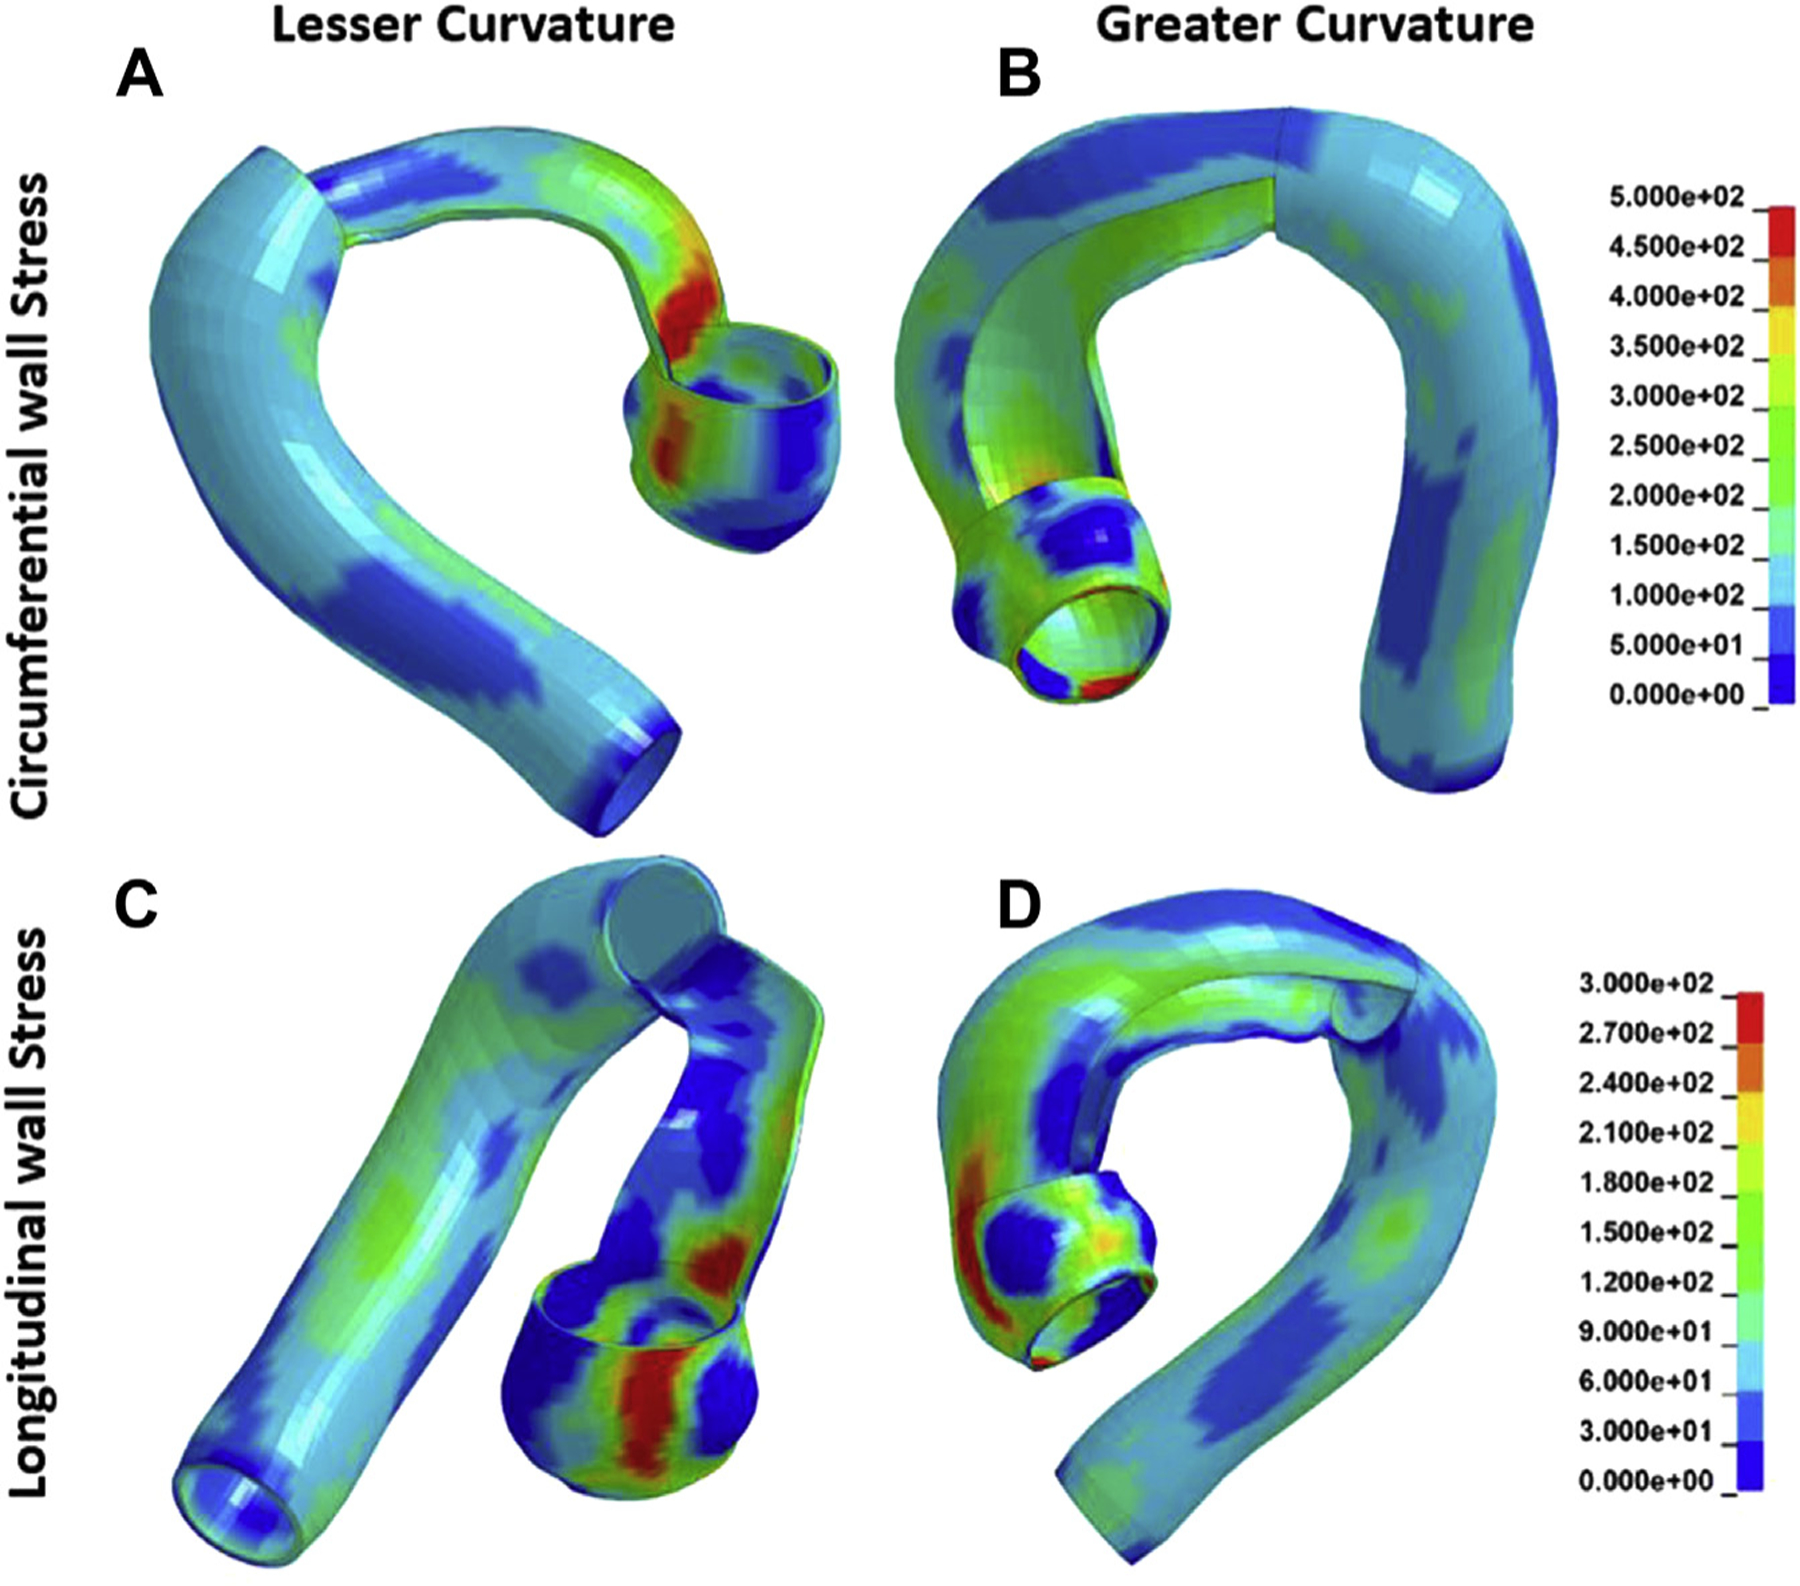
Characteristic bicuspid aortic valve–associated ascending thoracic aortic aneurysm peak wall stress profiles (A) along circumferential direction and lesser curvature, (B) circumferential direction and greater curvature, (C) longitudinal direction and lesser curvature, and (D) longitudinal direction and greater curvature.
Root vs AscAo aTAA Phenotype
BAV-aTAAs (n = 23, 56.1%) were predominately dilated at the root, while 18 (43.9%) were predominately dilated at the AscAo. Longitudinal peak stresses at systole between the root and AscAo phenotype were 369 ± 56.7 kPa vs 350 ± 63.8 kPa (P = .17) at the sinuses, 294 ± 57.1 kPa vs 298 ± 79.9 kPa (P = .43) at the STJ, and 216 ± 26.4 kPa vs 233 ± 47.5 kPa (P = .090) at the AscAo. Circumferential peak stresses at systole between the root and AscAo phenotype were 464 ± 73.7 kPa vs 488 ± 104.5 kPa (P = .21) at the sinuses, 619 ± 166.6 kPa vs 654 ± 203.0 kPa (P = .28) at the STJ, and 376 ± 54.5 kPa vs 388 ± 54.0 kPa (P = .24) at the AscAo.
STJ Effacement
BAV-aTAAs (n = 8, 19.5%) were effaced at the STJ, while 33 (80.5%) had no STJ effacement. Longitudinal peak stresses at systole between effaced and noneffaced STJ phenotypes were 357 ± 72.5 kPa vs 362 ± 57.7 kPa (P = .43) at the sinuses, 306 ± 57.1 kPa vs 293 ± 70.0 kPa (P = .29) at the STJ, and 228 ± 20.5 kPa vs 223 ± 40.9 kPa (P = .31) at the AscAo. Circumferential peak stresses at systole between effaced and noneffaced STJ phenotypes were 482 ± 86.6 kPa vs 472 ± 89.7 kPa (P = .39) at the sinuses, 614 ± 115.1 kPa vs 639 ± 195.8 kPa (P = .32) at the STJ, and 403 ± 64.8 kPa vs 376 ± 50.7 kPa (P = .14) at the AscAo.
Comment
Current American College of Cardiology/American Heart Association aTAA surgical repair guidelines base their recommendations primarily on diameter, along with growth rate, connective tissue disorder, and family history of dissection.6 We, among others, demonstrated that aTAA diameter is not a good predictor for aneurysm dissection or rupture.7–9,16,19 Biomechanical studies suggest higher wall strength of BAV than TAV-aTAAs,12–14 highlighting the importance of patient-specific wall stress analyses. Guidelines currently do not distinguish by valve phenotype.6 Use of patient-specific computational modeling to identify BAV-aTAA high-stress regions in relationship to wall strength could point to areas at risk of initial intimal tear and facilitate development of patient-specific repair criteria.
BAV-aTAA Wall Stresses
In this study, we found that BAV-aTAA patients sustained larger wall stresses at the aortic root than at the AscAo. Circumferential and longitudinal stresses at the STJ and sinuses were significantly greater than were stresses at the AscAo. We also found that AscAo longitudinal and circumferential stresses were larger at lesser than at greater curvature, while only circumferential stresses were larger at the lesser than at the greater curvature in the STJ.
Our findings are consistent with those of Nathan and colleagues.21 While their study did not take prestress geometry into account, which we previously demonstrated was important for accurate wall stress determination,17 they found that 99th percentile von Mises wall stresses for 90% of BAV patients were located above either the right or left coronary sinus (P = .075). Notably, their wall stress results were normalized to radius of the respective region, so they also found higher wall stresses in the sinuses than in the STJ overall when not normalized. Similar trends were also previously described by our group.16 We found that for BAV-aTAA patients, circumferential and longitudinal 99th percentile systolic wall stresses were 548 kPa and 280 kPa, respectively, and when STJ region was examined, that the STJ had higher stresses than the AscAo did. Our numbers in that study were limited to n = 17 and our geometries did not extend to the left ventricular outflow tract but started just below the STJ, so we were not able to evaluate statistical significance of this anatomic difference or assess sinus stresses. That study and others published evaluated geometry starting at the STJ, which may influence wall stress results based on boundary conditions. Nonetheless, when not restricted to BAV-aTAA, other studies have corroborated higher aTAA wall stresses at the STJ than at the AscAo.20,23
Differences in BAV-aTAA wall stresses between greater and lesser curvatures have been less extensively characterized.15 We previously found higher circumferential peak stresses at lesser curvature for both the AscAo and STJ,16 similar to our current results and others.15 While our previous study had a trend toward higher longitudinal peak stresses at STJ greater compared with lesser curvature, our current study showed no statistically significant difference. Nathan and colleagues21 also demonstrated similar high stress localization in BAV-aTAA without differences in greater and lesser curvature. Geometric modeling from the STJ vs below the aortic annulus may impact wall stress, though our results are of similar magnitude as other studies.15,16,24 Our fixed boundary conditions were below the aortic annulus to allow free movement of aortic root and reduce the effects of boundary fixation. Last, we demonstrated in a subset of patients that FEA results were not statistically different when 3 independent investigators used the same methodology, beginning with CT images to FEA results.
Our results fill in a valuable gap in knowledge regarding wall stress distribution in BAV-aTAA. From a clinical perspective, having overall stresses higher in the STJ and sinuses reflects areas at risk of dissection. Because dissection also depends on wall strength, differences in wall stress relative to wall strength in these regions, the sinuses, the STJ, and the ascending aorta may determine the initiation region for a given patient. Notably, determining patient-specific BAV-aTAA biomechanics through computational models as performed here may not only help determine areas at risk for the individual patient based on wall stress-to-strength ratio, but also evaluate these same patients under differing hemodynamic conditions such as hypertension. Evaluating changes in peak wall stress magnitudes in these regions during exercise or acute hypertension may further help determine if elective aTAA surgery is performed despite a size less than 5.5 cm.
BAV-aTAA Wall Strength
From a biomechanical standpoint, aortic dissection could occur when wall stress exceeds wall strength, which results in tearing of the aortic intimal layer.12 The BAV-aTAA wall has not been shown to be weaker than the TAV-aTAA wall.12,14,25 Deveja and colleagues13 showed that wall strength is greater in BAV-aTAA than TAV-aTAA in both longitudinal and circumferential directions. On the most conservative side, Pham and colleagues25 reported no differences in failure mechanics between BAV-aTAA and TAV-aTAA. These findings highlight the importance of studying wall stress to determine dissection risk in BAV-aTAA patients.
Previous studies demonstrated higher circumferential than longitudinal aTAA strength, even when restricted to BAV-aTAA, circumferential wall strength nearly doubles that of longitudinal wall strength.14 These findings suggest that dissection entry tear begins transversely due to relative longitudinal weakness and propagates along the circumferential spiral.8
Clinical determination of dissection entry site can be challenging and limited by the extent of propagation on presentation. Multiple studies have suggested the STJ as a common entry location. Jaussaud and colleagues8 found equal proportions of type A dissection intimal tears on the AscAo vs at the STJ (29% vs 29%). The majority of dissections with identifiable entry tears by CT are ±2cm from the STJ.26 When looking at BAV, Tadros and colleagues2 found that BAV-aTAAs were more likely to have an entry tear at the aortic root than were TAV-aTAAs (31% vs 6%; P = .039). These observations are consistent with our findings of higher wall stresses at the STJ and sinuses of Valsalva. Our results provide fundamental information regarding patient-specific peak wall stresses with respect to region, which, coupled with wall strength distribution among anatomic regions, will provide important answers for dissection risk. At present, distribution of wall strength based on anatomic regions is lacking because of the nature of aneurysm surgery, which does not excise the aortic root intact from the left ventricular outflow tract. Future studies of aneurysms from rejected organ donors would provide valuable information regarding failure strength (Supplemental Figure S1).
BAV-aTAA Morphology
Different classifications systems for BAV-aTAA morphology have been proposed to correlate morphology to clinical behavior.1,22,27,28 Della Corte and colleagues22 devised a binary classification of root vs AscAo type based on predominant regions of dilation. They found that the root phenotype exhibited a faster aneurysm growth rate compared with the AscAo phenotype.22 In this study, no significant differences in peak stresses in each region between root and AscAo phenotypes were found with stress distributions that mirrored the overall population. Furthermore, no significant differences in circumferential or longitudinal peak stresses were found based on the presence or absence of STJ effacement. The sample size limits our ability to fully explore the effect of morphology and STJ effacement on peak wall stresses. Classification by aneurysm morphology may serve in the future as a prognostic tool.
Study Limitations
One study limitation is that BAV-aTAA was assumed to be homogenous across regions and subjects. While regional variations can exist, CTA does not provide wall thickness or material properties,29,30 and Displacement Encoding with Stimulated Echoes magnetic resonance imaging was too expensive and time consuming to perform.17 As such, averaged BAV-aTAA material properties were used, which we have shown provides reasonable estimation of patient-specific wall stresses when compared with patient-specific material properties.31 Another limitation is that the present study did not consider fluid-structure interactions or blood flow patterns specific to BAV. Abnormal helical flow patterns and higher velocities have been reported for BAV-aTAAs.21 Wall shear stresses may play an important role in BAV aneurysm growth by influencing endothelial cell regulation of extracellular matrix,32 but are approximately 5 orders of magnitude less than wall stress, with respect to dissection and rupture risk.20 Finally, BAV patients were not classified by valve subphenotype. BAV-aTAA failure properties did not vary by BAV type13; however, studying the effect of subphenotype on peak wall stress would require a much larger population sample for statistical analysis. Thus, we could not explore any potential relationship between wall stress magnitudes and BAV subtype with the study sample size.
Conclusion
We described BAV-aTAA wall stress distribution and found greater wall stresses at the aortic root, particularly the STJ and sinuses, than at the AscAo. These results fill a fundamental gap in knowledge regarding peak stress distributions in BAV-ATAA biomechanics. Our results suggest potential regions of intrinsic vulnerability for initial intimal tear, depending on their relationship with wall strength in these regions. For patients, understanding their individual peak wall stresses in relationship to wall strength may supplement and aid surgical decision making with respect to elective surgery if the ratio of high wall stress to low wall strength suggests a risk of dissection despite not meeting surgical size criteria. This study emphasizes the need and utility of patient-specific criteria for identification and elective repair of high-risk aTAAs.
Supplementary Material
Acknowledgments
This study was supported by National Institutes of Health grant no. R01HL119857-01A1. The authors wish to thank Elise Meike for her work over the summer.
Footnotes
Presented at the Fifty-fifth Annual Meeting of The Society of Thoracic Surgeons, San Diego, CA, Jan 26–29, 2019.
The Video and Supplemental Figure can be viewed in the online version of this article [http://doi.org/10.1016/j.athoracsur.2019.12.035] on http://www.annalsthoracicsurgery.org.
References
- 1.Borger MA, Fedak PWM, Stephens EH, et al. The American Association for Thoracic Surgery Consensus Guidelines on Bicuspid Aortic Valve-Related Aortopathy. J Thorac Cardiovasc Surg. 2018;156:e41–e74. [DOI] [PMC free article] [PubMed] [Google Scholar]
- 2.Tadros TM, Klein MD, Shapira OM. Ascending aortic dilatation associated with bicuspid aortic valve: pathophysiology, molecular biology, and clinical implications. Circulation. 2009;119:880–890. [DOI] [PubMed] [Google Scholar]
- 3.Etz CD, von Aspern K, Hoyer A, et al. Acute type A aortic dissection: characteristics and outcomes comparing patients with bicuspid versus tricuspid aortic valve. Eur J Cardiothorac Surg. 2015;48:142–150. [DOI] [PubMed] [Google Scholar]
- 4.Michelena HI, Khanna AD, Mahoney D, et al. Incidence of aortic complications in patients with bicuspid aortic valves. JAMA. 2011;306:1104–1112. [DOI] [PubMed] [Google Scholar]
- 5.Chiappini B, Schepens M, Tan E, et al. Early and late outcomes of acute type A aortic dissection: analysis of risk factors in 487 consecutive patients. Eur Heart J. 2005;26:180–186. [DOI] [PubMed] [Google Scholar]
- 6.Hiratzka LF, Bakris GL, Beckman JA, et al. 2010 ACCF/AHA/AATS/ACR/ASA/SCA/SCAI/SIR/STS/SVM Guidelines for the Diagnosis and Management of Patients with Thoracic Aortic Disease. A report of the American College of Cardiology Foundation/American Heart Association Task Force on Practice Guidelines, American Association for Thoracic Surgery, American College of Radiology,American Stroke Association, Society of Cardiovascular Anesthesiologists, Society for Cardiovascular Angiography and Interventions, Society of Interventional Radiology, Society of Thoracic Surgeons,and Society for Vascular Medicine. J Am Coll Cardiol. 2010;55:e27–e129. [DOI] [PubMed] [Google Scholar]
- 7.Hiratzka LF, Creager MA, Isselbacher EM, et al. Surgery for aortic dilatation in patients with bicuspid aortic valves: a statement of clarification from the American College of Cardiology/American Heart Association Task Force on Clinical Practice Guidelines. J Thorac Cardiovasc Surg. 2016;151:959–966. [DOI] [PubMed] [Google Scholar]
- 8.Jaussaud N, Chitsaz S, Meadows A, et al. Acute type A aortic dissection intimal tears by 64-slice computed tomography: a role for endovascular stent-grafting? J Cardiovasc Surg. 2013;54:373–381. [PubMed] [Google Scholar]
- 9.Pape LA, Tsai TT, Isselbacher EM, et al. Aortic diameter >or = 5.5 cm is not a good predictor of type A aortic dissection: observations from the International Registry of Acute Aortic Dissection (IRAD). Circulation. 2007;116:1120–1127. [DOI] [PubMed] [Google Scholar]
- 10.Rylski B, Branchetti E, Bavaria JE, et al. Modeling of predissection aortic size in acute type A dissection: more than 90% fail to meet the guidelines for elective ascending replacement. J Thorac Cardiovasc Surg. 2014;148: 944–948.e1. [DOI] [PubMed] [Google Scholar]
- 11.Svensson LG, Kim KH, Lytle BW, Cosgrove DM. Relationship of aortic cross-sectional area to height ratio and the risk of aortic dissection in patients with bicuspid aortic valves. J Thorac Cardiovasc Surg. 2003;126:892–893. [DOI] [PubMed] [Google Scholar]
- 12.Vorp DA, Schiro BJ, Ehrlich MP, Juvonen TS, Ergin MA, Griffith BP. Effect of aneurysm on the tensile strength and biomechanical behavior of the ascending thoracic aorta. Ann Thorac Surg. 2003;75:1210–1214. [DOI] [PubMed] [Google Scholar]
- 13.Deveja RP, Iliopoulos DC, Kritharis EP, et al. Effect of aneurysm and bicuspid aortic valve on layer-specific ascending aorta mechanics. Ann Thorac Surg. 2018;106:1692–1701. [DOI] [PubMed] [Google Scholar]
- 14.Pichamuthu JE, Phillippi JA, Cleary DA, et al. Differential tensile strength and collagen composition in ascending aortic aneurysms by aortic valve phenotype. Ann Thorac Surg. 2013;96:2147–2154. [DOI] [PMC free article] [PubMed] [Google Scholar]
- 15.Martin C, Sun W, Elefteriades J. Patient-specific finite element analysis of ascending aorta aneurysms. Am J Physiol Heart Circ Physiol. 2015;308:H1306–H1316. [DOI] [PMC free article] [PubMed] [Google Scholar]
- 16.Xuan Y, Wang Z, Liu R, et al. Wall stress on ascending thoracic aortic aneurysms with bicuspid compared with tricuspid aortic valve. J Thorac Cardiovasc Surg. 2018;156:492–500. [DOI] [PMC free article] [PubMed] [Google Scholar]
- 17.Krishnan K, Ge L, Haraldsson H, et al. Ascending thoracic aortic aneurysm wall stress analysis using patient-specific finite element modeling of in vivo magnetic resonance imaging. Interact Cardiovasc Thorac Surg. 2015;21: 471–480. [DOI] [PMC free article] [PubMed] [Google Scholar]
- 18.Beller CJ, Labrosse MR, Thubrikar MJ, Robicsek F. Role of aortic root motion in the pathogenesis of aortic dissection. Circulation. 2004;109:763–769. [DOI] [PubMed] [Google Scholar]
- 19.Azadani AN, Chitsaz S, Mannion A, et al. Biomechanical properties of human ascending thoracic aortic aneurysms. Ann Thorac Surg. 2013;96:50–58. [DOI] [PubMed] [Google Scholar]
- 20.Pasta S, Rinaudo A, Luca A, et al. Difference in hemodynamic and wall stress of ascending thoracic aortic aneurysms with bicuspid and tricuspid aortic valve. J Biomech. 2013;46: 1729–1738. [DOI] [PMC free article] [PubMed] [Google Scholar]
- 21.Nathan DP, Xu C, Plappert T, et al. Increased ascending aortic wall stress in patients with bicuspid aortic valves. Ann Thorac Surg. 2011;92:1384–1389. [DOI] [PMC free article] [PubMed] [Google Scholar]
- 22.Della Corte A, Bancone C, Dialetto G, et al. The ascending aorta with bicuspid aortic valve: a phenotypic classification with potential prognostic significance. Eur J Cardiothorac Surg. 2014;46:240–247. [DOI] [PubMed] [Google Scholar]
- 23.Parish LM, Gorman JH 3rd, Kahn S, et al. Aortic size in acute type A dissection: implications for preventive ascending aortic replacement. Eur J Cardiothorac Surg. 2009;35: 941–945. [DOI] [PubMed] [Google Scholar]
- 24.Wisneski AD, Mookhoek A, Chitsaz S, et al. Bicuspid aortic valve-associated ascending thoracic aortic aneurysm: patient-specific finite element analysis. J Heart Valve Dis. 2015;24:714–721. [PMC free article] [PubMed] [Google Scholar]
- 25.Pham T, Martin C, Elefteriades J, Sun W. Biomechanical characterization of ascending aortic aneurysm with concomitant bicuspid aortic valve and bovine aortic arch. Acta Biomater. 2013;9:7927–7936. [DOI] [PMC free article] [PubMed] [Google Scholar]
- 26.Moon MC, Pablo Morales J, Greenberg RK. Complicated acute type B dissection and endovascular repair: indications and pitfalls. Perspect Vasc Surg Endovasc Ther. 2007;19:146–159. [DOI] [PubMed] [Google Scholar]
- 27.Schaefer BM, Lewin MB, Stout KK, et al. The bicuspid aortic valve: an integrated phenotypic classification of leaflet morphology and aortic root shape. Heart. 2008;94:1634–1638. [DOI] [PubMed] [Google Scholar]
- 28.Kari FA, Fazel SS, Mitchell RS, Fischbein MP, Miller DC. Bicuspid aortic valve configuration and aortopathy pattern might represent different pathophysiologic substrates. J Thorac Cardiovasc Surg. 2012;144:516–517. [DOI] [PubMed] [Google Scholar]
- 29.Wisneski AD, Mookhoek A, Chitsaz S, et al. Patient-specific finite element analysis of ascending thoracic aortic aneurysm. J Heart Valve Dis. 2014;23:765–772. [PMC free article] [PubMed] [Google Scholar]
- 30.Choudhury N, Bouchot O, Rouleau L, et al. Local mechanical and structural properties of healthy and diseased human ascending aorta tissue. Cardiovasc Pathol. 2009;18:83–91. [DOI] [PubMed] [Google Scholar]
- 31.Wang Z, Xuan Y, Guccione JM, Tseng EE, Ge L. Impact of patient-specific material properties on aneurysm wall stress: finite element study. J Heart Valv Dis. 2019. In press. [PMC free article] [PubMed] [Google Scholar]
- 32.Bollache E, Guzzardi DG, Sattari S, et al. Aortic valve-mediated wall shear stress is heterogeneous and predicts regional aortic elastic fiber thinning in bicuspid aortic valve-associated aortopathy. J Thorac Cardiovasc Surg. 2018;156: 2112–2120.e2. [DOI] [PMC free article] [PubMed] [Google Scholar]
Associated Data
This section collects any data citations, data availability statements, or supplementary materials included in this article.