

Abstract
Multiple microRNAs exhibit diverse functions to regulate inflammatory and autoimmune diseases. MicroRNA-99a (miR-99a) has been shown to be involved in adipose tissue inflammation and to be downregulated in the inflammatory lesions of autoimmune diseases rheumatoid arthritis and systemic lupus erythematosus. In this study, we found that miR-99a was downregulated in CD4+ T cells from experimental autoimmune encephalomyelitis (EAE) mice, an animal model of multiple sclerosis. Overexpression of miR-99a alleviated EAE development by promoting regulator T cells and inhibiting T helper type 1 (Th1) cell differentiation. Bioinformatics and functional analyses further revealed that the anti-inflammatory effects of miR-99a was attributable to its role in negatively regulating glycolysis reprogramming of CD4+ T cells by targeting the mTOR pathway. Additionally, miR-99a expression was induced by transforming growth factor β (TGF-β) to regulate CD4+ T cell glycolysis and differentiation. Taken together, our results characterize a pivotal role of miR-99a in regulating CD4+ T cell differentiation and glycolysis reprogramming during EAE development, which may indicate that miR-99a is a promising therapeutic target for the amelioration of multiple sclerosis and possibly other autoimmune diseases.
Keywords: miR-99a, EAE, T-cell differentiation, glycolysis, mTOR, TGF-β
Graphical abstract
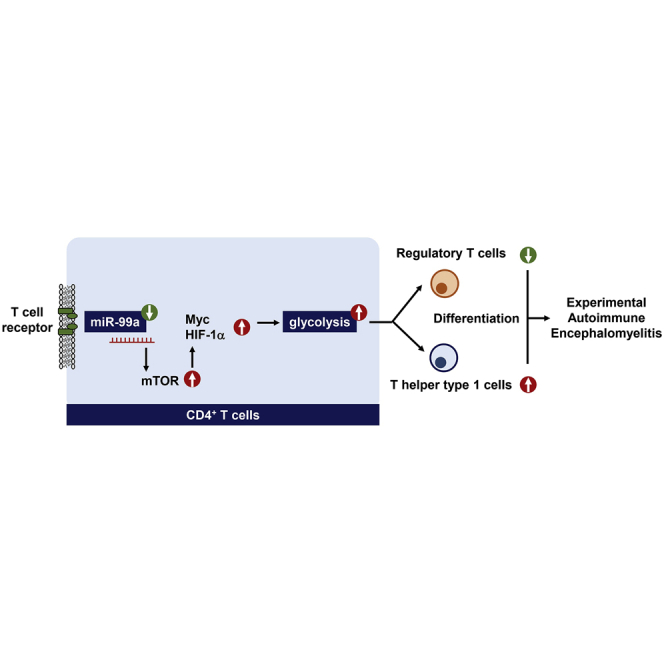
miR-99a promotes Treg and inhibits Th1 cell differentiation to alleviate EAE development, which is attributable to its role in negatively regulating mTOR-dependent glycolysis. The current study characterizes a pivotal role of miR-99a in regulating CD4+ T cell differentiation during EAE development and represents a promising therapeutic approach for EAE.
Introduction
Multiple sclerosis (MS) is an autoimmune disease that is characterized by central nervous system (CNS) inflammation, demyelination, axonal loss, and degeneration.1 Myelin oligodendrocyte glycoprotein (MOG)35–55-induced experimental autoimmune encephalomyelitis (EAE) is a commonly studied autoimmune and inflammatory disease model of human MS.2 CD4+ T-cell-mediated autoimmunity has long been accepted as one of the most important aspects of MS and EAE pathogenesis. Early studies indicated that T helper type 1 (Th1) cells, characterized by the production of interferon-γ (IFN-γ), are effector helper T cells that mediate the pathogenesis of MS. Subsequent studies indicated that Th17 cells, mainly producing interleukin 17 (IL-17), are also involved and are at least as critical as Th1 cells in this pathogenesis, as shown by the depletion of Th17 cells preventing or alleviating the symptoms of EAE in mice. In addition, regulatory T (Treg) cells can reduce injury to the blood-brain barrier by preventing T cell and macrophage infiltration and inhibiting the function and differentiation of Th1 and Th17 cells.3, 4, 5 Thus, interventions that seek to rebalance the differentiation of Th1, Th17, and Treg cells may be effective therapeutic approaches for MS and EAE.
MicroRNAs (miRNAs) constitute a large family of noncoding RNAs and have emerged as key posttranscriptional modulators of gene expression by targeting mRNAs for translational repression or destabilization.6,7 Hundreds of identified mammalian miRNAs have been found to be important in various biological events and involved in a range of human diseases, potentially serving as diagnostic markers, prognostic markers, or therapeutic targets.8,9 miRNAs also render profound effects on immune responses, including T-cell-mediated autoimmunity.10 For instance, enforced expression of the miR-17–92 cluster in T cells or Dicer deficiency in Treg cells can trigger lethal autoimmunity.11, 12, 13 miR-155 enhances T-cell differentiation to Th17 cells, thus promoting EAE pathogenesis.14 miR-99a, as a well-known tumor suppressor in various kinds of cancers,15,16 has recently been demonstrated to inhibit M1 phenotype polarization of macrophages and to be involved in the regulation of adipose tissue inflammation and insulin sensitivity.17 Although the potential roles of miR-99a in autoimmune diseases remain unknown, miR-99a expression was decreased in inflammatory lesions of the autoimmune diseases rheumatoid arthritis and systemic lupus erythematosus,18 and miR-99a promoted Treg-cell differentiation in vitro.19 In view of these findings, we set out to examine a possible role for miR-99a in EAE and CD4+ T-cell-mediated autoimmunity.
In the present study, we characterized a previously unknown function of miR-99a in CD4+ T-cell differentiation (mainly Th1 and Treg cells) and glycolysis reprogramming during EAE development and identified miR-99a as a potential therapeutic target for the amelioration of EAE.
Results
miR-99a is downregulated in CD4+ T cells of EAE mice
To gain insight into the potential role of miR-99a in EAE, we assessed miR-99a expression in CD4+ T cells obtained from the CNS and draining lymph nodes (DLNs) of MOG35–55-induced EAE mice 14 days after immunization. In our cohort of 10 EAE mice at 14 days after immunization, the scores ranged from 0 to 3, with means ± SEM of 1.45 ± 1.117 and a median of 1.25 (Figure 1A). Real-time PCR analysis showed that miR-99a expression was lower in CD4+ T cells from the EAE mice than it was in the naive mice in the early stage (Figure 1B). To analyze the relationship between miR-99a expression and disease severity, the maximal clinical score, accumulated clinical score, and severity index (a novel paradigm similar to the progression index used in MS) of the EAE mice were evaluated, as previously described,20 and miR-99a expression in CD4+ T cell in the CNS was detected in EAE mice at the peak of their clinical symptoms. miR-99a expression in CD4+ T cells from the CNS was consistently decreased in EAE mice compared with that of naive mice (Figure 1C). In this cohort of 10 EAE mice, the severity index ranged from 1.75–3.1, with a means ± SEM of 2.315 ± 0.4175 and a median of 2.2. The miR-99a expression in CD4+ T cells was not significantly correlated with the maximal or accumulated clinical score, whereas a very significant inverse correlation was observed between miR-99a expression and the severity index of each animal (Figure 1D), suggesting that miR-99a expression in CD4+ T cells was negatively related to the severity of symptoms in the EAE mice.
Figure 1.

miR-99a is downregulated in CD4+ T cells of EAE mice
(A) The clinical score of the naive and EAE mice (14 days after immunization; n = 10). (B) Real-time PCR analysis of miR-99a expression in CD4+ T cells obtained from the CNS and DLNs of naive and EAE mice (14 days after immunization; n = 10). (C) Real-time PCR analysis of miR-99a expression in CD4+ T cells from the CNS of naive and EAE mice (at the peak of their clinical symptoms; n = 10). (D) Correlation among the maximal score, accumulated clinical score, and severity index with the transcripts of miR-99a in CD4+ T cells from the CNS of the EAE mice (at the peak of their clinical symptoms; n = 10). (E) Correlation between transcripts of miR-99a and various cytokines in CD4+ T cells obtained from the CNS and DLNs of the EAE mice (14 days after immunization; n = 10). ND, no detection. The values shown are the means ± SEM. ∗p < 0.05. ∗∗p < 0.01 (Mann-Whitney U test and Spearman R analysis).
Because CD4+ T cells participate in EAE pathogenesis, differentiating with a phenotype of Th1, Th17, and Treg cells and producing IFN-γ, IL-17, and transforming growth factor β (TGF-β), respectively, the association between these different helper T cell subsets and miR-99a in EAE mice at 14 days after immunization was investigated. The correlation analysis demonstrated a negative correlation between miR-99a and Ifng (Th1 cell) expression and a positive correlation between miR-99a and Tgfb1 (Treg cell) expression, whereas the correlation was rather weak between miR-99a and Il17a (Th17 cell) expression (Figure 1E). Therefore, the downregulation of miR-99a and its steadfast correlation with the CD4+ T cell subset genes in EAE prompted us to expand the horizon and determine the modulation mechanism of the pathogenesis of EAE.
miR-99a suppresses EAE pathogenesis
To investigate whether miR-99a directly influences EAE development, we constructed lentiviral vectors for in vivo miR-99a manipulation. Using a high-efficiency recombinant lentivirus containing a pre-miR-99a (lenti-99a) sequence (Figures S1A–S1C), we inoculated naive mice intravenously (i.v.) at 4 × 10⁷ plaque-forming units (pfu)/mouse and assessed the in vivo efficacy of lentivirus infection 7 days later by detecting of the miR-99a expression in various organs of the lenti-99a and lenti-control-infected, naive mice. As previously reported,21,22 systemic lentivirus administration led to the expression of different transgenes in various organs, with the liver being most susceptible, and the brain, spinal cord, and lungs being least susceptible to infection by the virus (Figure S1D). In secondary lymphoid organs, such as the spleen and peripheral lymph nodes, a greater expression of mature miR-99a was detected after lenti-99a inoculation (Figure 2A), and miR-99a expression was also upregulated in CD4+ T cells (Figure 2B). In addition, there was no difference in the peripheral lymphocyte population (T and B lymphocytes) or the CD4+/CD8+ T cell ratio in the resting state in the mice inoculated with lenti-99a and those inoculated with the lenti-control (Figures S1E and S1F), indicating a dispensable role of miR-99a in the homeostasis of the lymphocyte repertoire in naive mice.
Figure 2.

miR-99a suppresses EAE pathogenesis
(A and B) Real-time PCR analysis of miR-99a expression in the bone marrow, lymph nodes, and spleen or CD4+ T cells of naive mice infected with lenti-99a and lenti-control (n = 5). (C) Clinical scores of the EAE mice infected with lenti-control and lenti-99a (n = 9). (D and E) Histology of the paraffin sections of the spinal cords obtained from the lenti-99a or lenti-control EAE mice (21 days after immunization) and histopathology scores of CNS inflammation and demyelination were quantified (n = 5). Arrows indicate inflammatory infiltrations in a H&E-stained sample (left), and the demyelinated areas were identified by a black dashed line in a Luxol fast blue-stained sample (right). Scale bars, 70 μm. (F) Flow cytometry analysis of the absolute numbers of CD45+ cells in the CNS of the lenti-99a and lenti-control EAE mice (21 days after immunization, n = 5). (G) IF staining of neurofilaments in the spinal cord sections of the lenti-99a or lenti-control EAE mice (21 days after immunization). Scale bars, 70 μm. The values shown are the means ± SEM. ∗∗p < 0.01, ∗∗∗p < 0.001 (two-way ANOVA and Mann-Whitney U test).
We then immunized lentivirus-infected, naive mice with MOG35–55 to induce EAE. Compared with the lenti-control-infected mice, the lenti-99a-infected mice developed less-severe EAE (Figure 2C). The histological analysis of spinal cord sections also showed that the observed therapeutic effects of lenti-99a inoculation were consistent, showing much less infiltration of inflammatory cells and fewer demyelinated plaques in the white matter of the lenti-99a-infected EAE mice compared with the lenti-control-infected mice (Figures 2D–2F). Immunofluorescence (IF) staining of the spinal cord slices showed increased neurofilament levels in the lenti-99a-infected EAE mice than in the lenti-control-infected mice (Figure 2G), indicating the downregulation of axonal degeneration in the EAE mice after miR-99a overexpression. These data suggest that miR-99a suppresses EAE pathogenesis.
miR-99a regulates the balance of effector CD4+ T and Treg cells in the EAE mice
We then sought to determine whether miR-99a-modulated EAE was associated with altered infiltration of effector helper T cells (mainly Th1 and Th17 cells) and Treg cells in the CNS. Compared with that in the lenti-control-infected EAE mice, there were much fewer immune cells (CD45+) and CD4+ T cells infiltrating the CNS in the lenti-99a-infected EAE mice, whereas there were no changes in CD8+ T cells and B (B220+) cells between these two groups (Figures 3A–3C and S2A). In addition, fewer macrophages (CD11b+F4/80+) but more monocytic myeloid-derived suppressor cells (M-MDSCs, CD11b+Ly-6ChighLy-6Glow) and polymorphonuclear MDSCs (PMN-MDSCs, CD11b+Ly-6ClowLy-6Ghigh) were observed in the CNS of the lenti-99a-infected EAE mice (Figures 3D, S2B, and S2C). Intracellular cytokine staining showed that the frequency of Th1 and Th17 cells was decreased and that of Treg cells increased more in the lenti-99a-infected EAE mice compared with the lenti-control-infected EAE mice (Figures 3E and 3F).
Figure 3.

miR-99a regulates the balance of effector CD4+ T and Treg cells in EAE mice
(A–D) Flow cytometry of the immune cells in the CNS of the lenti-99a or lenti-control EAE mice. (E and F) Flow cytometry of Th1, Th17, and Treg cells in the CNS of the lenti-99a and lenti-control EAE mice (n = 5). (G–I) Flow cytometry of CD4+ T, Th1, Th17, and Treg cells in the DLNs of the lenti-99a and lenti-control EAE mice (n = 5). (J and K) MNCs from the DLNs were stimulated with MOG35–55 (5 μg/mL) ex vivo. Cell proliferation was examined by [3H]-thymidine incorporation, and the levels of the cytokines IFN-γ, IL-17, and TGF-β were analyzed by ELISA (n = 5). The values shown are the means ± SEM. ∗∗p < 0.01, ∗∗∗p < 0.001 (two-way ANOVA and Mann-Whitney U test).
The frequencies of effector T cells and Treg cells primed in peripheral lymph nodes in the EAE mice were also examined after in vivo miR-99a manipulation. The data revealed that the percentage and absolute number of CD4+ T cells were decreased in the DLNs of the lenti-99a-infected EAE mice (Figures 3G–3I and S3). Consistent with CNS-infiltrated immune cells, fewer Th1 cells but more Treg cells were found in the DLNs of the lenti-99a-infected EAE mice than that in the lenti-control-infected EAE mice, whereas no obvious difference in the number of Th17 cells was observed (Figure 3I). When ex vivo restimulation with MOG35–55 was performed, incorporation of [3H]-thymidine showed that antigen-specific lymphocyte proliferation in the DLNs of the lenti-99a-infected EAE mice was less than that in the lenti-control-infected EAE mice (Figure 3J). In addition, the antigen-specific Th1 cell response was less, but the Treg cell response was greater, in the DLN cells of the lenti-99a-infected EAE mice, as shown by the measurements of IFN-γ and TGF-β in the culture supernatants of the DLN cells after ex vivo restimulation with MOG35–55 (Figure 3K). However, the production of Th17-cell-related cytokine IL-17 was not obviously affected by miR-99a (Figure 3K). These data collectively indicate that miR-99a reduces Th1 cell differentiation and enhances Treg cell differentiation during EAE pathogenesis.
miR-99a suppresses glycolysis in CD4+ T cells
Glycolysis has been demonstrated to promote Th1 cell differentiation but inhibit Treg cell differentiation,23,24 and intervening glycolysis of CD4+ T cells can modulate Th1 and Treg cell differentiation to alleviate EAE development.25,26 Thus, we examined whether miR-99a-regulated CD4+ T-cell glycolysis in EAE mice. After inoculation with lenti-99a lentivirus, the glucose uptake of CD4+ T cells in the CNS of the EAE mice significantly was decreased (Figure 4A). Examination of the expression of multiple genes (Hk2, Pgam1, Pkm, Slc2a3, and Ldha) involved in glycolysis also revealed the negative regulation of CD4+ T-cell glycolysis by miR-99a in the EAE mice (Figure 4B).
Figure 4.

miR-99a suppresses glycolysis in CD4+ T cells
(A and B) Flow cytometry was performed to determine 2-NBDG uptake and real-time PCR analysis was performed to measure the expression of genes in the glycolysis pathway (Hk2, Pgam1, Pkm, Slc2a3, and Ldha) in CD4+ T cells obtained from the CNS of the lenti-99a or lenti-control-infected EAE mice (n = 5). Freshly isolated, naive CD4+ T cells were activated by anti-CD3/CD28 antibodies. (C–E) miR-99a expression was analyzed by real-time PCR, the uptake of 2-NBDG was analyzed by flow cytometry, and the level of L-lactate was measured in the cell culture supernatants (n = 4). Mimic-NC and mimic-99a-transfected CD4+ T cells were activated by anti-CD3/CD28 antibodies. (F–H) The uptake of 2-NBDG, the level of l-lactate and expression of the genes in the glycolysis pathway were analyzed (n = 4). (I–K) A glycolytic stress test was performed with an XF96 extracellular analyzer. The ECAR, OCR, and ECAR/OCR ratio were measured (n = 4). The values shown are the means ± SEM. ∗p < 0.05, ∗∗p < 0.01, ∗∗∗p < 0.001 (two-way ANOVA and Mann-Whitney U test).
To directly assess the effect of miR-99a on T cell glycolysis, an in vitro T-cell-glycolysis assay was performed. When CD4+ T cells were activated in vitro, miR-99a expression decreased, whereas the level of glycolysis increased (Figures 4C–4E). We then overexpressed miR-99a in CD4+ T cells through nucleofection with a miR-99a mimic (mimic-99a). The nucleofection efficiency was indicated by the intensity of the fluorescence of the CY3 label on the miR-NC, and real-time PCR confirmed the success of the nucleofection in activated CD4+ T cells (Figure S4). Consistent with the altered glycolysis of CD4+ T cells in the EAE mice in vivo, overexpression of miR-99a led to a marked reduction in glucose uptake, l-lactate production, and the expression of glycolysis-related genes (Figures 4F–4H). We also examined the extracellular acidification rate (ECAR) and oxygen consumption rate (OCR), which together represent a direct indicator of glycolytic activity. Activated CD4+ T cells overexpressing miR-99a exhibited a lower level of ECAR (Figure 4I). Although the OCR was also reduced by miR-99a, the ECAR/OCR ratio was still significantly reduced (Figures 4J and 4K). These findings suggest that miR-99a is a crucial repressor of glycolysis in CD4+ T cells.
miR-99a-mediated glycolysis suppression modulates Treg and Th1 cell differentiation
We next assessed whether miR-99a-regulated T-cell-glycolysis suppression was required for Th1 or Treg cell differentiation. After inducing Th1 and Treg cell differentiation in vitro (Figures S5A and S5B), we found that the glycolysis level in Th1 cells was higher than that in Treg cells, and the expression of miR-99a was much greater in Treg cells than it was in Th1 cell (Figures 5A–5C). miR-99a was reduced during Treg cell differentiation by the miR-99a inhibitor (Figure 5D). After miR-99a inhibition, the glycolysis level was augmented, as indicated by the upregulated glucose uptake and increased l-lactate production (Figures 5E and 5F). Functionally, as shown in Figure 5G, upon miR-99a inhibition, Treg cell differentiation was greatly inhibited. Interestingly, we found that the expression of two key molecules, ICOS and PD-1, indicative of the immunosuppressive capabilities of Treg cells was downregulated, and the immunosuppressive functions of Treg cells were also impaired upon miR-99a inhibition (Figures 5H and 5I). An antagonist of glycolysis, 2-DG, reversed the effects of miR-99a inhibition on the differentiation and immunosuppressive capabilities of Treg cells, as expected (Figures 5G–5I). We further overexpressed miR-99a during Th1 cell differentiation, and the data showed that miR-99a overexpression inhibited glucose uptake and l-lactate production (Figures 5J–5L). We then analyzed Th1 cell differentiation by detecting the amounts of cytokine INF-γ and the expression of transcription factor T-bet. miR-99a overexpression inhibited Th1 generation, as indicated by the decreases in interferon gamma (INF-γ) production and T-bet expression. The glycolysis agonist phosphoenolpyruvate (PEP) reversed the effects of miR-99a overexpression (Figures 5M and 5N). In general, these data demonstrate miR-99a can inhibit glycolysis in Th1 and Treg cells, thereby inhibiting Th1 cell differentiation and promoting Treg cell differentiation.
Figure 5.

miR-99a-mediated glycolysis suppression modulates Treg and Th1 cell differentiation
(A–C) The uptake of 2-NBDG, the level of l-lactate, and miR-99a expression were analyzed in Th1 and Treg cells (n = 4). (D–F) miR-99a expression, the uptake of 2-NBDG, and the level of l-lactate were analyzed in the miR-NC and miR-99a inhibitor (99a-inhibitor)-transfected Treg cells (n = 4). (G and H) Flow cytometry of Foxp3 and real-time PCR analysis of PD-1 (Pdcd1) and ICOS (Icos) expression in miR-NC and 99a-inhibitor-transfected Treg cells treated with 2-DG (1 mM) or DMSO (n = 4). (I) Treg cells transfected with miR-NC or 99a-inhibitor and treated with 2-DG were cocultured with effector CD4+ T cells at different ratios, and effector CD4+ T cell proliferation was measured by [3H]-thymidine incorporation (n = 4). (J–L) miR-99a expression, the uptake of 2-NBDG, and the level of l-lactate were analyzed in mimic-NC and mimic-99a-tranfected Th1 cells (n = 4). (M and N) Flow cytometry of IFN-γ and real-time PCR analysis of T-bet (Tbx21) expression in miR-NC or 99a-inhibitor-tranfected Th1 cells treated with PEP (100 nM, n = 4). The values shown are the means ± SEM. ∗p < 0.05, ∗∗p < 0.01, ∗∗∗p < 0.001 (two-way ANOVA, one-way ANOVA, and Mann-Whitney U test).
miR-99a regulates CD4+ T cell differentiation and glycolysis by targeting mTOR
Previous studies have revealed that miR-99a functions by targeting on mammalian target of rapamycin (mTOR)19,27 and that mTOR is a pivotal regulator of T cell differentiation and glycolysis.24,28 We therefore explored whether mTOR is involved in miR-99a-regulated CD4+ T cell differentiation and glycolysis. A bioinformatics analysis revealed that putative miR-99a-binding elements in the 3′ untranslated region (UTR) of mTOR (Figure 6A), and the luciferase assay showed that miR-99a inhibited the luciferase activity of a reporter with mtor 3′ untranslated regions (UTRs) (Figure 6B). Overexpression of miR-99a in activated CD4+ T cells showed the inhibitory potential of miR-99a on the expression of mTOR and its downstream signaling cascades, such as Akt and S6 phosphorylation (Figures 6C and 6D). In addition, the expression of Myc and Hif-1α, which is required for mTOR-regulated glycolysis, was accordingly decreased (Figure 6E). When mTOR was overexpressed by nucleofection with the myc-mTOR plasmid, the suppressive effect of miR-99 on Myc and Hif-1α expression was reversed (Figure 6E). In addition, mTOR overexpression reversed the glycolysis suppression of miR-99a, as indicated by the restoration of miR-99a-downregulated glucose uptake and l-lactate production in CD4+ T cells upon mTOR overexpression (Figures 6F and 6G). Functionally, mTOR overexpression reversed miR-99a-downregulated Th1 cell differentiation, whereas inhibition of mTOR by rapamycin reversed the miR-99a-inhibition-induced downregulation of Treg cell differentiation (Figures 6H and 6I).
Figure 6.

miR-99a regulates CD4+ T cell differentiation and glycolysis by targeting mTOR
(A) Targeting sequence of miR-99a and the 3′ UTR of mTOR. (B) Luciferase activity was measured in 293T cells cotransfection with psiCheck 2-mTOR 3′ UTR and miR-NC or miR-99a (n = 4). (C and D) Real-time PCR analysis of mTOR expression and western blot analysis of the mTOR pathway proteins in activated mimic-NC and mimic-99a-tranfected CD4+ T cells (n = 4). (E–G) Western blot analysis of mTOR, Myc and Hif-1α in activated mimic-NC, and mimic-99a-tranfected CD4+ T cells expressing pCDNA-NC or pCDNA-mTOR. The uptake of 2-NBDG and the level of l-lactate were analyzed (n = 4). (H) Flow cytometry of IFN-γ expression in mimic-NC or mimic-99a-transfected CD4+ T cells expressing pCDNA-NC or pCDNA-mTOR under Th1 differentiation conditions. (I) Flow cytometry of Foxp3 expression in miR-NC or miR-99a-inhibitor-transfected Treg cells treated with rapamycin (50 nM). (J) Real-time PCR analysis of miR-99a and mTOR expression in CD4+ T cells obtained from the CNS of naive and EAE mice (n = 5). (K and L) Flow cytometry and real-time PCR analysis of mTOR, Myc and Hif-1α expression in CD4+ T cells obtained from the CNS and DLNs of EAE mice infected with lenti-control or lenti-99a (n = 5). (M) Clinical scores of the EAE mice infected with lenti-control, lenti-99a, or lenti-99a + lenti-mTOR (n = 5). The values shown are the means ± SEM. ∗p < 0.05, ∗∗p < 0.01, ∗∗∗p < 0.001 (Mann-Whitney U test, one-way ANOVA, and two-way ANOVA).
We further confirmed that mTOR was indeed regulated by miR-99a in the pathogenesis of EAE. As shown in Figure 6J, a similar inverse correlation was found between the expression of miR-99a and mTOR in CD4+ T cells obtained from the mice with EAE compared with those from the naive mice. As expected, the protein and mRNA expression of mTOR in CD4+ T cells from the EAE mice decreased after inoculation with lenti-99a lentivirus (Figures 6K and 6L). The expression of Myc and Hif-1α was decreased accordingly (Figure 6L). We further performed in vivo “rescue” experiments with an mTOR-expressing lentivirus (lenti-mTOR). As shown in Figure 6M, lenti-99a infection alleviated EAE, whereas this alleviation was abrogated by coinfection with lenti-mTOR, indicating that restoration of mTOR protein reversed the effect of miR-99a on EAE development (Figure 6M). In general, our data indicate that miR-99a targets mTOR to downregulate CD4+ T glycolysis and commit CD4+ T cell differentiation, thereby suppressing EAE development.
TGF-β modifies glycolysis in CD4+ T cells by inducing miR-99a
As mentioned above, miR-99a expression was positively correlated with Tgfb1 (Figure 1B), and TGF-β is well-accepted as a cytokine essential for Treg cell induction. We wanted to untangle the association between miR-99a expression and TGF-β treatment. As shown in Figure 7A, TGF-β gradually induced miR-99a expression in activated CD4+ T cells in a dose-dependent manner. Unsurprisingly, TGF-β also dampened glucose uptake and mTOR expression in activated CD4+ T cells (Figures 7B and 7C). Inhibition of miR-99a confirmed that TGF-β restrained glycolysis and mTOR expression through miR-99a (Figures 7D and 7E). Similarly, inhibition of miR-99a suppressed TGF-β-induced Treg cell differentiation (Figure 5G). In addition, sporadic data suggested the inhibition of Th1 cell differentiation that had been induced by TGF-β,29 and TGF-β-induced miR-99a expression inhibited glycolysis, which potentially reduced Th1 cell differentiation; therefore, we next studied the effect of TGF-β on the inhibition of Th1 cell differentiation. When TGF-β was added to the Th1 cell differentiation system, the induction of Th1 cells was indeed increasingly inhibited (Figure 7F), whereas either inhibition of miR-99a or promotion of glycolysis with phosphoenolpyruvate (PEP) restored the expression of IFN-γ (Figure 7G), indicating the indispensable function of miR-99a-mediated glycolysis in TGF-β-inhibited Th1 cell differentiation. Taken together, our data showed that TGF-β induces miR-99a upregulation to inhibit glycolysis, thereby promoting Treg cell differentiation while inhibiting Th1 cell differentiation.
Figure 7.

TGF-β modifies glycolysis in CD4+ T cells by inducingmiR-99a
(A–C) Activated CD4+ T cells were treated with 0, 0.5, 5, or 10 ng/mL TGF-β. miR-99a and mTOR expression and the uptake of 2-NBDG were analyzed (n = 4). (D and E) mimic-NC and 99a-inhibitor-transfected CD4+ T cells were activated by anti-CD3/CD28 antibodies and treated with 5 ng/mL TGF-β. The uptake of 2-NBDG and mTOR expression were analyzed (n = 4). (F) Different doses of TGF-β (0, 0.5, 5, and 10 ng/mL) were added to the culture during Th1 cell differentiation, and IFN-γ expression was analyzed by flow cytometry. (G) TGF-β (5 ng/mL) or PEP (100 nM) was added during Th1 cell differentiation of CD4+ T cells nucleofected with mimic-NC and 99a-inhibitor. Expression of IFN-γ was analyzed by flow cytometry. The values shown are the means ± SEM. ∗p < 0.05, ∗∗p < 0.01 (one-way ANOVA and Mann-Whitney U test).
Discussion
Elucidating the molecular mechanisms affecting T cell differentiation is essential for understanding the pathogenesis of T-cell-mediated autoimmune disorders, including MS and EAE, and for the identification of potential therapeutic targets. Several miRNAs, such as miR-92a, miR-155, miR-326, miR-20b, and let-7e, have been demonstrated to affect the pathogenesis of EAE by regulating Th1, Th17 or Treg cell differentiation, and have been identified as therapeutic targets.11, 12, 13, 14,21,30 In the current study, we found that miR-99a was downregulated in CD4+ T cells of EAE mice. Overexpression of miR-99a promoted Treg cell differentiation and inhibited Th1 cell differentiation, thereby alleviating EAE development. This effect of miR-99a was attributable to its role in negatively regulating glycolysis reprogramming in CD4+ T cells by targeting the mTOR pathway. Additionally, miR-99a expression was induced by TGF-β to regulate CD4+ T cell glycolysis and differentiation.
Previous studies reported that miR-99a expression was decreased under pathological conditions, such as several kinds of cancers,15,16 adipose tissue inflammation,17 and cardiac hypertrophy.31 Here, we identified that miR-99a expression was specifically lower in CD4+ T cells during EAE development, and miR-99a expression was also decreased in CD4+ T cells upon in vitro activation. A recent study also showed that miR-99a expression was decreased in the inflammatory lesions of two other autoimmune diseases rheumatoid arthritis and systemic lupus erythematosus.18 We then manipulated miR-99a expression in vivo and demonstrated that miR-99a overexpression attenuated EAE development, reflected by greatly reduced infiltration of inflammatory cells and fewer demyelinated plaques in the white matter of the lenti-99a-infected EAE mice compared with the lenti-control-infected mice. The downregulated axonal degeneration in the EAE mice after miR-99a overexpression, indicated by increased neurofilaments in spinal cords, also confirmed the suppressive effects of miR-99a on EAE development.
Our data further demonstrate a negative correlation between miR-99a and Ifng (Th1 cell) expression and a positive correlation between miR-99a and Tgfb1 (Treg cell) expression in CD4+ T cells of the EAE mice. A recent study by Warth and colleagues19 reported that miR-99a promoted Treg cell differentiation in vitro. We, therefore, explored the regulatory role of miR-99a on the balance of effector CD4+ T and Treg cells in EAE mice. Interestingly, our results showed that Th1 cell proportion decreased, whereas Treg cell proportion increased in both the CNS and DLN of EAE mice after overexpression of miR-99a in vivo. Decreased proliferation and Th1 cell responses, as well as increased Treg cell responses, were also observed in MOG35–55-challenged T cells from the lenti-99a-infected EAE mice compared with those from the lenti-control-infected EAE mice. In addition, in vitro T cell differentiation analysis demonstrated that miR-99a overexpression inhibited Th1 cell differentiation, whereas miR-99a inhibition impaired Treg cell differentiation and its immunosuppression on CD4+ T cell proliferation. These results demonstrated that miR-99a overexpression reduced Th1 cell differentiation but enhanced Treg cell differentiation, thereby alleviating EAE development.
Our results also showed that miR-99a overexpression downregulated Th17 cell proportion in the CNS but not in the DLNs. Zhang and colleagues32 reported that miRNAs could suppress chemokine-mediated leukocyte migration to alleviate EAE, and miR-99a was also demonstrated to inhibit LPS-induced chemokine production in endothelial cells.33 Thus, we thought that modulating leukocyte migration from peripheral lymph nodes to the CNS might be another reason for miR-99a in attenuating EAE development, which requires further exploration. Recent studies have also reported that miR-99a has an immunomodulatory role in macrophages, in which miR-99a inhibited M1 polarization and is thereby involved in the regulation of adipose tissue and allergic airway inflammation.17,34 Our results showed that there was less macrophage (CD11b+F4/80+) upon miR-99a overexpression; however, the functional changes of macrophages/macroglia, including mediating the inflammatory response, antigen presentation for T cells, and regulating remyelination, were still unclear. M-MDSCs and PMN-MDSCs, which have been shown to have important roles in EAE and exert a relevant influence on CD4+ T cell differentiation,20,35 were increased in the CNS of the lenti-99a-infected EAE mice compared with that of the lenti-control EAE mice. These results suggested that, in addition to the direct effect of miR-99a on CD4+ T cell differentiation, the reduced Th1 cell differentiation but enhanced Treg cell differentiation in the lenti-99a-infected EAE mice was partially due to the effect on MDSCs, which needs further exploration. In addition, Tao and colleagues36 showed that miR-99a exhibited a neuroprotective effect against focal cerebral ischemia-reperfusion injury in mice, and neuroprotection by promoting remyelination was widely considered one of two major aspects of EAE and MS therapy.37 Thus, although we focused on the effect of miR-99a on T cell differentiation in EAE development in the present study, the function of miR-99a on other immune cells and remyelination might be worth future investigation.
Mechanistically, we next attempted to establish that miR-99a regulated Th1/Treg differentiation and EAE through mTOR-mediated glycolysis. Accompanied by miR-99a-attenuated EAE development, glycolysis decreased in CD4+ T cells from the EAE mice, as indicated by the downregulation of glucose uptake and glycolysis-associated gene expression. In vitro assays of metabolic activity also showed that miR-99a downregulated glycolysis in activated CD4+ T cells. Earlier studies have reported that glycolysis promoted Th1 cell differentiation but inhibited Treg cell differentiation,23,24 and intervening glycolysis could regulate Th1 and Treg cell differentiation to alleviate EAE development.25,26 Consistent with the previous studies, our in vitro T cell differentiation analysis showed a higher glycolysis level in Th1 cells than in Treg cells. However, miR-99a expression was lower in Th1 cells than Treg cells. Unsurprisingly, the less miR-99a in Th1 cells resulted in a higher glycolysis level, whereas the higher miR-99a in Treg cells resulted in a lower glycolysis level. In addition, intervening in glycolysis through 2-DG (antagonist) or PEP (agonist) treatment reversed the effects of miR-99a on Th1 and Treg cell differentiation, indicating that miR-99a regulated Th1/Treg cell differentiation through glycolysis reprogramming.
miRNAs posttranscriptionally regulate gene expression by targeting mRNAs. Previous studies have revealed that miR-99a functions by targeting the mRNAs of genes, such as mTOR, NOX4, HOXA1, and KDM6B.19,27,38, 39, 40 Among those target genes, mTOR is well-known to regulate CD4+ T cell differentiation and glycolysis.24,28 Consistently, our bioinformatics analysis showed that mTOR was a target for miR-99a in CD4+ T cells. miR-99a inhibited mTOR expression, its downstream signaling cascade, and glycolysis-associated transcription factor Myc and Hif-1α expression. Functional analysis further revealed that the negative effect of miR-99a on mTOR was required for its role in regulating glycolysis and differentiation of CD4+ T cells. We, then, confirmed a similar inverse correlation between miR-99a and mTOR expression in CD4+ T cells during EAE development. The protein and mRNA expression of mTOR decreased in CD4+ T cells of the EAE mice after inoculation with lenti-99a lentivirus. In vivo rescue experiments of mTOR expression showed that restoration of the mTOR protein reversed the effect of miR-99a on EAE pathogenesis because the alleviation of EAE by lenti-99a infection was abrogated by coinfection with lenti-mTOR. Thus, our data indicated that miR-99a targeted mTOR to regulate CD4+ T cell glycolysis and differentiation, thereby inhibiting EAE development.
The present study also revealed the upstream regulation of miR-99a in CD4+ T cells. Our results showed that miR-99a expression was strongly correlated with Tgfb1, a well-accepted cytokine essential for Treg cell induction. Warth and colleagues19 reported that another Treg inducer, retinoic acid, induced miR-99a expression during Treg cell induction. Our results showed that TGF-β upregulated miR-99a expression in CD4+ T cells, and TGF-β inhibited mTOR-mediated glycolysis in a miR-99a-dependent manner, as reflected by the reversal of TGF-β-downregulated glycolysis by miR-99a inhibition. In addition to being an inducer of Treg cells, TGF-β suppresses Th1 cell generation.29 Our data explained the underlying mechanism of the suppressive effects of TGF-β on Th1 cell differentiation and showed that TGF-β induced miR-99a to inhibit glycolysis, thus thwarting Th1 cell differentiation of CD4+ T cells.
In summary, our findings demonstrate a critical role for miR-99a in CD4+ T cell differentiation and EAE development and reveal the uncommon mechanism by which miR-99a negatively regulates mTOR-mediated glycolysis in CD4+ T cells. In addition, the ameliorating effect of miR-99a on EAE pathogenesis suggests that miR-99a may serve as a potential therapeutic target for MS and possibly for autoimmune diseases.
Materials and methods
Mice
Eight-week-old C57BL/6 female mice were purchased from the Shanghai Laboratory Animal Center of the Chinese Academy of Sciences and maintained under specific-pathogen-free conditions in the animal center of the Institute of Health Sciences, Chinese Academy of Sciences. All animal procedures were approved by the Institutional Review Board of the Institute of Health Sciences, Shanghai Institutes for Biological Sciences, Chinese Academy of Sciences.
Induction of the EAE model
EAE was induced with peptide MOG35–55 (GL Biochem, Shanghai, China) as previously described.41 Briefly, age-matched C57BL/6 mice were subcutaneously immunized with MOG35–55 mixed 1:1 with complete Freund’s adjuvant (Sigma, St. Louis, MO, USA), followed by intraperitoneal (i.p.) administration of pertussis toxin (200 ng; List Biological Laboratories, Campbell, CA, USA) on day 0 and day 2. The mice were examined daily for signs of disease by researchers blinded to the experimental conditions and were assigned scores on a scale of 0–5 as follows: 0, no clinical signs; 1, paralyzed tail; 2, paresis (weakness, incomplete paralysis of one or two hindlimbs); 3, paraplegia (complete paralysis of both hindlimbs); 4, paraplegia with forelimb weakness or paralysis; and 5, moribund state or death. The clinical signs were also established:20 disease onset (the first day with a clinical score between 0.5 and 1.5 and with an increased clinical score the following day), maximal clinical score (“peak” is defined as the first day a repeated clinical score ≥2 was observed or the day before clinical recovery), disease duration at the peak score (days elapsed from symptom onset to the peak score), and accumulated clinical score at the peak (the sum of all the clinical scores): severity index = maximal clinical score/days elapsed from onset to peak.
For analysis of the CNS (a mix of spinal cord and brain) infiltration, spinal cord, and brain tissues were isolated from the EAE mice 14 days after immunization, and the immune cells were prepared by Percoll (GE Healthcare, Chicago, IL, USA) gradient centrifugation. For histological analysis, spinal cords of the EAE mice were isolated 21 days after immunization, dehydrated with alcohol, and embedded in paraffin after cardiac perfusion with 4% paraformaldehyde, and the spinal cord sections were then stained with hematoxylin and eosin (H&E) or luxol fast blue. Inflammation and demyelination scores were calculated as previously described.41 Briefly, spinal cords stained with H&E were used to score inflammation (0, no inflammatory cells; 1, a few scattered inflammatory cells; 2, organization of inflammatory infiltrates around blood vessels; and 3, extensive perivascular cuffing with extension into adjacent parenchyma or parenchymal infiltration). Spinal cords stained with luxol fast blue were used for demyelination scoring (0, no demyelination; 1, a few scattered, naked axons; 2, small groups of naked axons; 3, large groups of naked axons; 4, confluent foci of demyelination). The scores were ascribed by one well-trained, board-certified histopathologist blinded to the groups of mice.
IF
After cardiac perfusion with 4% paraformaldehyde, the spinal cords of the mice were isolated, dehydrated with alcohol, and embedded in paraffin. The spinal cord sections were stained with primary antibody anti-neurofilament antibody. The secondary antibody was Alexa-488-conjugated (Invitrogen). Nuclei were counterstained with DAPI (1 mg/mL; Sigma). The slides were mounted, visualized, and captured by fluorescence microscopy (Nikon, Tokyo, Japan).
Real-time PCR
Total RNA of tissues and cells was extracted with TRIzol (Thermo Fisher Scientific, Waltham, MA, USA) and reverse-transcribed into cDNA with a reverse transcription kit obtained from TaKaRa (Tokyo, Japan). mRNA levels were measured by real-time PCR with SYBR Green reagent (Roche, Natley, NJ, USA) and normalized to the Actb mRNA level on an ABI Prism 7900HT sequence detection system (Applied Biosystems). For miRNA expression analysis, specific reverse transcription and stem loop real-time PCR were performed with a Bulge-Loop miRNA qPCR Primer Set (RiboBio, Guangzhou, China). To determine the relative expression levels, samples were normalized to U6 microRNA using the 2-ΔΔCT method and ABI 7500 SDS 1.3.1 software. The primer sequences used for PCR analysis are listed in Table S1.
Lentivirus-mediated overexpression of miR-99a
A genomic sequence spanning the mouse miR-99a coding region flanked by approximately 200 base pairs from either the 5′ or 3′ end was cloned into a lentiviral vector pSilencer. The control sequence encoding nontargeting miRNA was cloned into the same vector. The virus was produced, and target cells were infected according to the user’s manual. For in vivo manipulation of miR-99a, 4 × 10⁷ pfu of lentivirus was delivered to naive mice intravenously, and 7 days later, the in vivo efficacy of the lentivirus infection was assessed, and lentivirus-infected naive mice were used for EAE induction.
Flow cytometry
For surface marker detection, cells were stained with anti-CD45, anti-CD4, anti-CD8, anti-B220, anti-CD11b, anti-F4/80, anti-Ly-6C, and anti-Ly-6G antibodies. For Th1 and Th17 cell analysis, cells were stimulated with phorbol-12-myristate-13-acetate (50 ng/mL) and ionomycin (500 ng/mL; Sigma) in the presence of brefeldin A (BD Bioscience, San Diego, CA, USA) for 5 h. Then, the cells were incubated with an anti-CD4 antibody, permeabilized with permeabilization buffer (Thermo Fisher Scientific), and incubated with anti-IFN-γ and anti-IL-17A antibodies. Treg cells were detected using a mouse Treg cell staining kit (Thermo Fisher Scientific) according to the manufacturer’s instructions. For determining intracellular levels of mTOR, CD4+ T cells were permeabilized with permeabilization buffer and stained with anti-mTOR antibody (Cell Signaling Technology, Danvers, MA, USA) for 60 min, followed by the secondary antibody, a Alexa-Fluor 647-conjugated antibody (Thermo Fisher Scientific) for 30 min in the dark at 4°C. For the glucose uptake assay, prestained cells were incubated with 10 μM 2-NBDG (Thermo Fisher Scientific) for 30 min, followed by flow cytometric detection of fluorescence produced by the cells. All stained cells were analyzed by flow cytometry on a BD FACSCalibur (BD Bioscience).
Ex vivo cell proliferation and measurement of cytokines
The reactive response of mononuclear cells (MNCs) to MOG35–55 stimulation was measured as previously described.42 Briefly, MNCs were derived from the DLNs of EAE mice 14 days after immunization and stimulated with MOG35–55 (5 μg/mL) for 48 h. One microliter of [3H]-thymidine (PerkinElmer, Waltham, MA, USA) was added into each well 16 h before the coculture was terminated. [3H]-thymidine incorporation was measured by a MicroBeta TriLux liquid scintillation counter (PerkinElmer). For cytokine measurements, supernatants were collected from cell cultures and diluted for the measurements of IFN-γ, IL-17A, and TGF-β by ELISA (R&D Systems, Minneapolis, MN, USA) according to the manufacturer’s instructions.
CD4+ T cell isolation and in vitro differentiation
Naive CD4+ T cells from the spleen of naive C57BL/6 mice were purified by positive selection and magnetic separation (Miltenyi Biotec, Auburn, CA, USA). The cells were treated with anti-CD3 (2 μg/mL; Thermo Fisher Scientific) and anti-CD28 (2 μg/mL; Thermo Fisher Scientific) antibodies in the presence of IL-12 (40 ng/mL; PeproTech, Rocky Hill, NJ, USA) and anti-IL-4 (5 μg/mL; Thermo Fisher Scientific) to induce Th1 cell differentiation and TGF-β (10 ng/mL; PeproTech) to induce Treg cell differentiation. Th1 and Treg cell differentiation were assessed 4 days after induction.
Oligonucleotide and plasmid transfection
Mimic-NC, mimic-miR-99a (mimic-99a), miR-NC, miR-99a-inhibitor (99a-inhibitor; Robbio), or mTOR overexpression plasmids were transfected into naive CD4+ T cells by nucleofection (program X-01; Amaxa) with a mouse T cell Nucleofector kit (Amaxa). The transfected cells were activated or cultured in the indicated medium 3 h after nucleofection.
Analysis of ECAR and OCR
OCR and ECAR were measured at 37°C using an XF96 extracellular analyzer (Seahorse Bioscience). Briefly, after different treatments, CD4+ T cells were plated in unbuffered DMEM (DMEM with 25 mM glucose as indicated, 1 mM sodium pyruvate, 32 mM NaCl, and 2 mM GlutaMAX, pH 7.4), and incubated in a non-CO2 incubator for 30 min at 37°C. The ECARs and OCRs were calculated using Seahorse XF-96 software.
Luciferase reporter assay
A firefly luciferase reporter gene construct (200 ng per well) and psiCheck-2 luciferase construct (1 ng per well) were cotransfected into 293T cells maintained in DMEM with Lipofectamine 2000 (Thermo Fisher Scientific). Cell extracts were prepared 24 h after transfection and the luciferase activity was measured with a dual-luciferase reporter assay system (Promega). Wild-type 3′ UTR sequences of Mtor were previously cloned into the psiCheck-2 vector (Promega).
Western blot analysis
Cells were lysed in RIPA buffer (Beyotime, Haimen, China) containing protease and phosphatase inhibitors (Roche). Equal amounts of the released protein were separated by SDS-polyacrylamide gel after denaturation, electroblotted onto a polyvinylidene difluoride membrane, and incubated for 1 h in 5% bovine serum albumin at room temperature. The blotted membranes were then exposed to primary antibodies overnight at 4°C and visualized with HRP-conjugated secondary antibody for 1 h at room temperature. The blotted membranes were developed with chemiluminescent reagents (Millipore, Billerica, MA, USA) according to the instructions provided by the manufacturer. Primary antibodies against β-actin, mTOR, phospho-Akt473, Akt, phospho-S6, S6, Myc, and Hif-1α were obtained from Cell Signaling Technology. The blots were quantitatively analyzed using ImageJ software (X64, v. 2.1.4), and Akt, S6, or β-actin was used a control.
Statistical analyses
Statistical analyses were performed with SPSS version 18.0 software and GraphPad Prism software (version 5). All measurement data are presented as the means ± SEM. Statistical significance was evaluated with a Mann-Whitney U test, one-way ANOVA, or two-way ANOVA. Correlations between transcripts of miR-99a and various cytokines in CD4+ T cells were analyzed by Spearman R analysis. Significance was expressed as follows: ∗p < 0.05, ∗∗p < 0.01, ∗∗∗p < 0.001.
Acknowledgment
This study was supported by the National Natural Science Foundation of China (81900565, 81570948, 81800518, 82000567, 82071727, 82070191, 82000553, and 82001739), the Program of Science and Technology Commission of Shanghai Municipality (19ZR1430900 and 201409006300), the Research Fund of Key Laboratory of Tissue Microenvironment and Tumor of Shanghai Institute of Nutrition and Health of Chinese Academy of Sciences (202007).
Author contributions
Y.G. and H.Z. performed most of the experiments, interpreted the results, and wrote the manuscript. H.Y., W.Y., and B.W. performed the animal model experiments and helped to interpret the results. F.Q., Y.C., S.H., X.Z., and L.Z. helped to write and revise the manuscript. M.J. performed the acquisition, analysis, and interpretation of experiment data and helped to write and revise the manuscript. Y.Z. and E.L. designed the research, helped to write and revise the manuscript, and supervised and approved the study. All authors were involved in drafting or revising the manuscript. All authors read and approved the final manuscript.
Declaration of interests
The authors declare no competing interests.
Footnotes
Supplemental information can be found online at https://doi.org/10.1016/j.omtn.2021.07.010.
Contributor Information
Yanyun Zhang, Email: yyzhang@sibs.ac.cn.
Min Jin, Email: mjin@sibs.ac.cn.
Eryi Lu, Email: lueryi222@outlook.com.
Supplemental information
References
- 1.Frohman E.M., Racke M.K., Raine C.S. Multiple sclerosis—the plaque and its pathogenesis. N. Engl. J. Med. 2006;354:942–955. doi: 10.1056/NEJMra052130. [DOI] [PubMed] [Google Scholar]
- 2.Constantinescu C.S., Farooqi N., O’Brien K., Gran B. Experimental autoimmune encephalomyelitis (EAE) as a model for multiple sclerosis (MS) Br. J. Pharmacol. 2011;164:1079–1106. doi: 10.1111/j.1476-5381.2011.01302.x. [DOI] [PMC free article] [PubMed] [Google Scholar]
- 3.Sospedra M., Martin R. Immunology of multiple sclerosis. Semin. Neurol. 2016;36:115–127. doi: 10.1055/s-0036-1579739. [DOI] [PubMed] [Google Scholar]
- 4.Steinman L. Immunology of relapse and remission in multiple sclerosis. Annu. Rev. Immunol. 2014;32:257–281. doi: 10.1146/annurev-immunol-032713-120227. [DOI] [PubMed] [Google Scholar]
- 5.Sospedra M., Martin R. Immunology of multiple sclerosis. Annu. Rev. Immunol. 2005;23:683–747. doi: 10.1146/annurev.immunol.23.021704.115707. [DOI] [PubMed] [Google Scholar]
- 6.Bartel D.P. MicroRNAs: target recognition and regulatory functions. Cell. 2009;136:215–233. doi: 10.1016/j.cell.2009.01.002. [DOI] [PMC free article] [PubMed] [Google Scholar]
- 7.Fabian M.R., Sonenberg N., Filipowicz W. Regulation of mRNA translation and stability by microRNAs. Annu. Rev. Biochem. 2010;79:351–379. doi: 10.1146/annurev-biochem-060308-103103. [DOI] [PubMed] [Google Scholar]
- 8.O’Connell R.M., Rao D.S., Baltimore D. microRNA regulation of inflammatory responses. Annu. Rev. Immunol. 2012;30:295–312. doi: 10.1146/annurev-immunol-020711-075013. [DOI] [PubMed] [Google Scholar]
- 9.O’Neill L.A., Sheedy F.J., McCoy C.E. MicroRNAs: the fine-tuners of Toll-like receptor signalling. Nat. Rev. Immunol. 2011;11:163–175. doi: 10.1038/nri2957. [DOI] [PubMed] [Google Scholar]
- 10.Dooley J., Linterman M.A., Liston A. MicroRNA regulation of T-cell development. Immunol. Rev. 2013;253:53–64. doi: 10.1111/imr.12049. [DOI] [PubMed] [Google Scholar]
- 11.Zhou X., Jeker L.T., Fife B.T., Zhu S., Anderson M.S., McManus M.T., Bluestone J.A. Selective miRNA disruption in T reg cells leads to uncontrolled autoimmunity. J. Exp. Med. 2008;205:1983–1991. doi: 10.1084/jem.20080707. [DOI] [PMC free article] [PubMed] [Google Scholar]
- 12.Liston A., Lu L.F., O’Carroll D., Tarakhovsky A., Rudensky A.Y. Dicer-dependent microRNA pathway safeguards regulatory T cell function. J. Exp. Med. 2008;205:1993–2004. doi: 10.1084/jem.20081062. [DOI] [PMC free article] [PubMed] [Google Scholar]
- 13.Xiao C., Srinivasan L., Calado D.P., Patterson H.C., Zhang B., Wang J., Henderson J.M., Kutok J.L., Rajewsky K. Lymphoproliferative disease and autoimmunity in mice with increased miR-17-92 expression in lymphocytes. Nat. Immunol. 2008;9:405–414. doi: 10.1038/ni1575. [DOI] [PMC free article] [PubMed] [Google Scholar]
- 14.O’Connell R.M., Kahn D., Gibson W.S., Round J.L., Scholz R.L., Chaudhuri A.A., Kahn M.E., Rao D.S., Baltimore D. MicroRNA-155 promotes autoimmune inflammation by enhancing inflammatory T cell development. Immunity. 2010;33:607–619. doi: 10.1016/j.immuni.2010.09.009. [DOI] [PMC free article] [PubMed] [Google Scholar]
- 15.Torres A., Torres K., Pesci A., Ceccaroni M., Paszkowski T., Cassandrini P., Zamboni G., Maciejewski R. Deregulation of miR-100, miR-99a and miR-199b in tissues and plasma coexists with increased expression of mTOR kinase in endometrioid endometrial carcinoma. BMC Cancer. 2012;12:369. doi: 10.1186/1471-2407-12-369. [DOI] [PMC free article] [PubMed] [Google Scholar]
- 16.Turcatel G., Rubin N., El-Hashash A., Warburton D. MIR-99a and MIR-99b modulate TGF-β induced epithelial to mesenchymal plasticity in normal murine mammary gland cells. PLoS ONE. 2012;7:e31032. doi: 10.1371/journal.pone.0031032. [DOI] [PMC free article] [PubMed] [Google Scholar]
- 17.Jaiswal A., Reddy S.S., Maurya M., Maurya P., Barthwal M.K. MicroRNA-99a mimics inhibit M1 macrophage phenotype and adipose tissue inflammation by targeting TNFα. Cell. Mol. Immunol. 2019;16:495–507. doi: 10.1038/s41423-018-0038-7. [DOI] [PMC free article] [PubMed] [Google Scholar]
- 18.Zhu S., Pan W., Song X., Liu Y., Shao X., Tang Y., Liang D., He D., Wang H., Liu W., et al. The microRNA miR-23b suppresses IL-17-associated autoimmune inflammation by targeting TAB2, TAB3 and IKK-α. Nat. Med. 2012;18:1077–1086. doi: 10.1038/nm.2815. [DOI] [PubMed] [Google Scholar]
- 19.Warth S.C., Hoefig K.P., Hiekel A., Schallenberg S., Jovanovic K., Klein L., Kretschmer K., Ansel K.M., Heissmeyer V. Induced miR-99a expression represses Mtor cooperatively with miR-150 to promote regulatory T-cell differentiation. EMBO J. 2015;34:1195–1213. doi: 10.15252/embj.201489589. [DOI] [PMC free article] [PubMed] [Google Scholar]
- 20.Melero-Jerez C., Alonso-Gómez A., Moñivas E., Lebrón-Galán R., Machín-Díaz I., de Castro F., Clemente D. The proportion of myeloid-derived suppressor cells in the spleen is related to the severity of the clinical course and tissue damage extent in a murine model of multiple sclerosis. Neurobiol. Dis. 2020;140:104869. doi: 10.1016/j.nbd.2020.104869. [DOI] [PubMed] [Google Scholar]
- 21.Du C., Liu C., Kang J., Zhao G., Ye Z., Huang S., Li Z., Wu Z., Pei G. MicroRNA miR-326 regulates TH-17 differentiation and is associated with the pathogenesis of multiple sclerosis. Nat. Immunol. 2009;10:1252–1259. doi: 10.1038/ni.1798. [DOI] [PubMed] [Google Scholar]
- 22.Pan D., Gunther R., Duan W., Wendell S., Kaemmerer W., Kafri T., Verma I.M., Whitley C.B. Biodistribution and toxicity studies of VSVG-pseudotyped lentiviral vector after intravenous administration in mice with the observation of in vivo transduction of bone marrow. Mol. Ther. 2002;6:19–29. doi: 10.1006/mthe.2002.0630. [DOI] [PubMed] [Google Scholar]
- 23.Peng M., Yin N., Chhangawala S., Xu K., Leslie C.S., Li M.O. Aerobic glycolysis promotes T helper 1 cell differentiation through an epigenetic mechanism. Science. 2016;354:481–484. doi: 10.1126/science.aaf6284. [DOI] [PMC free article] [PubMed] [Google Scholar]
- 24.Almeida L., Lochner M., Berod L., Sparwasser T. Metabolic pathways in T cell activation and lineage differentiation. Semin. Immunol. 2016;28:514–524. doi: 10.1016/j.smim.2016.10.009. [DOI] [PubMed] [Google Scholar]
- 25.Yang X., Xia R., Yue C., Zhai W., Du W., Yang Q., Cao H., Chen X., Obando D., Zhu Y., et al. ATF4 regulates CD4+ T cell immune responses through metabolic reprogramming. Cell Rep. 2018;23:1754–1766. doi: 10.1016/j.celrep.2018.04.032. [DOI] [PMC free article] [PubMed] [Google Scholar]
- 26.Zhu S., Zhang X., Guan H., Huang F., Wu L., Hou D., Zheng Z., Yu M., Huang L., Ge L. miR-140-5p regulates T cell differentiation and attenuates experimental autoimmune encephalomyelitis by affecting CD4+T cell metabolism and DNA methylation. Int. Immunopharmacol. 2019;75:105778. doi: 10.1016/j.intimp.2019.105778. [DOI] [PubMed] [Google Scholar]
- 27.Lee E.B., Sung P.S., Kim J.H., Park D.J., Hur W., Yoon S.K. microRNA-99a Restricts Replication of hepatitis C virus by Targeting mTOR and de novo lipogenesis. Viruses. 2020;12:696. doi: 10.3390/v12070696. [DOI] [PMC free article] [PubMed] [Google Scholar]
- 28.Salmond R.J. mTOR regulation of glycolytic metabolism in T Cells. Front. Cell Dev. Biol. 2018;6:122. doi: 10.3389/fcell.2018.00122. [DOI] [PMC free article] [PubMed] [Google Scholar]
- 29.Das J., Ren G., Zhang L., Roberts A.I., Zhao X., Bothwell A.L., Van Kaer L., Shi Y., Das G. Transforming growth factor beta is dispensable for the molecular orchestration of Th17 cell differentiation. J. Exp. Med. 2009;206:2407–2416. doi: 10.1084/jem.20082286. [DOI] [PMC free article] [PubMed] [Google Scholar]
- 30.Rezaei N., Talebi F., Ghorbani S., Rezaei A., Esmaeili A., Noorbakhsh F., Hakemi M.G. MicroRNA-92a drives Th1 responses in the experimental autoimmune encephalomyelitis. Inflammation. 2019;42:235–245. doi: 10.1007/s10753-018-0887-3. [DOI] [PubMed] [Google Scholar]
- 31.Li Q., Xie J., Li R., Shi J., Sun J., Gu R., Ding L., Wang L., Xu B. Overexpression of microRNA-99a attenuates heart remodelling and improves cardiac performance after myocardial infarction. J. Cell. Mol. Med. 2014;18:919–928. doi: 10.1111/jcmm.12242. [DOI] [PMC free article] [PubMed] [Google Scholar]
- 32.Zhang Y., Han J.J., Liang X.Y., Zhao L., Zhang F., Rasouli J., Wang Z.Z., Zhang G.X., Li X. miR-23b suppresses leukocyte migration and pathogenesis of experimental autoimmune encephalomyelitis by targeting CCL7. Mol. Ther. 2018;26:582–592. doi: 10.1016/j.ymthe.2017.11.013. [DOI] [PMC free article] [PubMed] [Google Scholar]
- 33.Bao M.H., Li J.M., Luo H.Q., Tang L., Lv Q.L., Li G.Y., Zhou H.H. NF-κB-Regulated miR-99a modulates endothelial cell inflammation. Mediators Inflamm. 2016;2016:5308170. doi: 10.1155/2016/5308170. [DOI] [PMC free article] [PubMed] [Google Scholar]
- 34.Jaiswal A., Maurya M., Maurya P., Barthwal M.K. Lin28B regulates angiotensin II-mediated Let-7c/miR-99a MicroRNA formation consequently affecting macrophage polarization and allergic inflammation. Inflammation. 2020;43:1846–1861. doi: 10.1007/s10753-020-01258-1. [DOI] [PubMed] [Google Scholar]
- 35.Cantoni C., Cignarella F., Ghezzi L., Mikesell B., Bollman B., Berrien-Elliott M.M., Ireland A.R., Fehniger T.A., Wu G.F., Piccio L. Mir-223 regulates the number and function of myeloid-derived suppressor cells in multiple sclerosis and experimental autoimmune encephalomyelitis. Acta Neuropathol. 2017;133:61–77. doi: 10.1007/s00401-016-1621-6. [DOI] [PMC free article] [PubMed] [Google Scholar]
- 36.Tao Z., Zhao H., Wang R., Liu P., Yan F., Zhang C., Ji X., Luo Y. Neuroprotective effect of microRNA-99a against focal cerebral ischemia-reperfusion injury in mice. J. Neurol. Sci. 2015;355:113–119. doi: 10.1016/j.jns.2015.05.036. [DOI] [PubMed] [Google Scholar]
- 37.Franklin R.J., Ffrench-Constant C. Remyelination in the CNS: from biology to therapy. Nat. Rev. Neurosci. 2008;9:839–855. doi: 10.1038/nrn2480. [DOI] [PubMed] [Google Scholar]
- 38.Han Z., Guan Y., Liu B., Lin Y., Yan Y., Wang H., Wang H., Jing B. MicroRNA-99a-5p alleviates atherosclerosis via regulating Homeobox A1. Life Sci. 2019;232:116664. doi: 10.1016/j.lfs.2019.116664. [DOI] [PubMed] [Google Scholar]
- 39.Tang Y., Zhang L., Tu T., Li Y., Murray D., Tu Q., Chen J.J. MicroRNA-99a is a novel regulator of KDM6B-mediated osteogenic differentiation of BMSCs. J. Cell. Mol. Med. 2018;22:2162–2176. doi: 10.1111/jcmm.13490. [DOI] [PMC free article] [PubMed] [Google Scholar]
- 40.Sun M., Hong S., Li W., Wang P., You J., Zhang X., Tang F., Wang P., Zhang C. MiR-99a regulates ROS-mediated invasion and migration of lung adenocarcinoma cells by targeting NOX4. Oncol. Rep. 2016;35:2755–2766. doi: 10.3892/or.2016.4672. [DOI] [PubMed] [Google Scholar]
- 41.Dang S., Xu H., Xu C., Cai W., Li Q., Cheng Y., Jin M., Wang R.X., Peng Y., Zhang Y., et al. Autophagy regulates the therapeutic potential of mesenchymal stem cells in experimental autoimmune encephalomyelitis. Autophagy. 2014;10:1301–1315. doi: 10.4161/auto.28771. [DOI] [PMC free article] [PubMed] [Google Scholar]
- 42.Jin M., Li Q., Gu Y., Wan B., Huang J., Xu X., Huang R., Zhang Y. Leonurine suppresses neuroinflammation through promoting oligodendrocyte maturation. J. Cell. Mol. Med. 2019;23:1470–1485. doi: 10.1111/jcmm.14053. [DOI] [PMC free article] [PubMed] [Google Scholar]
Associated Data
This section collects any data citations, data availability statements, or supplementary materials included in this article.