Abstract
Nuclear mechanics is emerging as a key component of stem cell function and differentiation. While changes in nuclear structure can be visually imaged with confocal microscopy, mechanical characterization of the nucleus and its sub-cellular components require specialized testing equipment. A computational model permitting cell-specific mechanical information directly from confocal and atomic force microscopy of cell nuclei would be of great value. Here, we developed a computa-tional framework for generating finite element models of isolated cell nuclei from multiple confocal microscopy scans and simple atomic force microscopy (AFM) tests. Confocal imaging stacks of isolated mesenchymal stem cells were converted into finite element models and siRNA-mediated Lamin A/C depletion isolated chromatin and Lamin A/C structures. Using AFM-measured experimental stiffness values, a set of conversion factors were determined for both chromatin and Lamin A/C to map the voxel intensity of the original images to the element stiffness, allowing the prediction of nuclear stiffness in an additional set of other nuclei. The developed computational framework will identify the contribution of a multitude of sub-nuclear structures and predict global nuclear stiffness of multiple nuclei based on simple nuclear isolation protocols, confocal images and AFM tests.
Keywords: Finite element analysis, Mesenchymal stem cells, Nucleus, Mechanobiology, Lamin A/C, Chromatin, Confocal microscopy
1. Introduction
All living organisms function in and adapt to mechanically active environments at the levels of the organ, tissue and cell. Mesenchymal stem cells (MSCs) are the tissue resident stem cells of musculoskeletal tissues that, at least in part, regulate the adaptive response to mechanical challenge by proliferating and differentiating into distinct cell types (Pagnotti et al. 2019). MSC stem cell differentiation is heavily influenced by the stiffness of the extracellular matrix (Engler et al. 2006). For instance, plating MSCs onto soft or stiff substrates can drive MSC differentiation toward adipogenesis or osteogenesis, respectively (Hanna et al. 2018). The means by which MSC can sense the stiffness of its extracellular matrix comprise an interplay of focal adhesions, the cytoskeleton and the nucleus (Humphrey et al. 2014). When a MSC is placed onto a stiffer extracellular matrix, the cell will increase its size and the number of focal adhesions to its extracellular matrix (Andalib et al. 2016), promoting cell traction within the extracellular matrix (Humphrey et al. 2014). As the cell spreads on the extracellular matrix, actin microfilaments tug on the nucleus causing it to stretch and deform (Harris et al. 2016). These changes in the nuclear structure are critical for cell function. For example, the nuclear membrane is covered with nuclear pore complexes that are sensitive to cytoskeletal deformations of the nucleus (Hoffman et al. 2020). When these pores are opened, the transcriptional factors such as YAP/TAZ are allowed into the nucleus to regulate gene expression (Shiu et al. 2018). Further, chromatin itself is responsive to mechanical challenge, as the application of mechanical forces can alter heterochromatin dynamics and organization (Le et al. 2016; Makhija et al. 2016). While signaling events such as YAP/TAZ and DNA changes are areas of active research, probing nuclear mechanical properties in living cells remain challenging.
Quantifying the bulk mechanical properties of the nucleus can be performed via atomic force microscopes, micropipette setups, optical tweezers or microfluidics (Darling and Carlo 2015). While single-cell level optical methods to measure intra-nuclear deformations are emerging (Ghosh et al. 2019), cellular FE models that can capture nuclear structure and predict nuclear mechanics of many nuclei could provide mechanistic information on cell’s mechanical properties and at the same time, present a time-saving and cost-effective alternative. The stiffness of the nucleus is primarily affected by two nuclear components, Lamin A/C and chromatin (Martins et al. 2012). Lamin A/C is a protein that scaffolds the inner nuclear membrane, adding mechanical stiffness to the nucleus, while Lamin B does not contribute to nuclear mechanics (Lammerding et al. 2006) Chromatin is made of compact DNA and histones that occupies the interior of the nucleus and also provides mechanical competence (Stephens et al. 2018a; Stephens et al. 2018b). Thus, inclusion of these two components is essential for modeling nuclear mechanics.
Here, we propose and validate a method that uses imaging intensity data from confocal images from Lamin A/C and chromatin to determine nuclear mechanical properties. To this end, we developed a computational framework capable of producing confocal-image-based finite element models of an MSC nucleus that replicates the structural configuration of both chromatin and Lamin A/C. Finite element models constructed with image intensity-based elasticity values were calibrated using experimental AFM measurements of cell nuclei with or without Lamin A/C. This model was then tested in its ability to predict the stiffness of two additional test nuclei.
2. Data collection, modeling, simulation setup and methods
2.1. Cell culture
MSCs were harvested from the bone marrow of 8-wk-old male C57BL/6 J mice as previously described (Peister et al. 2004; Bas et al. 2020). Cells used for the experiments were between passage 7 and passage 11. Cells were sub-cultured at a density of 1,800 cells/cm2 and maintained within IMDM (12,440,053, GIBGO) with 10% FCS (S11950H, Atlanta Biologicals) with 1% Pen/strep (GIBCO).
2.2. Nucleus isolation
MSCs were scraped off their plates using 9 mL of 1 × PBS and centrifuged at 1100 RPM at 4 °C with a Beckman Coul-ter Allegra X-30R Centrifuge. MSCs were suspended within 500 μL hypotonic buffer A (0.33 M Sucrose, 10 mM HEPES, pH 7.4, 1 mM MgC12, 0.5% w/v Saponin) and centrifuged twice at 3000 RPM, 4 °C for 10 min using a Beckman Coul-ter Microfuge 20R Centrifuge. Cytoplasmic supernatant was aspirated away, and the remaining nuclei were resuspended using 100 μL of hypotonic buffer A. Cytoplasmic debris was separated from the nuclei by adding 400 μL of Percoll. The resulting mixture was centrifuged at 10,000 RPM at 4 °C for 10 min. Nuclei were then plated in a 0.01 poly-L-lysine-coated 35 mm cell culture dish and incubated for 25 min.
2.3. Measuring nuclear stiffness using AFM
Force–displacement curves of isolated nuclei were acquired using a Bruker Dimension FastScan Bio AFM. Tipless MLCT-D probes (0.03 N/m spring constant) were functionalized with 10-μm-diameter borosilicate glass beads (Thermo Scientific 9010, 10.0 ± 1.0 μm NIST-traceable 9000 Series Glass Particle Standards) prior to AFM experiments using UV-curable Norland Optical Adhesive 61, and a thermal tune was conducted on each probe immediately prior to use to determine its spring constant and deflection sensitivity. Nuclei were located using the AFM’s optical microscope and engaged with a 2-3nN force setpoint to ensure contact prior to testing. After engaging on a selected nucleus, force curve ramping was performed at a rate of 2 μm/sec over 2 μm total travel (1 μm approach, 1 μm retract). Three replicate force–displacement curves were acquired and saved for each nucleus tested, with at least 3 s of rest between conducting each test. Measurements that showed less than 600 nm contact with the nucleus were discarded. Measured force–displacement curves were than exported into Matlab (Mathworks, Natick, MA) to generate a curve of points that reflects the mean of the force to displacement curve as well as the standard deviation of the atomic force microscopy experiments.
2.4. Nucleus imaging
A singe group of MSC was grown within control conditions and isolated using the methods described above. The chromatin of the nuclei was then stained with Hoechst 33,342, while the Lamin A/C was stained with mAB 4777 (Abcam). Five nuclei were then imaged using a Nikon A1 confocal microscope at a rate of 0.2 μm out of plane and 0.05 μm in plane resolution.
2.4.1. Measuring stiffness of intact and Lamin A/C-depleted cell nuclei
As we sought to model nuclear stiffness based on confocal images of Lamin A/C and chromatin, we first obtained mechanical properties of cell nuclei isolated from live MSCs with or without Lamin A/C. Two groups of MSCs were cultured in growth media (IMDM, 10% fetal bovine serum, 1%Pen Strep). One group received a Lamin A/C-specific siRNA treatment (siLamin), ceasing Lamin A/C mRNA expression in MSCs, while the other group was treated with a non-specific control siRNA (siControl). Forty-eight hours after siRNA treatment, cell nuclei were isolated, plated onto 0.1% poly-L-lysine-coated plates for adherence and subjected to AFM testing to obtain force–displacement curves as we reported previously (Fig. 1a) (Sankaran et al. 2020). As shown in immunolabeled nuclei images (Fig. 1b), isolated control nuclei appeared round and maintained intact Lamin A/C (red) and DNA (blue) confirmation. Shown in Fig. 1c, force–displacement curves for siControl (N = 30) and siLamin (N = 73) groups were obtained by showing that the maximum force measured at the AFM tip for the siLamin group was, on average, 59% smaller than the siControl group (p < 0.05, Fig. 1c), confirming that nuclei are softer without Lamin A/C (Lammerding et al. 2006).
Fig. 1.
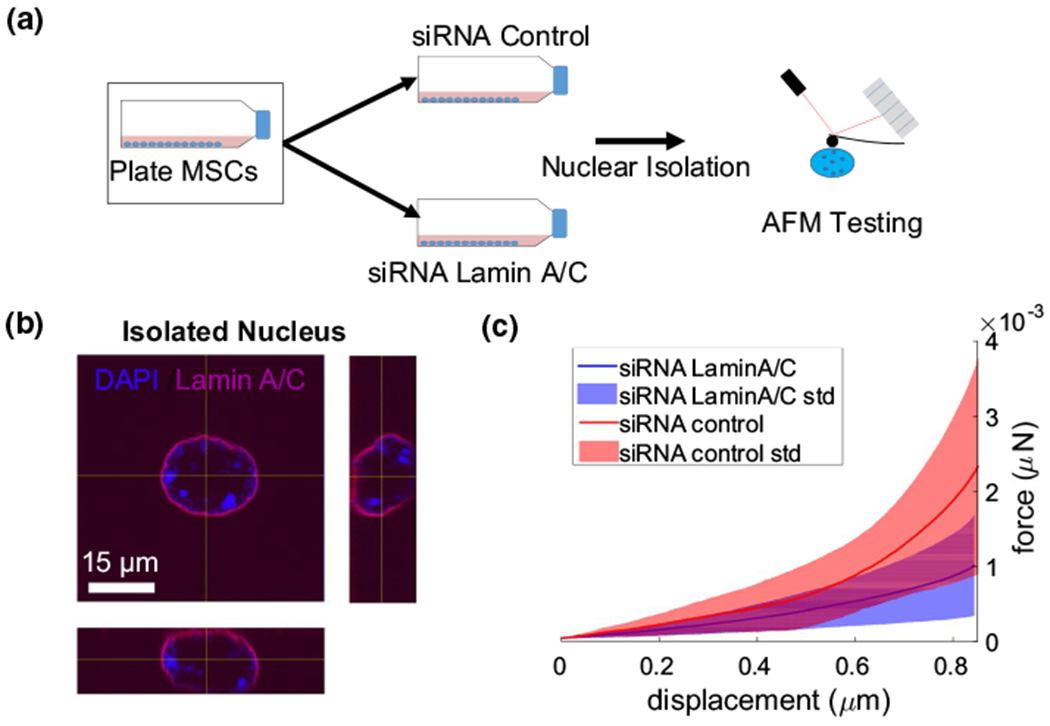
siRNA-mediated depletion of Lamin A/C decreases isolated nuclei stiffness. a Two groups of MSCs were grown in 10% fetal bovine serum. One group received the Lamin A/C-specific siRNA treatment, while the other group was treated with control siRNA. Nuclei were isolated and subsequently subjected to AFM testing. Nuclei of both the control group (n = 30) and the Lamin A/C knockdown group (n = 73) were indented by 1 μm using a spherical tip with a diameter of 6 μm. b Confocal microscopy images of a nucleus stained for chromatin (Hoechst 33,342) and Lamin A/C (cell signaling mAB4777). c Average (± SD) force–displacement curves for control nuclei (red) and Lamin A/C siRNA nuclei (blue). The average force–displacement curve for each group is shown as a solid line; less than one standard deviation is shown as shaded area. The purple area represents the overlap of the red and blue areas
2.5. Mesh generation from confocal scans
To model the contribution of Lamin A/C and chromatin separately, we generated two volumetric meshes from each nucleus image. The first mesh was generated using the chromatin signal of the nucleus image and the second one was generated using the Lamin A/C signal of the nucleus image. For chromatin, the 3D confocal image of the chromatin was imported into Amira software (ThermoFisher, MA) and the nucleus geometry was manually segmented (Fig. 2a). A surface mesh was created that employed triangular S3 elements surrounding the nucleus geometry (Fig. 2b). This surface mesh was then imported into Hypermesh (Altair Engineering, MI) to create a volume mesh with C3D4 tetrahedral elements (Fig. 2c). The resulting volume mesh was imported into Bonemat software (http://www.bonemat.org/) (Fig. 2d) to overlay the volumetric mesh onto the original confocal image and to assign stiffness values to each tetrahedral element using the average voxel intensity (HU) within each element (Eq. 1):
| (1) |
Fig. 2.
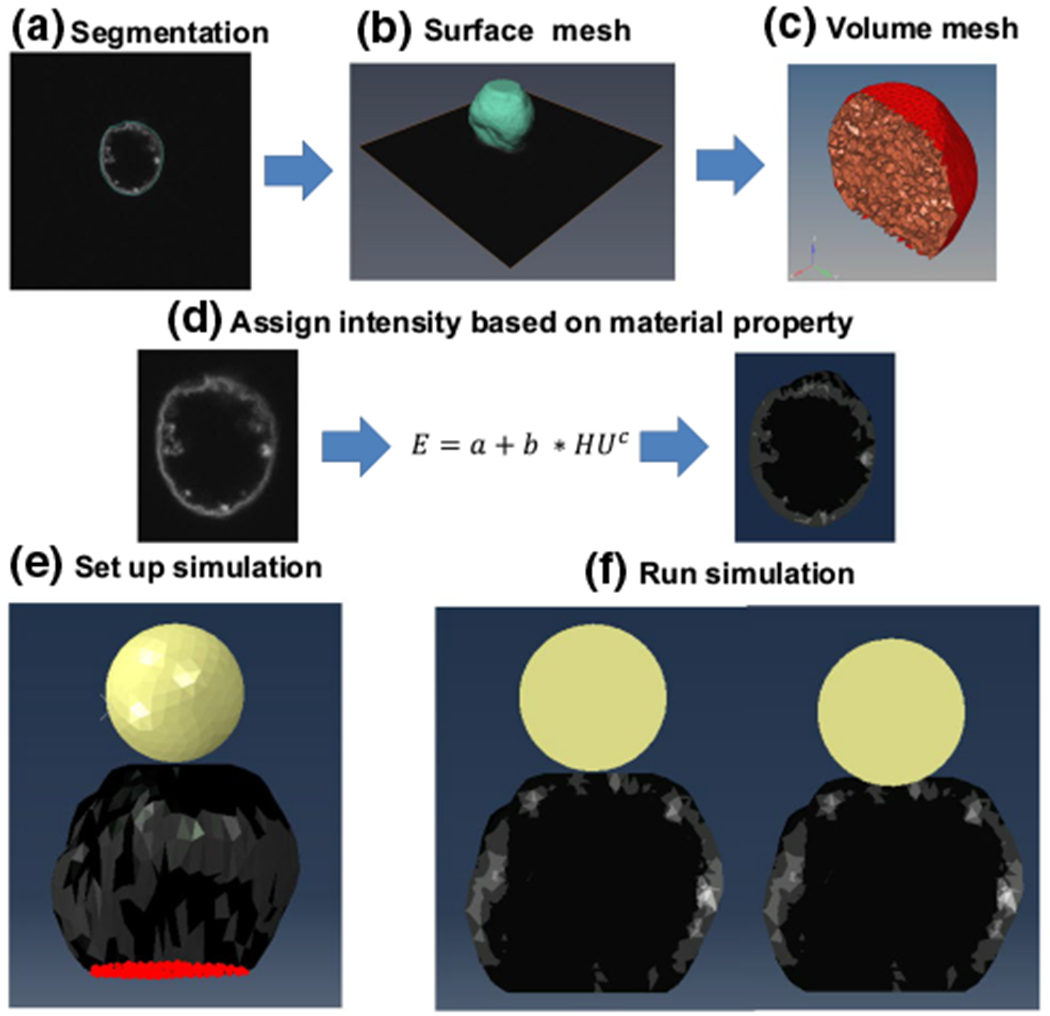
Generation of image-based nucleus model. a Images of MSC nuclei were manually segmented using Amira to isolate the nuclear geometry. b Segmented images were then used to create a surface mesh of the nucleus geometry. c The surface image was converted into a volumetric mesh. d The volumetric mesh was assigned material properties using the voxel intensity of the original image and the shown equation. e Image of simulated atomic force microscopy (AFM) experiment with the AFM tip shown in yellow, the heterogeneous nucleus in blue and the encastered base nodes in red. f Cross-sectional images of the nucleus model before compression (left) and after compression (right)
The term a, representing the intensity-independent elastic modulus, was set to “0” to eliminate any contribution to elasticity outside the image intensity. Terms b and c are a set of conversion factors defined during each experiment. Here, we used a linear isotropic elastic material definition with a Poisson’s ratio of 0.5 for each model (Tang et al. 2019). For this study, FE meshes were generated for five isolated nuclei. Two representations of each nucleus were generated: one that included both Lamin A/C and chromatin and one which included only chromatin. All the nuclei were imaged via a Nikon A1 confocal microscope with an image depth of 0.2 μm and a voxel width of 0.05 μm.
To generate a model that contains both Lamin A/C and chromatin (i.e., Lamin A/C + chromatin mesh), two identical nucleus geometries were produced. Chromatin meshes were assigned elasticity values using the siLamin nuclei force–displacement curves (i.e., no Lamin A/C present). While siRNA procedure does not deplete the entire Lamin A/C protein levels, a large decrease in measured force value (Fig. 1c) shows a substantial decline. The effectiveness of this siRNA procedure was confirmed in a recent publication (Newberg et al. 2020). Conversion factors for the Lamin A/C meshes were derived via utilizing the chromatin mesh elasticity values and the AFM data for intact nuclei (i.e., siControl nuclei with both Lamin A/C and chromatin present). The chromatin and Lamin A/C elasticities in each element were then linearly added to produce the siControl model containing the elasticity of both structures.
2.6. Replicating AFM experiments in silico
Atomic force microscopy simulations were performed in ABAQUS software (2019, Dassault Systemes, France). A replica of the AFM test setup was modeled in silico (Fig. 2e). The bottom node layer of the nucleus model (red) was fixed to a rigid plane in all orthogonal directions to simulate the nucleus being attached to the poly-L-lysine-coated plate surface. A simulated AFM tip (yellow) was created by positioning a sphere (r = 5 μm) made of C3D4 elements with a rigid body material definition above the nucleus model. Contact between the nucleus and the AFM tip was defined as a no-friction contact pair. During simulation, the AFM tip was lowered onto the nucleus until 1 μm indentation was reached (Fig. 2f). The required force to indent the nucleus was recorded. The recorded force–displacement curves were used to quantify the root mean squared error (RMSE) between experimental and in silico conditions.
2.7. Determination of the element volume for nucleus models
To determine the dependence of the AFM indentation force on the volume of the mesh elements, nucleus models were constructed from 5 chromatin nuclei images with element volumes of 5, 4, 3, 2, 1, 0.8 and 0.6 μm3. The models were assigned temporary elasticity values using the original chromatin images with conversion factors of a = 0, b = 20 and c = 1. The term a was set to 0 because of the assumption that there is no base elasticity independent of image intensity, b was set to 20, and c was set to 1 to scale elasticity linearly to image voxel intensity. A representative image for the meshes of nucleus #1, with varying element volumes and with the original images at each mid-orthogonal plane, is depicted in Fig. 3a. Each nucleus model was subjected to in silico AFM experiments. For each nucleus model, the force generated at 1 μm of indentation was recorded and plotted against element volume for each nucleus (Fig. 3b). The mean maximum force value and standard deviation started to plateau for element volumes of 1 μm3 or smaller, indicating this volume that can be used without affecting the maximum force output (green line).
Fig. 3.
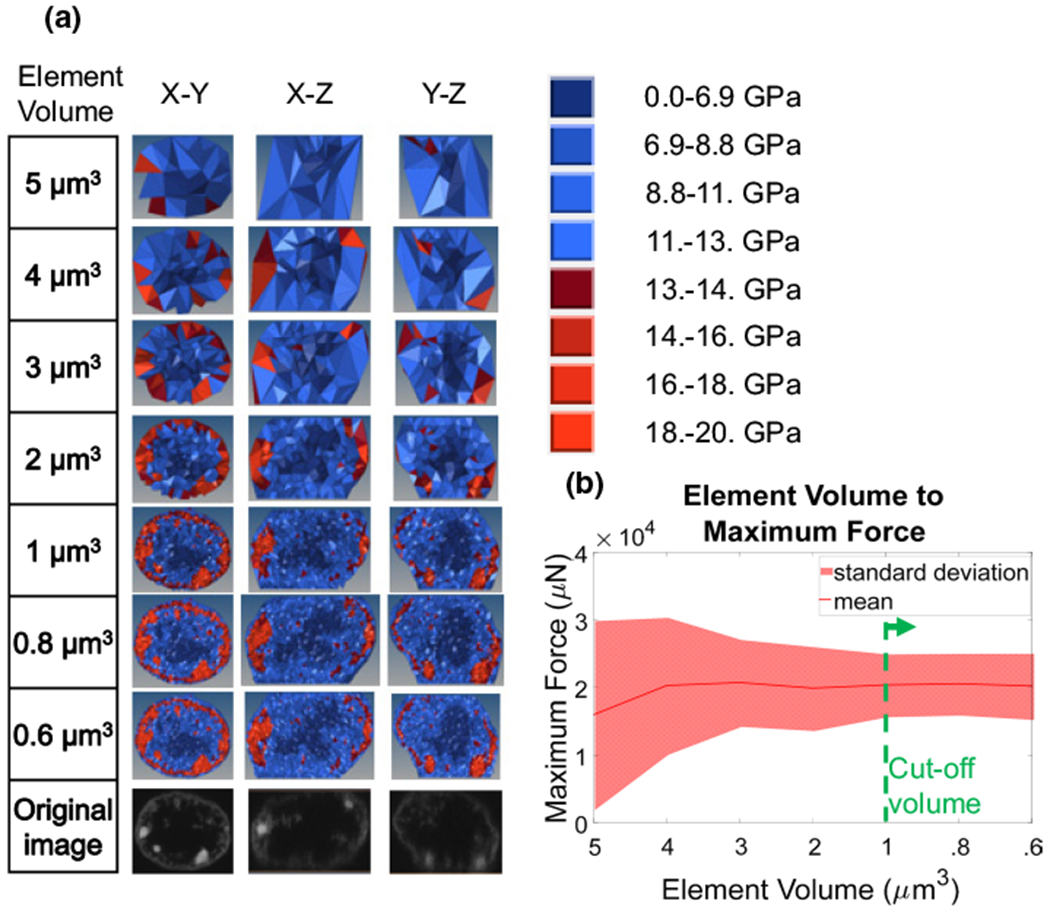
Element size sensitivity analysis. a Cross-sectional images of nuclei models created with elements that have an average element size of 5, 4, 3, 2, 1, .8 and .6 μ m3. Material parameters were set to b = 20 kPa and c = 1. Color maps indicate the corresponding stiffness values. b Graph of how maximum force, measured at the AFM tip pressing onto the nucleus, versus the element size averaged for three nuclei. The solid line represents the mean, and the shaded area indicates the area within one standard deviation. Element sizes smaller than 1 μ m3 did not affect maximum force and standard deviation (green dashed line)
2.8. Sensitivity of image noise to element volume
While force sensitivity analysis revealed a cut-off at 1 μm3, we also sought to quantify how well element volumes represented the spatial information from confocal images, as this may be important for discerning nuclear deformation patterns. To accomplish this, we only used a chromatin mesh without Lamin A/C. Chromatin images for a single nucleus image (nucleus #1) were converted into six finite element models meshed with average element sizes of 3, 2, 1.5, 1, 0.8, 0.6, and 0.3 μm3 and assigned elasticity values using the temporary conversion factors a = 0, b = 20 and c = 1. A Matlab script extracted a 3D image from each mesh with the 2D image from a transverse plane (Z = 7 μm) (Fig. 4, top row).
Fig. 4.
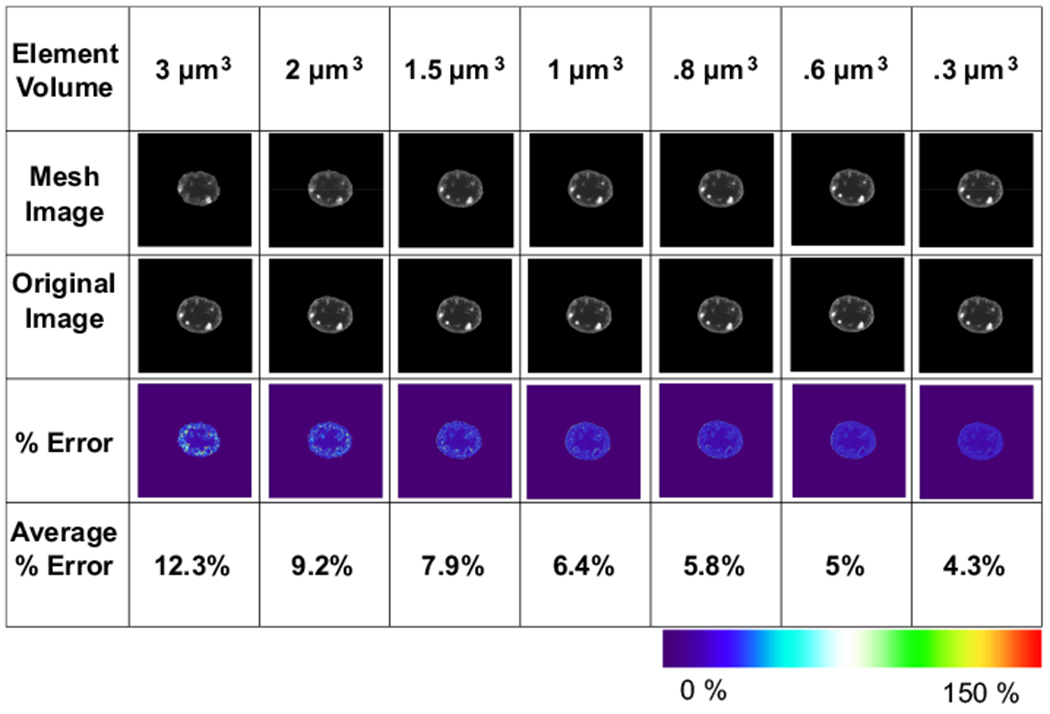
Element size error analysis. Representative sagittal plane images with element volumes of 3, 2, 1.5, 0.8, 0.6 and 0.3 μm3 (2nd row) were compared against the matching location in the original confocal image (3rd row). Quantification of the pixel-by-pixel intensity values were represented by a % change heat map (4th row). Average % error in 3 and 0.3 μm3 element volumes was 12.3% and 4.3%, respectively
These images were then superimposed onto the original image (Fig. 4, second row) and the intensity of each voxel was compared to each voxel in the original image, producing a color map indicating the percent difference (Fig. 4, third row). Microscopy noise in the confocal images was accounted for by comparing the average intensity of the DNA free region of interest to each voxel within that region (Fig. S1). This analysis produced an average error value of 13%, indicating the amount of inherent noise in the confocal images. This value was subtracted from each voxel to quantify the non-noise related error. These corrected voxel errors were then averaged to generate a final error value (Fig. 4, bottom row). At 3 μm3 element volume, the average error was 12.3%. As element size decreased, the % error also decreased. At 1 μm3, the average error was 6.4%. For 1 μm3 down to 0.3 μm3, the average error only changed by 1.9% indicating a similar cut-off range where 1 μm3 voxel volumes can represent 93.6% of the chromatin configuration. Please refer Fig. S1 for
2.9. Response surface generation
To identify the sensitivity of the RMSE between experimental and in silico force–displacement curves to different combinations of the b and c terms, two response surfaces were generated; first, a coarse 8 × 8 matrix that was followed up by a finer 10 × 10 matrix. The c values were spaced linearly while the b values were spaced logarithmically because of the much greater change of b value, that minimized error, compared to the c value. To generate the RMSE between experimental and in silico force–displacement curves, all five nuclei confocal microscopy scans were converted to finite element models with an average element size of 1 μm3. Each model was assigned elasticity values using the original image and the conversion factors for the given datapoint. All five nucleus models then underwent a simulated atomic force microscopy experiment where force–displacement data from the first 1 μm of nucleus indentation was collected. The resulting force displacement curves were compared to the mean atomic force microscopy curve taken from the experimental AFM indentations, calculating the RMSE. The RMSE of all 5 models was averaged to create each point of the response surface.
2.10. Conversion factor optimization
Nucleus models #1, #2 and #3 were selected and converted to finite element models with an element volume of 1 μm3. The matlab algorithm “fmincon” was set to use an “SQP” optimization algorithm with constraint/step tolerance set to 1 × 10⁻⁹ μN/μm2. The c term was then constrained to either c = 1 for linear material conversion or c = 0 for homogeneous material value. A value of b = 1E-10 μN/μm2 was used as a starting point. This algorithm optimized the b value until the optimization constraint/step tolerance was met.
2.11. Statistical analysis
Results were presented as mean ± one standard deviation (SD) unless indicated in figure legends. For comparisons between groups, a nonparametric two-tailed Mann–Whitney U test was used. P-values of less than 0.05 were considered significant.
3. Results
3.1. Linear relationship between voxel intensity and material property is sufficient for assigning material properties for both SiLamin and SiControl models
To determine the best set of conversion factors for creating nuclei models containing a chromatin mesh only, an 8 × 8 response surface was generated to compare the simulated AFM results to experimental AFM data for the Lamin A/C-depleted nuclei (Fig. 5a). The b values were logarithmically spaced between 1 × 10⁻⁹ μN/μm2 and 1 × 10⁻³ μN/μm2, and c values were linearly spaced between 0.5 and 5. The error associated with each b–c combination was found by generating the root mean squared error between the simulated and experimental AFM data. Results showed that for every c value, there was a b value that minimized the error. To expand on this finding, we selected the two c values of 0.5 and 1.1 that produced a minimum value within our original 8 × 8 grid (green dotted boxes). Shown in Fig. 5b, plotting a refined 10 × 10 response surface around these two b-c values, a minimum error along a straight line for different b values was visible (dotted red lines) (Fig. 6), suggesting that minimizing the error was independent of the initial c value. Shown in bottom right, setting c = 1 produced a similar set of b values that minimized the error between the simulated and the real AFM experiments, indicating that a linear conversion between pixel intensity and modulus of elasticity could be used.
Fig. 5.
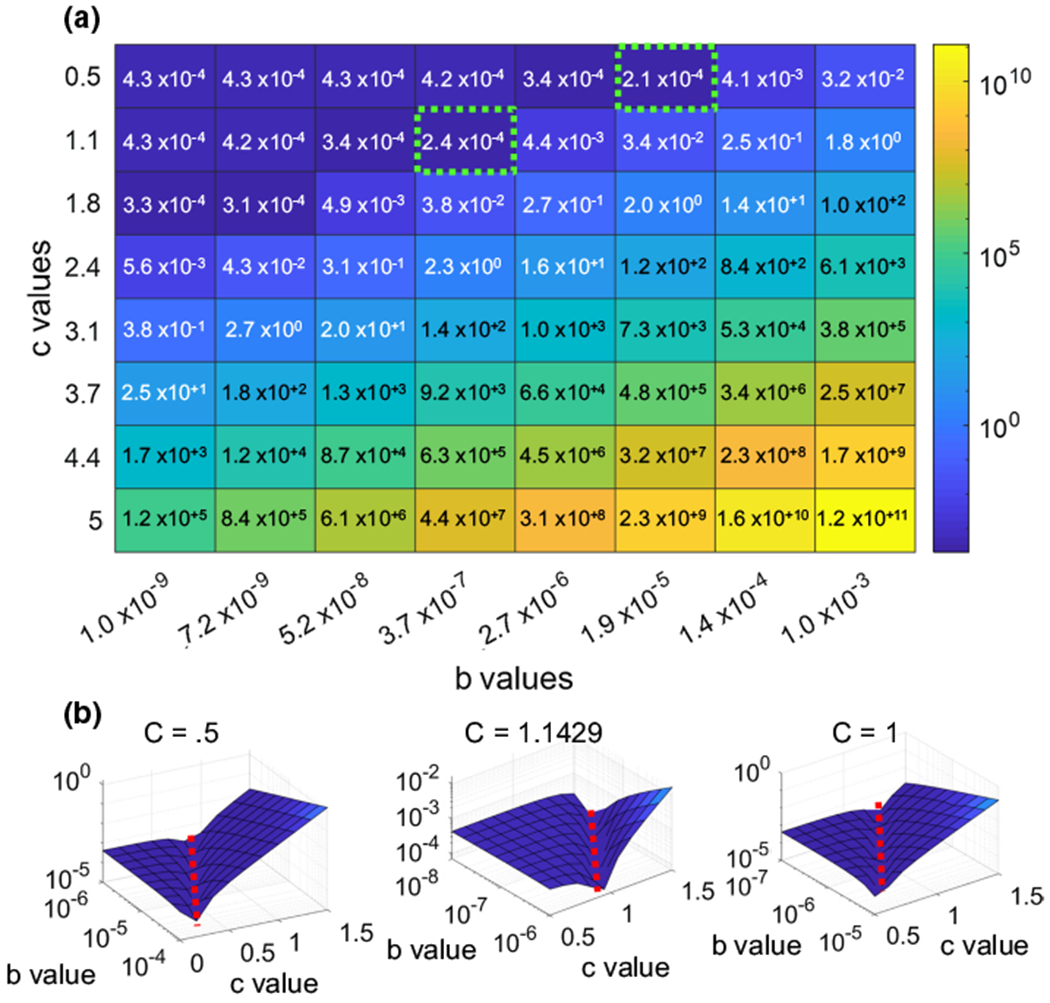
Optimization of Lamin A/C knockdown nuclei shows a linear elasticity relationship. a Error surfaces for 3 Lamin A/C-depleted nuclei showed a rut-like error when using different b and c values. b Higher-resolution error surfaces were generated around the lowest points of the original surface. These error surfaces produced minimum values on the order of 10−4, similar to the error surface generated around c = 1, demonstrating that there is a correlation between b and c
Fig. 6.
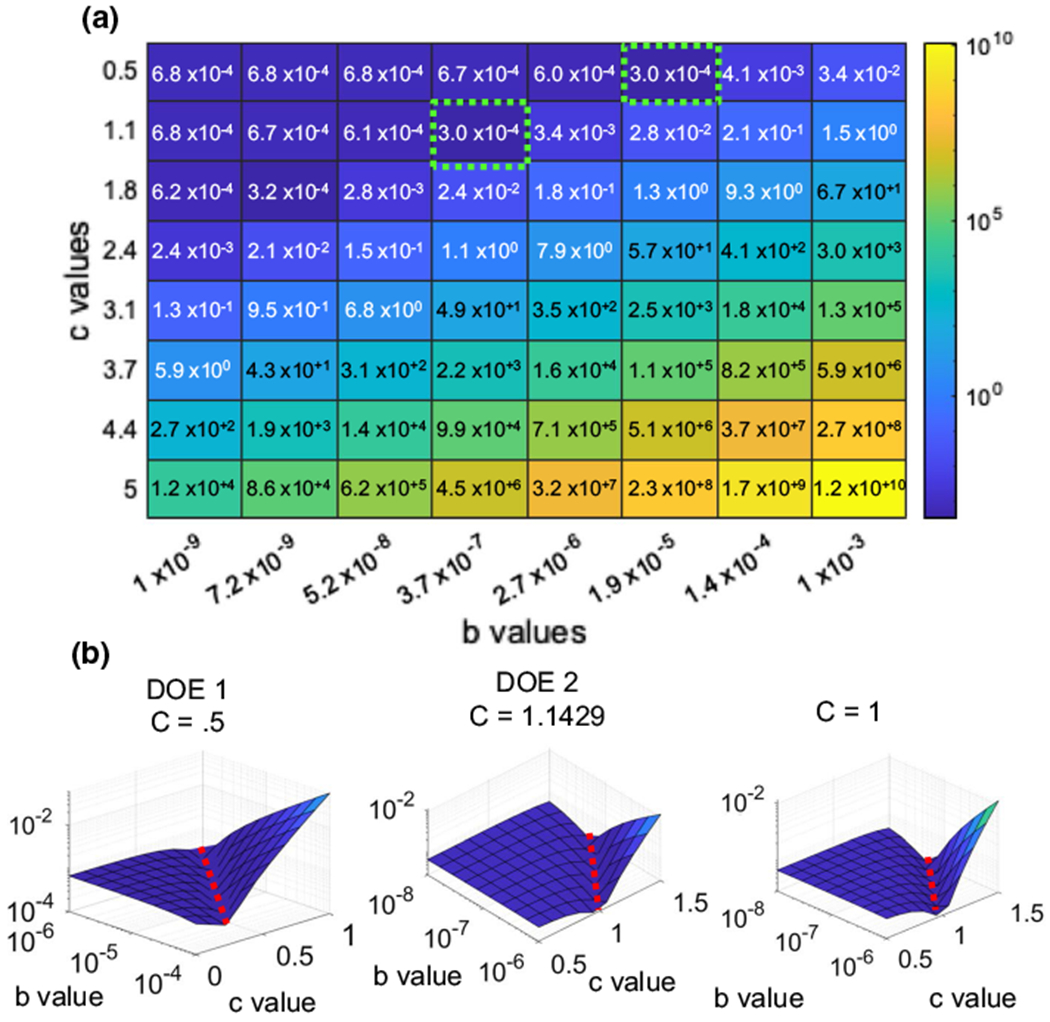
Optimization data for control nuclei using linear and exponential conversion factors. a Error surfaces for 3 control nuclei show a rut-like error when using different b and c values. b Higher resolution error surfaces were then done around the lowest points of the original surface, these error surfaces produces minimum values around 10−4 similar to the error surface generated around c = 1 showing that there is a correlation between b and c
Repeating the same procedure using the Lamin A/C + chromatin mesh and AFM data from intact nuclei exhibited a similar outcome. We again found that the two c values of 0.5 and 1.1 produced a minimum value within our original 8 X 8 grid (green dotted boxes). For the first minimum value, a 10 X 10 surface centered on b = 3.7 × 10⁻⁷ μN/μm2 and c = 1.1 was generated. For the second minimum, we created a surface centered on b = 1.9 × 10⁻⁵ μN/μm2 and c = 0.5. Both surfaces showed a minimum error along a straight line for different b values (dotted red lines). Comparing these values to another 10 × 10 surface centered on b = 1 × 10⁻⁷ μN/μm2 and c = 1 showed a similar pattern, indicating that a linear relationship between voxel intensity and material property is sufficient for Lamin A/C nuclei. We then set c = 1 and used the Matlab algorithm “fmincon” optimization algorithm with a step tolerance of 1 × 10⁻⁹ to find the b values that minimized the root mean square error for three “training” nuclei (nuclei 1, 2 and 3) for both chromatin and Lamin A/C groups. This step resulted in an optimized b value of 6.3 × 10⁻⁷ μN/μm2 with an error of 5.5 × 10⁻⁵ μN/μm2 for chromatin. For Lamin A/C, the b mean value was 8.64 × 10⁻⁷ μN/μm2 with an error of 3.1 × 10⁻⁴ μN/μm2.
3.2. Linear conversion model is distinct from a homogeneous model for chromatin
To test the differences between the homogeneous and linear-elastic heterogeneous models, the homogeneous chromatin models were made from the chromatin structures of nuclei #1–#3 by setting all the elements to same elastic modulus. The modulus value was determined via minimizing the RMSE between the load–displacement curves of the in silico and experimental AFM data of the Lamin A/C-depleted nuclei, producing a modulus of elasticity of 2.7 × 10⁻⁴ μN/μm2 with a RMSE value of 6.2 × 10⁻⁵ μN/μm2. There was no statistical difference between the error of the homogeneous and linear-elastic heterogenous models (p = 0.83). Similarly, applying the error-minimized b values to homogenous and heterogeneous models generated from the test nuclei (#4 and #5) resulted in RMSE values of 6.2 × 10⁻⁵ μN/μm2 and 5.5 × 10⁻⁵ μN/μm2 with similar error values (p = 0.63), suggesting that the bulk nuclei response can be modeled using either homogenous or heterogeneous models (Table 1).
Table 1.
Chromatin material optimization data
| Linear conversion | Homogeneous model | |
|---|---|---|
| B factor/elasticity | 6.3 × 10⁻⁷ μN/μm2 | 2.8 × 10⁻⁴ μN/μm2 |
| Average error of testing set | 5.5 × 10⁻⁵ μN/μm2 | 6.2 × 10⁻⁵ μN/μm2 |
Next, the in silico cross-sectional von Mises stress during the 1 μm indentation of the tip was compared between the homogeneous and heterogeneous chromatin models of nuclei #4 and #5. To compare the average von Mises stresses between heterogeneous and homogeneous model simulations, average von Mises stresses at mid-sagittal planes were plotted and compared across a 1 μm region of interest located between nuclear heights Z = 5 μm and Z = 6 μm. The von Mises stresses from each element within the models of each group were plotted and statistically compared between the two groups.
The heterogenous models of nuclei #4 (top) and #5 (bottom) showed higher peaks at the nuclear periphery of the region of interest (Fig. 7b). Quantification of the peripheral peak stresses showed 16% greater stresses in the heterogenous model when compared to the homogenous model (p < 0.001). The heterogeneous model also showed more efficient load carrying as shown by lower peak stresses that were distributed among more elements when compared to the homogenous model where a smaller number of elements had to carry greater loads (Fig. 7c).
Fig. 7.
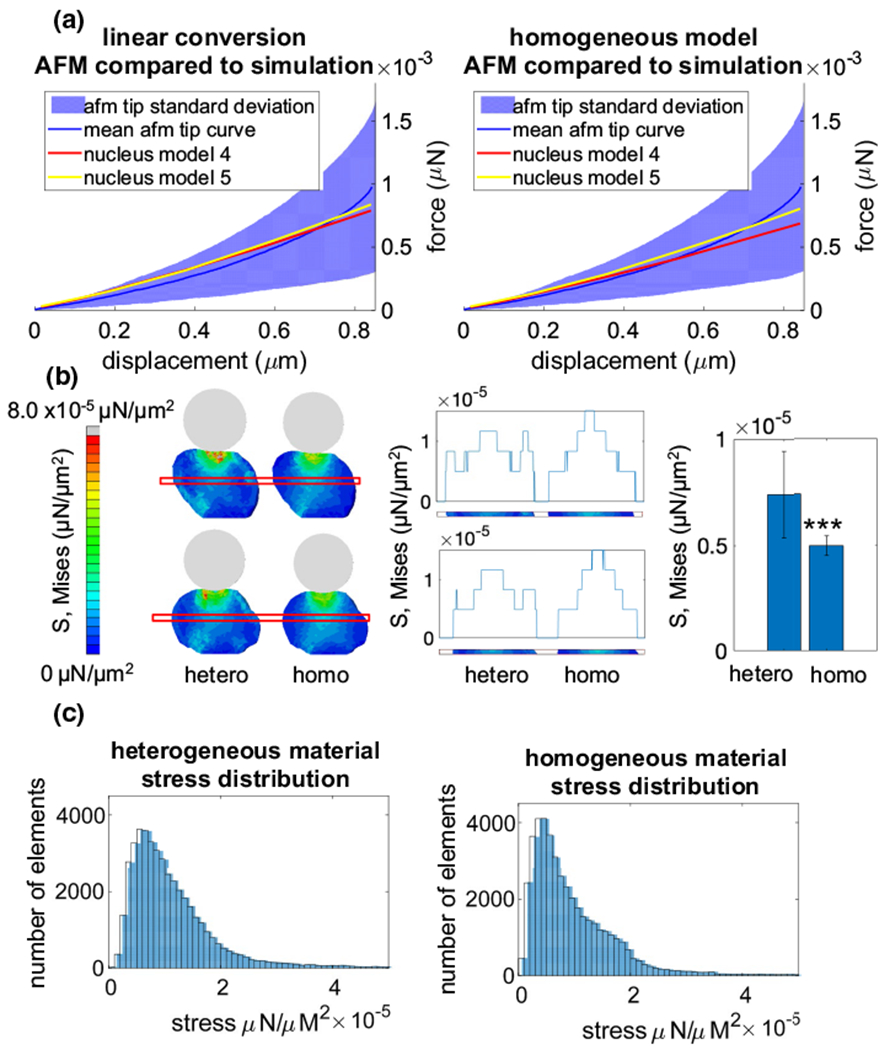
Linear conversion vs homogeneous model for chromatin. a The simulated force curves were superimposed onto the Lamin A/C KO results, comparing the resulting force curves from the linear conversion (left) to the results of the homogeneous model (right). b Cross sections of the model when fully compressed were imaged (left) and the average stresses within a 1 μm tall region beginning at a height of Z = 5 μm were plotted (middle). Stresses within the outer 25 percentile of both nuclei were plotted with a bar plot (right), showing the difference between the stress distributions within the homogeneous and heterogeneous models.Please refer to Fig. S4 for other nuclei images. c Von Mises stress data were collected from the elements of both models at maximum AFM tip compression and plotted within a histogram to show the difference between the stresses developed within the homogeneous and heterogeneous models
4. Discussion
Deformation of the nucleus regulates gene transcription via altering both DNA confirmation (Rubin et al. 2018) and the nuclear entry of transcription factors such as YAP/TAZ (Dupont et al. 2011). Nuclear deformation in response to mechanical forces is modulated by the mechanical stiffness provided by chromatin and Lamin A/C within the nucleus (Martins et al. 2012). The computational framework developed here was able to capture geometrical and structural inhomogeneities of both Lamin A/C and chromatin from confocal images. Using constants derived from the calibration of AFM voxel-intensities to elastic moduli, mechanical behavior of nuclei was predicted merely from images without performing a physical mechanical test. The inherent limitation of this approach is that prior to predicting nuclear mechanical properties, a relatively large sample of AFM and confocal images is necessary. It has been reported that inaccurate determination of the indentation contact radius between AFM tip and the nucleus can lead to incorrect nuclear modulus readings (Cao and Chandra 2010). As seen by our confocal images, apical nuclear surface has different shapes (Fig. S3) and thus may result in sample to sample variability. The contact conditions between the AFM tip and the nuclear surface are important as the indentation response depends on the geometry of the nucleus boundary and the distance from the indentation position to the boundary. The small sample size of our simulation data, however, precluded us from studying the effect of nuclear contact geometry and therefore could not be reported in the present work. In the future, a study with a larger sample size will allow us to observe and study this effect in more detail. During experimental data collection, we have used a top-down looking camera to determine the middle of the nuclei to indent during AFM testing. (Newberg et al. 2020) Therefore, we could not use a visual confirmation on whether nuclei and AFM tip was in perfect contact nor ensure that the AFM tip was perfectly aligned with the nuclei center. To keep the contact consistent as possible, the loading protocol did not start until a 2–3 nN setpoint was first reached to ensure the probe was in contact with the cell without significantly deforming it. If contact with the nucleus during the approach was less than 600 nm, that data were discarded. The standard deviation of the AFM indentation curves likely reflects the variation of both nuclear structure and AFM contact differences and that the experimentally determined target modulus values may not be entirely accurate due to the variability in AFM measurements. Pixel intensity to elastic moduli mapping done using these nuclei-specific meshes with averaged elastic moduli target showed that the elastic moduli variance between the five experimental nuclei was within the standard deviation of the experimental data, suggesting that the variance between AFM and FEM data was comparable and nuclear shape differences were accounted for during simulations. Further, while it was outside of the scope of the current study, errors associated with experiment-to-experiment variability of confocal images will need to be evaluated in future studies. Finally, for these predictions to be accurate, the nucleus has to be isolated from the cell as the cytoskeletal contribution to mechanical properties obtained from AFM cannot be avoided in intact cells. Even with these limitations, our method enables the prediction of nuclear stiffness and intra-nuclear deformation with only a simple nuclear isolation protocol and confocal imaging. The mechanical models of isolated, standalone nuclei developed here may also provide mechanistic insight into cellular mechanics and provide a basis for developing mechanical models of nuclei in intact cells in the future.
Our model provides a number of advantages over finite element analyses of the cell nucleus that tend to model the nucleus as a homogenous material with idealized geometry. (Wang et al. 2019; McGarry and Prendergast 2004) While comparisons between homogenous and heterogenous nuclear structures showed no significant changes in the “bulk” structural response under in silico AFM experiments, stresses throughout the nuclear structures were different where stresses concentrations were dependent upon the chromatin and Lamin A/C distribution density obtained from the original images. As chromatin condensation has been shown to change due to external nuclear loading (Heo et al. 2015), these models may provide useful predictions of which regions of chromatin are experiencing larger loads. Thinking within the context of an entire cell, models that rely on standard linear elastic model and deformation data to infer mechanical properties have been used for whole cell (Cao et al. 2013), isolated nuclei (Guilluy et al. 2014) and cytoskeletal elements (Nagayama et al. 2014). In particular, using two component models has advantages in estimating the correct nuclear properties and can introduce corrections based on initial nuclear geometry to reduce variance. We have previously reported that taking cell nuclei outside of a cell results in a 20 to 30% modulus decrease (Newberg et al. 2020); therefore, it is possible that alterations in the nuclear structure and geometry during extraction may result in errors. On the other hand, cell has many other elements that regulate cell stiffness, including cell cytoskeleton. For example, application of mechanical challenge to cells results in 400% increase in the AFM-measured elastic modulus when nuclei were pressed in live cells. Isolated nuclei, on the other hand, only show a 75% increase in modulus (Newberg et al. 2020), suggesting that there was a considerable change in non-nuclear structures. Therefore, future methods that can combine, explicit nuclear measurements and multicomponent cell models will be of value to understand cellular behavior in living tissues.
Another potential advantage of this modeling system is the incorporation of nuclear envelope proteins into the generated models. In this study, we modeled Lamin A/C as a heterogeneous material. Interestingly, the levels of Lamin A/C within the nucleus have been shown to change under microgravity (Dupont et al. 2011). With our model, it may be possible to predict the changes in nuclear stiffness due to alterations in Lamin A/C levels. Further, the structural contributions of other nuclear envelope proteins such as nuclear pore complexes can also be incorporated into these models in the future, providing a robust computational framework for studying the forces on a number of nuclear proteins.
Previous research described the nucleus’s mechanical elasticity as either linear elastic or hyperelastic (Tang et al. 2019). During our experiments, we chose to model the nucleus as linear elastic. As both homogenous and linear conversion models of nucleus #4 and #5 produced linear force–displacement curves, we also implemented hyperelastic Mooney–Rivlin and neo-Hookean material definitions (Tang et al. 2019) which again produced linear force–displacement relationships (Fig. S2), suggesting that the shape of in silico loading curves was independent of the use of hyperelastic Mooney–Rivlin and neo-Hookean models. Corroborating these in silico findings, as shown in Fig. S5, 38% of the AFM-tested nuclei showed linear loading curves. Plating cells on stiffer substrates may influence the AFM measurements due to deformations of the substrate. (Niu and Cao 2014) However, since we only used plastic for our AFM measurements, we were not able to measure the magnitude of this contribution. Although the absolute magnitude of these values may change as a result of the substrate effect, this still allows for evaluations of the relative changes between intact and Lamin A/C-depleted behavior. Further, based on the three orders of magnitude difference between cell (~ 2 kPa) and plastic (~ 3GPa) modulus, we used a rigid substrate assumption in our simulations so that the substrate was unable to deform during the simulations. It is possible that this simplification introduced errors to our results and may not fully match the experimental conditions. A future model using a deformable bottom to incorporate a substrate effect may enhance our current model and increase the accuracy of our simulations.
In summary, we generated individual finite element models of nuclei from confocal images. Importantly, these models were tuned to match experimental AFM results, generating a similar bulk mechanical behavior when compared to a homogeneous nuclear structure. We also demonstrated that if a proper relation between chromatin stiffness and image intensity is found, our method can be used to model internal chromatin dynamics within the nucleus. Ultimately, our study may lead to more effective techniques and insight into mechanobiological phenomena within the cell nucleus, elucidating cell nucleus plasticity in response to the application of mechanical forces.
Supplementary Material
Acknowledgements
We greatly appreciate the AFM expertise from Dr. Paul Davis and the Surface Sciences Laboratory.
Funding
NASA ISGC NNX15AI04H, NIH awards R01AG059923, 5P2CHD086843-03, P20GM109095, P20GM103408 and NSF awards 1929188 & 2025505.
Footnotes
Supplementary Information The online version contains supplementary material available at https://doi.org/10.1007/s10237-021-01513-w.
Code availability The code generated and/or analyzed during the current study are available from the corresponding author on reasonable request.
Conflict of interest The author(s) declare no competing interests financial or otherwise.
Ethical approval All methods were carried out in accordance with relevant guidelines and regulations of Boise Institutional Animal Care and Use Committee and Institutional Biosafety Committee. All procedures were approved by Boise State University Institutional Animal Care and Use Committee, and Institutional Biosafety Committee.
Consent for publication All authors consent to publication.
Availability of data and material
The datasets generated and/or analyzed during the current study are available from the corresponding author on reasonable request.
References
- Andalib MN, Lee JS, Ha L, Dzenis Y, Lim JY (2016) Focal adhesion kinase regulation in stem cell alignment and spreading on nanofibers. Biochem Biophys Res Commun 473:920–925. 10.1016/j.bbrc.2016.03.151 [DOI] [PMC free article] [PubMed] [Google Scholar]
- Bas G et al. (2020) Low intensity vibrations augment mesenchymal stem cell proliferation and differentiation capacity during in vitro expansion. Sci Rep 10:9369. 10.1038/s41598-020-66055-0 [DOI] [PMC free article] [PubMed] [Google Scholar]
- Cao G, Chandra N (2010) Evaluation of biological cell properties using dynamic indentation measurement. Phys Rev E 81:021924. 10.1103/PhysRevE.81.021924 [DOI] [PubMed] [Google Scholar]
- Cao G, Sui J, Sun S (2013) Evaluating the nucleus effect on the dynamic indentation behavior of cells. Biomech Model Mechanobiol 12:55–66. 10.1007/s10237-012-0381-z [DOI] [PubMed] [Google Scholar]
- Darling EM, Di Carlo D (2015) High-throughput assessment of cellular mechanical properties. Annu Rev Biomed Eng 17:35–62. 10.1146/annurev-bioeng-071114-040545 [DOI] [PMC free article] [PubMed] [Google Scholar]
- Dupont S et al. (2011) Role of YAP/TAZ in mechanotransduction. Nature 474:179–183 [DOI] [PubMed] [Google Scholar]
- Engler AJ, Sen S, Sweeney HL, Discher DE (2006) Matrix elasticity directs stem cell lineage specification. Cell 126:677–689. 10.1016/j.cell.2006.06.044 [DOI] [PubMed] [Google Scholar]
- Ghosh S et al. (2019) Deformation microscopy for dynamic intracellular and intranuclear mapping of mechanics with high spatiotemporal resolution. Cell Rep 27:1607–1620.e1604. 10.1016/j.celrep.2019.04.009 [DOI] [PMC free article] [PubMed] [Google Scholar]
- Guilluy C et al. (2014) Isolated nuclei adapt to force and reveal a mechanotransduction pathway in the nucleus. Nat Cell Biol 16:376–381. 10.1038/ncb2927 [DOI] [PMC free article] [PubMed] [Google Scholar]
- Hanna H, Mir LM, Andre FM (2018) In vitro osteoblastic differentiation of mesenchymal stem cells generates cell layers with distinct properties. Stem Cell Res Ther 9:203. 10.1186/s13287-018-0942-x [DOI] [PMC free article] [PubMed] [Google Scholar]
- Harris AR, Jreij P, Fletcher DA (2016) Mechanotransduction by the actin cytoskeleton: converting mechanical stimuli into biochemical signals. Annu Rev Biophys 47:617–631. 10.1146/annurev-biophys-070816-033547 [DOI] [Google Scholar]
- Heo SJ et al. (2015) Biophysical regulation of chromatin architecture instills a mechanical memory in mesenchymal stem cells. Sci Rep 5:16895. 10.1038/srep16895 [DOI] [PMC free article] [PubMed] [Google Scholar]
- Hoffman LM et al. (2020) Mechanical stress triggers nuclear remodeling and the formation of Transmembrane Actin Nuclear lines with associated Nuclear Pore Complexes. Mol biol cell, mbc. E19-01-0027, 10.1091/mbc.E19-01-0027 [DOI] [PMC free article] [PubMed] [Google Scholar]
- Humphrey JD, Dufresne ER, Schwartz MA (2014) Mechanotransduction and extracellular matrix homeostasis. Nat Rev Mol Cell Biol 15:802–812. 10.1038/nrm3896 [DOI] [PMC free article] [PubMed] [Google Scholar]
- Lammerding J et al. (2006) Lamins A and C but not lamin B1 regulate nuclear mechanics. J Biol Chem 281:25768–25780. 10.1074/jbc.M513511200 [DOI] [PubMed] [Google Scholar]
- Le HQ et al. (2016) Mechanical regulation of transcription controls Polycomb-mediated gene silencing during lineage commitment. Nat Cell Biol 18:864–875. 10.1038/ncb3387 [DOI] [PubMed] [Google Scholar]
- Makhija E, Jokhun DS, Shivashankar GV (2016) Nuclear deformability and telomere dynamics are regulated by cell geometric constraints. Proc Natl Acad Sci USA 113:E32–40. 10.1073/pnas.1513189113 [DOI] [PMC free article] [PubMed] [Google Scholar]
- Martins RP, Finan JD, Farshid G, Lee DA (2012) Mechanical regulation of nuclear structure and function. Annu Rev Biomed Eng 14:431–455. 10.1146/annurev-bioeng-071910-124638 [DOI] [PMC free article] [PubMed] [Google Scholar]
- McGarry JG, Prendergast PJ (2004) A three-dimensional finite element model of an adherent eukaryotic cell. Eur Cells Mater 7:27–33; discussion 33–24 [DOI] [PubMed] [Google Scholar]
- Nagayama K, Yamazaki S, Yahiro Y, Matsumoto T (2014) Estimation of the mechanical connection between apical stress fibers and the nucleus in vascular smooth muscle cells cultured on a substrate. J Biomech. 10.1016/j.jbiomech.2014.01.042 [DOI] [PubMed] [Google Scholar]
- Newberg J et al. (2020) Isolated nuclei stiffen in response to low intensity vibration. J Biomech. 10.1016/j.jbiomech.2020.110012 [DOI] [PMC free article] [PubMed] [Google Scholar]
- Niu T, Cao G (2014) Finite size effect does not depend on the loading history in soft matter indentation. J Phys D Appl Phys 47:385303. 10.1088/0022-3727/47/38/385303 [DOI] [Google Scholar]
- Pagnotti GM et al. (2019) Combating osteoporosis and obesity with exercise: leveraging cell mechanosensitivity. Nat Rev Endocrinol. 10.1038/s41574-019-0170-1 [DOI] [PMC free article] [PubMed] [Google Scholar]
- Peister A et al. (2004) Adult stem cells from bone marrow (MSCs) isolated from different strains of inbred mice vary in surface epitopes, rates of proliferation, and differentiation potential. Blood 103:1662–1668. 10.1182/blood-2003-09-3070 [DOI] [PubMed] [Google Scholar]
- Rubin J, Styner M, Uzer G (2018) Physical signals may affect mesenchymal stem cell differentiation via epigenetic controls. Exerc Sport Sci Rev 46:42–47. 10.1249/jes.0000000000000129 [DOI] [PMC free article] [PubMed] [Google Scholar]
- Sankaran JS et al. (2020) Knockdown of formin mDia2 alters lamin B1 levels and increases osteogenesis in stem cells. Stem Cells 38:102–117. 10.1002/stem.3098 [DOI] [PMC free article] [PubMed] [Google Scholar]
- Shiu J-Y, Aires L, Lin Z, Vogel V (2018) Nanopillar force measurements reveal actin-cap-mediated YAP mechanotransduction. Nat Cell Biol 20:262–271. 10.1038/s41556-017-0030-y [DOI] [PubMed] [Google Scholar]
- Stephens AD, Banigan EJ, Marko JF (2018a) Separate roles for chromatin and lamins in nuclear mechanics. Nucleus (austin, Tex) 9:119–124. 10.1080/19491034.2017.1414118 [DOI] [PMC free article] [PubMed] [Google Scholar]
- Stephens AD et al. (2018b) Chromatin histone modifications and rigidity affect nuclear morphology independent of lamins. Mol Biol Cell 29:220–233. 10.1091/mbc.E17-06-0410 [DOI] [PMC free article] [PubMed] [Google Scholar]
- Tang G, Galluzzi M, Zhang B, Shen YL, Stadler FJ (2019) Biomechanical heterogeneity of living cells: comparison between atomic force microscopy and finite element simulation. Langmuir: ACS J Surf Colloids 35:7578–7587. 10.1021/acs.langmuir.8b02211 [DOI] [PubMed] [Google Scholar]
- Wang L, Wang L, Xu L, Chen W (2019) Finite element modelling of single cell based on atomic force microscope indentation method. Comput Math Methods Med 2019:7895061. 10.1155/2019/7895061 [DOI] [PMC free article] [PubMed] [Google Scholar]
Associated Data
This section collects any data citations, data availability statements, or supplementary materials included in this article.
Supplementary Materials
Data Availability Statement
The datasets generated and/or analyzed during the current study are available from the corresponding author on reasonable request.


