

Abstract
About one-quarter of the euchromatic portion of the male-specific region of the human Y chromosome consists of large duplicated sequences that are organized in eight palindromes (termed P1–P8), which undergo arm-to arm gene conversion, a proposed mechanism for maintaining their sequence integrity. Although the relevance of gene conversion in the evolution of palindromic sequences has been profoundly recognized, the dynamic of this mechanism is still nuanced. To shed light into the evolution of these genomic elements, we performed a high-depth (50×) targeted next-generation sequencing of the palindrome P6 in 157 subjects belonging to the most divergent evolutionary lineages of the Y chromosome. We found 118 new paralogous sequence variants, which were placed into the context of a robust Y chromosome phylogeny based on 7240 SNPs of the X-degenerate region. We mapped along the phylogeny 80 gene conversion events that shaped the diversity of P6 arms during recent human history. In contrast to previous studies, we demonstrated that arm-to-arm gene conversion, which occurs at a rate of 6.01 × 10 −6 conversions/base/year, is not biased toward the retention of the ancestral state of sequences. We also found a significantly lower mutation rate of the arms (6.18 × 10⁻¹⁰ mutations/base/year) compared with the spacer (9.16 × 10⁻¹⁰ mutations/base/year), a finding that may explain the observed higher inter-species conservation of arms, without invoking any bias of conversion. Finally, by formally testing the mutation/conversion balance in P6, we found that the arms of this palindrome reached a steady-state equilibrium between mutation and gene conversion.
Introduction
The male-specific region (MSY) of the human Y chromosome represents the only haploid portion of the nuclear genome. It covers about 95% of the entire chromosome and is composed of three different classes of euchromatic sequences: X-transposed, X-degenerate and ampliconic (1). The X-transposed region is a large inter-chromosomal segmental duplication which originated from an X-to-Y transposition about 4.7 million years ago (2). The X-degenerate sequences are the remnants of ancient autosomes from which sex chromosomes co-evolved and contain mostly housekeeping single-copy genes, whereas the ampliconic portion is characterized by a large number of intra-chromosomal segmental duplications and is enriched in genes expressed predominantly or exclusively in testes (1,3).
The duplicated sequences of the ampliconic portion are mainly organized in eight palindromic structures (termed P1–P8) consisting of two highly similar intra-chromosomal inverted paralogs (or palindrome arms) separated by a non-duplicated spacer (3). Thus, owing to the peculiar structural organization of palindromes, they can be considered in a ‘pseudo-diploid’ state, making the MSY haploidy only partial (4). A further fascinating feature is that palindromes show an arm-to-arm nucleotide identity >99.9% owing to abundant intra-chromosomal gene-conversion events occurring between the two arms of the same element (3–6).
It is now widely recognized that near-identical palindromic repeats do not represent a peculiarity of the human Y chromosome, but they have been conserved or independently arisen in the sex-specific haploid chromosomes of several unrelated taxa, also belonging to different kingdoms (2,6,7–15). Large palindromes are also overrepresented on the mammalian X chromosome (which is haploid in males) (2,16–18) and, like the Y ones, the X palindromes may undergo arm-to-arm gene conversion events (14). The presence of these ‘pseudo-diploid’ elements on the haploid portions of the nuclear genome of several species suggests a broad biological significance for them; nevertheless, despite some theoretical hypotheses have been postulated (6), the evolution and the functional role of Y palindromes have yet to be clarified.
In general, Y palindromes exhibit an excess of multi-copy genes (with a tissue-specific expression in testes) that are essential for sperm production and fertility (1–3), so it has been proposed that duplication and arm-to-arm gene conversion may have evolved to protect these fundamental genes against the genetic erosion that has characterized the evolution of the mammalian Y chromosome, owing to the lack of meiotic recombination (3,6,19–22). Moreover, it has been observed that human–chimpanzee sequence similarity between arms is significantly higher than that observed between spacers (3); this finding has been interpreted by hypothesizing that gene conversion could be a mechanism evolved to counteract the emergence of new mutations in important genes by conserving the ancestral state of gene sequences (3,19). It means that, through a gene conversion event, a de novo mutation on a paralog will be preferentially back-mutated to the ancestral state rather than being transmitted to the other arm. In this context, some studies confirmed this hypothesis showing a weak evidence that Y-Y gene conversion may have an apparent bias toward the retention of the ancestral state of the variants (4,5). However, these studies present some critical aspects, such as a limited number of bases analyzed or a low diversity in the Y chromosomes used. Although the relevance of gene conversion in the evolution of palindromes has been profoundly recognized, the dynamic of this mechanism is far to be clarified and the existence of a conversion bias toward the ancestral state has yet to be confirmed.
In line of principle, gene conversion dynamics cannot be investigated if the interacting paralogs have complete sequence identity; on the contrary, it can be exclusively done by analyzing the population diversity of the paralogous sequence variants (PSVs), i.e. single nucleotide differences between the two palindrome arms. A mutational event on one arm of the palindrome will generate a PSV in a sample that might be considered in a ‘pseudo-heterozygous’ state (e.g. if one base on the proximal arm is an A and the paralogous base on the distal arm is a C, it resulted in a A/C genotype). The main effect of gene conversion is to change the state of the genotype from ‘pseudo-heterozygous’ (A/C) to ‘pseudo-homozygous’ (A/A or C/C depending on the direction of the conversion event). The observation within the population of chromosomes with all the three genotypes indicates that, if recurrent mutations are excluded, at least one gene conversion event has occurred (4). Unfortunately, this observation alone does not provide any information about the number of conversions in which the PSV has been involved. However, by knowing the evolutionary relationships between the analyzed palindromes, it will be possible to give an estimate of the actual number of events that have occurred (see Materials and Methods).
The purpose of this study is to shed light into the evolutionary dynamics of the human Y palindromes. To this aim, we first reanalyzed the genetic diversity of about 3.3 Mb of the unique X-degenerate region in 157 samples previously sequenced (23,24) in order to reconstruct a unique and unambiguous Y phylogeny. Subsequently, for exactly the same samples, we performed a high-depth (>50×) targeted next-generation sequencing (NGS) of palindrome P6, the biggest singleton palindromic structure of the MSY (1,25,26).
Through this analysis we identified, within P6 arms, many more PSVs than in previous studies (3–5), thus increasing our ability to understand the dynamics of the gene conversion events during the recent human history. By mapping the gene conversion events within the Y phylogeny, we investigated if arm-to-arm gene conversion in P6 is directed toward the retention of the ancestral state of sequences, as previously proposed.
By exploiting the Y phylogeny, it was also possible to precisely calculate a gene conversion rate. Through this analysis, we evaluated if the establishment of a steady-state equilibrium in the diversity between arms exists in which the introduction of new variants through mutation is counterbalanced by the elimination of arm-to-arm differences by gene conversion.
Results
MSY phylogenetic tree
In order to shed light on the evolutionary dynamics of the P6 palindrome arms, we need to reconstruct the phylogenetic relationships among the 157 Y chromosomes, here sequenced for the palindromic regions. To this aim, we reanalyzed the genetic variation within ~3.3 Mb (Supplementary Material, Table S1) of the X-degenerate portion of the MSY for exactly the same Y chromosomes (Supplementary Material, Table S2) that were previously sequenced at high-depth (about 50×) (23,24). Moreover, we included in the analysis four precisely radiocarbon-dated ancient specimens (27–29) that were used as calibration points for an accurate time estimate of the tree nodes.
Our new single nucleotide polymorphism (SNP) calling analysis revealed a total of 7240 mutational events which occurred in 7206 positions, with 9 of them resulting to be tri-allelic and 23 recurrent (Supplementary Material, Table S3). In addition, 57 positions which were invariant in the entire sample set, but different from the reference sequence (GRCh37/hg19), have been interpreted as reference-specific mutations and were not considered for further phylogenetic analysis (Supplementary Material, Table S4). Most of the mutations we identified were already found in the two previous studies (23,24), but we characterized 294 new variant sites belonging exclusively to haplogroup J (from branch 148 to branch 249, as shown in Fig. 1, Supplementary Material, Table S3). The discovery of new variants is because of the higher number of bases analyzed in the present study when compared with Finocchio et al. (24): ~3.3 Mb instead of ~2.7 Mb.
Figure 1 .

Maximum parsimony Y chromosome tree obtained with the 7240 variants here identified. Phylogenetic relationships among the 161 samples analyzed. At the tip of each branch, the ID sample is reported; the four Y chromosomes from ancient samples are marked with the symbol ‘†’. The branch nomenclature (in brackets) and the number of mutational events defining each branch is shown above (or near) it. Branch lengths are proportional to the number of mutations. To the right, the main haplogroups are indicated.
As expected, we observed an excess of transitions when compared with transversions (4584 vs. 2656), which corresponds to a Ti/Tv ratio = 1.73, which is in line with previous findings on the X-degenerate variability (30–32).
We used all the 7240 mutational events to reconstruct a maximum parsimony patrilinear tree (Fig. 1), which was consistent with previously published phylogenies (23,24,30,33–38).
By exploiting the four archeologically dated specimens as calibration points (27–29), we obtained a mutation rate for the X-degenerate region of 7.39 × 10⁻¹⁰ mutations/base/year (SD = 0.38 × 10⁻¹⁰), which is consistent with previous estimates (23,24,27,31,36) and corresponding to one mutation every ~406.6 years (±21 years). These figures are essential to further investigate the timing and evolutionary dynamics of gene conversion in P6 palindrome.
New insights into palindromic-read mapping
The standard approaches of NGS might not be suitable for ampliconic region analysis owing to the disproportion between the length of NGS reads (about 100–200 bp) and the greater length of amplicon-repeat units (i.e. the palindrome arms).
Generally, each read deriving from different highly similar repeats could be not be univocally mapped within the reference genome (39). More specifically, in case of P6 palindrome, owing to the almost complete identity between arms (about 99.97%), reads deriving from targeted sequencing of one arm will be mapped against both palindrome arms, producing a double value (2N) of the sequencing depth (DP) with respect to the depth (N) of a non-duplicated region, such as the spacer (Fig. 2).
Figure 2 .

Alignment of NGS reads against a palindromic region of the reference sequence. Alignment for the three possible ‘pseudo-diploid’ genotypes against a ‘pseudo-heterozygous’ (A) and a ‘pseudo-homozygous’ (B) reference sequence. For each genotype, the putative depth value for arms and spacer is reported. The table on the right shows the actual SNP distribution (‘True SNP distribution’ columns) and the results of the automatic SNP calling (‘SNP calling results’ columns).
A challenging issue is that this read mis-mapping may strongly affect the automatic SNP-calling procedure, especially in the case of a ‘pseudo-heterozygous’ reference. Indeed, in the presence of a reference PSV (e.g. a T/G–proximal arm/distal arm), depending on the genotype of the sequenced sample, we will have different results. In particular, the reads of a T/G sample result have to be accurately mapped at the corresponding paralogous sites of the T and G bases of the ‘pseudo-heterozygous’ reference so that a N depth value is observed at both sites. In this case, no real SNPs are present and no SNPs are called by the automatic pipeline (Fig. 2A). On the contrary, the reads of a sample showing a ‘pseudo-homozygous’ state, G/G (or T/T), are found to be completely mapped against the single paralogous position in the reference showing the same base, returning a DP value = 2N at this site and a DP = 0 at the other paralogous site (Fig. 2A). Thus, the automatic SNP calling will fail in the identification of a new SNP (actually present in the site showing the DP = 0), which can be identified only through the analysis of the read distribution over the paralogous sites (see Materials and Methods). In our sequences, we cover a total of four reference PSVs (V520, V521, V526 and V625) for which the SNP calling was based on the depth analysis.
Finally, in case of a ‘pseudo-homozygous’ reference sequence, the NGS reads of the three possible ‘pseudo-diploid’ states in the sample are mapped twice and randomly at both paralogous sites of the reference, returning a DP = 2N at each position (Fig. 2B). As a result, the SNP calling of a ‘pseudo-heterozygous’ sample will return two SNPs (one at each paralogous position), while only one SNP should be actually called (Fig. 2B).
Structural variation analysis within P6 palindrome
It is known that palindromes may be involved in structural rearrangements, such as the deletion of an entire arm (13,40,41).
To test whether both of the P6 palindrome arms were present, we specifically amplified both the inner and outer boundaries of the palindrome in each sample by using primer pairs (Supplementary Material, Table S5) overlapping the sequences between arms and unique regions. Through this analysis, we confirmed the presence of both proximal and distal arms in the whole sample set. This result suggests a strong evolutionary stability of P6 and is consistent with the observation that this palindrome is the only amplicon of the MSY which maintains the ancestral state of two arms in 1216 samples covering a high diversity of the Y chromosome tree (41).
To detect deletion/duplication events within arms, we performed an in silico depth analysis. By calculating the exponential moving average (EMA) of the standardized sequencing depth values of the palindrome (see Materials and Methods), we found no duplications, but we identified a ‘pseudo-homozygous’ ~1.4 kb putative deletion (Fig. 3) in the two phylogenetically related samples (S105 and S106) belonging to A2-PN3 lineage (branches 10 and 11, as shown in Fig. 1).
Figure 3 .

Depth graph of the two A2-PN3 deleted samples (S105-S106) and of a non-deleted control (S110) for both proximal and distal arms of P6 palindrome. At the bottom of each palindrome arm, the genomic coordinates are reported. The range of variability of depth values (in squared brackets) has been set to 0–150. To the left, the ID of each sample and the relative haplogroup affiliation is shown.
The putative deletion has been experimentally validated by PCR and Sanger sequencing of the two A2-PN3 samples, leading to the characterization of a 1393 bp deletion on both proximal (chrY:18299763-18301155) and distal (chrY:18507948-18509340) arms (Supplementary Material, Fig. S1).
Interestingly, by sequence analysis, we identified two identical 217 bp direct repeats (DRs), respectively, upstream and downstream the deleted fragment (Supplementary Material, Fig. S1). We hypothesized that an intra-chromosomal homologous recombination between DRs (occurred in the stem lineage of A2-PN3 samples—branch 9, as shown in Fig. 1) generated this deletion, which may have been subsequently transferred by a gene conversion event on the other arm.
It is worth noting that for the A2 chromosomes there is no possibility to restore the lost fragment. Thus, it seems that gene conversion, in spite of maintaining the structural integrity of palindromes (as previously hypothesized), may be also involved in the ‘fixation’ of deletions and the loss of genetic material from palindrome arms, suggesting the potential of Y-Y recombination as an evolutionary force capable of generating genetic erosion within ampliconic sequences.
Genetic diversity of P6 palindrome
In the reference sequence, P6 is the longest singleton palindrome of the MSY, being characterized by an arm length of about 110 kb together with a central spacer of 46 kb (266 kb in total) (1) and lacking extensive homology with other palindromes. From the arm-to-arm alignment of the P6 reference sequence, we identified 31 PSVs, resulting in a 99.97% of sequence identity.
In order to search for new P6 PSVs, after removing the interspersed repetitive elements, we obtained sequencing data for a total of 70 312 bp from the arms (35 326 and 34 986 bp for proximal and distal arm, respectively) and 18 911 bp from the haploid spacer (Supplementary Material, Table S6) for all the 157 samples (Supplementary Material, Table S2) that were previously sequenced for the X-degenerate region.
Owing to the mapping issues previously described, we could not establish on which arm the mutation occurred for ‘pseudo-heterozygous’ samples, except for PSVs shared with the reference genome. However, this aspect did not affect the possibility of identifying both the ‘pseudo-heterozygous’ genotypes and gene conversion events (see Materials and Methods).
Our high-resolution analyses revealed a total of 118 PSVs in the arms (Supplementary Material, Fig. S2), four of which were already present in the reference genome (V520, V521, V526 and V625). In particular, V520 was monomorphic (in a ‘pseudo-homozygous’ ancestral state) in all the sequenced samples, suggesting that it is a recently arisen mutation (a C to T transition) on the distal arm of the reference. All the remaining PSVs resulted to be polymorphic in our Y phylogeny and none of them have been already described in the dbSNP (build 151). Three PSVs (V540, V586 and V587) showed a peculiar mutational pattern along the phylogeny, which is compatible with a mutation that occurred on the stem lineage of the tree before the human Y chromosome radiation. Finally, two PSVs (V539 and V570) were found to be recurrent. Thus, the observed diversity of P6 arms can be explained by 116 mutational events in our phylogeny (Supplementary Material, Fig. S2, Supplementary Material, Table S7).
The mutational pattern of P6 palindrome arms is partially consistent with previous findings based on the analysis of the entire palindromic region (5,32). As expected, we found a higher number of transitions (83) compared with transversions (33) which resulted in a Ti/Tv ratio = 2.51, not significantly higher than the one observed here in the X-degenerate region and similar to the value for the whole ampliconic portion as reported by Helgason et al. (32).
Within the spacer (about 19 kb sequenced), we found a total of 52 variants, one of which (V832) can be considered as a mutation of the reference sequence (Supplementary Material, Table S8). We found a Ti/Tv (34/17) ratio = 2.0, slightly lower than the one observed in the palindrome arms and similar to the X-degenerate ratio.
Among mutational events, we can differentiate in A or T (W) nucleotides changing in G or C (S) nucleotides, or vice versa. Recently, a sequence analysis of all the palindromes on a limited portion of the Y phylogeny revealed an apparent mutational bias toward AT (5). Within P6 arms, we found a significantly higher (P = 0.006, Fisher Exact test) proportion of S-to-W substitutions (0.20) with respect to W-to-S mutations (0.11) (Table 1). Interestingly, this mutational behavior is not a peculiar feature of the palindrome arms, given that it can be observed within the spacer (P = 0.0134, Fisher Exact test). Although this pattern can be interpreted as an AT mutational bias, it is probably owing to the hypermutability of the CpG dinucleotides. Indeed, once corrected for the number of mutations occurring in CpG sites (both in palindrome arms and in the spacer), this significance disappears (Table 1). However, it is worth noting that we observe a significantly higher (Fisher Exact test, P = 0.028) proportion of S-to-W mutations in the spacer compared with the arms (Table 1). This difference probably reflects the effect of GC-biased gene conversion (see the following section) between arms, which can increase the GC content of the interacting paralogs.
Table 1.
Mutational behavior of P6 palindrome
| S-to-W mut/GCnt (%) | W-to-S mut/ATnt (%) | Ratio (S-to-W/W-to-S)a | |
|---|---|---|---|
| With CpG | |||
| Arms | 49/23 504 (0.20) | 55/46 808 (0.11) | 1.82** |
| Spacer | 22/6137 (0.36) | 21/12 774 (0.16) | 2.25* |
| Spacer-arm ratioa | 1.8* | 1.45 | |
| Without CpG | |||
| Arms | 36/23 491 (0.15) | —b | 1.36 |
| Spacer | 18/6133 (0.29) | —b | 1.81 |
| Spacer-arm ratioa | 1.93* | —b | |
a2 × 2 contingency table, Fisher Exact test.
bThe correction for CpG sites does not affect the W-to-S mut/ATnt ratio, which exhibits the same values.
* P-value < 0.05.
* * P-value < 0.01.
Dynamics of Y-Y gene conversion in P6 palindrome
Within our phylogeny, we found that 35 out of the 117 identified PSVs (excluding the monomorphic V520) (~30%) showed footprints of gene conversion and that about half of them (16 PSVs) are affected by multiple events (Supplementary Material, Fig. S2).
By exploiting the Y phylogeny, we were able to count a total of 80 gene conversion events (Supplementary Material, Fig. S1, Supplementary Material, Table S7), 34 of which restored the ancestral ‘pseudo-homozygous’ state and 45 of which restored the derived ‘pseudo-homozygous’ genotype. For a single event (within V623), owing to the lack of information about the state on the orthologous base from chimpanzee, it was not possible to assess the direction of the gene conversion event and on which phylogenetic branch it occurred.
This observation is at odds with previous findings in which a significant excess of conversions restoring the ancestral state has been observed in P6 palindrome (4). Differently, we observe a higher number of conversions generating the derived ‘pseudo-homozygous’ state. This difference (45 vs. 34), even though not statistically significant (P = 0.2159, Chi-square test), suggests that Y-Y gene conversion, within P6 palindrome, could not be a molecular mechanism involved in maintaining the ancestral sequence (4,5).
Importantly, it should be noted that Y-Y conversions toward the ancestral state are an underestimate of the actual number of events. This is because it is not possible to detect such events which occurred exactly on the same branch where the mutation generating the PSV took place. With these caveats in mind and in order to search for a possible ancestral/derived conversion bias, we decided to eliminate all the events toward the derived state which we would not have observed if they had occurred toward the ancestral. Through this approach, we discarded 20 to-derived conversions (Supplementary Material, Table S9) resulting in a total of 59 events, 25 of which toward the derived ‘pseudo-homozygous’ state. After this calibration, although the number of conversions toward the ancestral (34) is higher than that observed toward the derived state, this difference remains not significant (P = 0.2413, Chi-square test), confirming the lack of a specific ancestral/derived bias of the Y-Y gene conversion mechanism within P6 palindrome.
With this data, we also analyzed the GC-biased gene conversion, i.e. the tendency toward the fixation of GC base pairs rather than AT in a gene conversion event. Of the 80 events here identified, only 3 (V579, V619 and V623) are uninformative since they do not alter the GC content; among the remaining 77 cases, 58 resulted in the fixation of GC and 19 of AT (P = 8.8 × 10⁻⁶, Chi-square test), suggesting a strong GC bias within P6 palindrome.
The existence of the GC-biased gene conversion raises the possibility that a bias toward the ancestral state may actually exist but that it can be masked by the GC bias. It can happen when, for example, there are a greater number of events in which the derived base is represented by a G or a C. To test this hypothesis, we perform a new ancestral/derived bias analysis by using 44 events toward GC bases. This number has been obtained by discarding from the 58 GC conversions all the derived events that we would not have observed if they had occurred toward the ancestral (14 conversion events). Thus, among these GC-biased events, the number of to-ancestral conversions (24) has been found statistically indistinguishable from the to-derived ones (20) (P = 0.5465; Chi-square test).
By exploiting the Y-tree rate of mutation, we obtained an average Y-Y gene conversion rate of 6.01 × 10⁻⁶ conversions per base per year, which ranges between a minimum value of 4.42 × 10⁻⁶ (SD = 0.23 × 10⁻⁶) and a maximum value of 9.38 × 10⁻⁶ (SD = 0.48 × 10⁻⁶). This rate points that, on average, each base of the P6 palindrome is involved in Y-Y conversions six times every 106 years. Considering a 25-year human generation, this corresponds to a rate of 1.5 × 10⁻⁴ conversions per base per generation. Thus, in the transition from father to son, we expect to have an average of 16 bases affected by gene conversion within the 110 kb of the palindrome arm.
Since the mutational event creates new PSVs between the arms of the palindrome, whereas gene conversion erases those differences, it is possible that a steady-state equilibrium in the diversity between arms is established, where the mutation rate (that increases the diversity between arms) is counterbalanced by the gene conversion rate (that dilutes this diversity). It is possible to calculate an expected gene conversion rate by assuming the existence of such a balance (without considering the number of converted PSVs) (see Materials and Methods). Thus, using an estimated π average of 1.64 × 10⁻⁴ between P6 arms and a mutation rate of 6.18 × 10⁻¹⁰ mutations per base per year (see the following section), we tested the hypothesis of a mutation/conversion balance in P6 arms and we obtained an expected conversion rate equal to 7.54 × 10⁻⁶ (SD = 2.18 × 10⁻⁶) events per duplicated nucleotide per year, which resulted to be in the range of the conversion rate we calculated independently, without considering the hypothetical mutation/conversion balance. This correspondence may suggest that, within P6 palindrome, a mutation/conversion steady-state that maintains an average level of diversity between palindrome arms over time is established.
P6 palindrome mutation rate
In order to calculate a mutation rate specific for palindrome arms, we used all the 116 mutational events (Supplementary Material, Table S7) occurring during the whole phylogenetic time. We obtained an estimate of 5.6 × 10⁻¹⁰ (SD = 0.29 × 10⁻¹⁰) mutations per base per year.
It is worth noting that our calculation represents an underestimate of the actual mutation rate because it does not consider the mutations which generate new PSVs immediately converted to the ancestral state through gene conversion. So, we performed a new estimate of the mutation rate by incorporating 12 new hypothetical mutational events. This number has been calculated by taking into account the number of PSVs which have been converted to the ‘pseudo-homozygous’-derived state and that we would not have observed if conversion had occurred toward the ancestral state. Our consideration was based on the observation that there is not an ancestral/derived conversion bias, so the number of mutations which are immediately converted to the ‘pseudo-homozygous’-derived state should be equal (or similar) to the number of mutations converted to the ancestral state, which are invisible through our phylogenetic approach. By applying this correction, we hypothesized a new number of 128 mutations and we calculated a new refined mutation rate of 6.18 × 10⁻¹⁰ (SD = 0.32 × 10⁻¹⁰) mutations/base/year, which is statistically indistinguishable from palindromes mutation rate reported by Helgason et al. (32) (P = 0.12).
For the same samples, we also calculated the mutation rate of the spacer which resulted to be 9.16 × 10⁻¹⁰ (SD = 0.47 × 10⁻¹⁰) mutations/base/year. This rate is not significantly different (P = 0.4722, two rates test) from the P6 spacer average mutation rate (12.8 × 10⁻¹⁰ mutations/base/year) that we re-estimated from the data of Helgason et al. (32); on the other hand, interestingly, it is significantly higher than the mutation rate of the palindrome arms (P = 0.0169, two rates test). The observed discrepancy in the mutation rate between ‘pseudo-diploid’ and haploid regions of P6 may explain the lower divergence between the orthologous (human-chimpanzee) P6 arms when compared with the divergence of spacers, as previously observed (3).
Discussion
About one-quarter of the euchromatic portion of the human MSY consists of large near-identical duplicated sequences, which are organized in eight palindromes (1). These ‘pseudo-diploid’ structures are composed of two inverted arms separated by a single copy spacer. Importantly, palindromes are enriched in genes essential for sperm production and the high sequence identity between arms (exceeding 99.9%) is owing to the action of inter-paralog gene conversion (GC) (1,3,4,6,19). It has been proposed that Y-Y GC evolved to maintain the structural integrity of important genes in a genomic region showing no meiotic recombination (3). Moreover, it has been observed that gene conversion has an apparent bias toward the retention of the ancestral base, suggesting a role of this mechanism in preserving the nucleotide sequence of palindromic genes (4,5).
Although the relevance of gene conversion in the evolution of palindromes has been profoundly recognized (1,3,6,14,21,22,42, 43), the dynamic of this mechanism is still nuanced. More generally, the evolutionary dynamics of palindromic structures (arms and spacer) and the reason for their ubiquitous existence on sex haploid chromosomes have not been fully clarified yet.
To explore these aspects of gene conversion within palindromic elements, two points are essential: (1) the information about the phylogenetic relationships among palindromes in order to count the actual number of events occurred during a time frame and (2) an unbiased large amount of PSVs for the identification of gene conversion events. In this paper, by analyzing the genetic diversity of the X-degenerate unique region in several Y chromosomes, we obtained a robust phylogenetic tree. Subsequently, by performing a high-resolution NGS analysis in the same sample set, we carried out the first unbiased study on the genetic diversity of the largest MSY singleton palindrome, P6, revealing many more PSVs than those identified in previous studies (3–5). This increased our ability to understand the dynamics of the gene conversion events that occurred during the recent human history and to give a clearer picture of the evolution of this genomic element.
Although palindromic sequences can be involved in several structural variations (such as deletion of entire arms), in our sample set, we always find the ancestral status of two copies of P6 arms. A similar result has been previously observed by (41) which reported P6 as the only human palindrome showing the conservation of two arms in more than 1200 Y chromosomes belonging to several different haplogroups. Moreover, among human palindromes, P6 is the element exhibiting the strongest evolutionary conservation, with a sequence coverage ranging from ~89 to ~ 96% of other great ape Y assemblies (43). Indeed, despite the absence of protein-coding genes in this palindrome, evidence of elements regulating gene expression overlapping P6 arms have been recently reported (43). Therefore, the high conservation and the presence of functional sequences may suggest a possible strong action of natural selection in the evolution of this element.
Although many deletions involving the spacer of X chromosome palindromes have recently been found (Jackson EK et al. 2020. Large palindromes on the primate X chromosome are preserved by natural selection. bioRxiv. doi:https://doi.org/10.1101/2020.12.29.424738), we did not find any structural variations involving P6 spacer or the entire palindrome arms. Through the depth analysis of P6, we found a single ~1.4 kb ‘pseudo-homozygous’ deletion in two phylogenetically related samples (S105 and S106) belonging to A2-PN3 haplogroup. The most parsimonious explanation is that the deletion occurred along the branch joining the two samples (branch 9 in Fig. 1) through a possible intra-chromosomal homologous recombination between two 217-bp identical DRs on a single arm of the palindrome (Supplementary Material, Fig. S1) (generating a ‘pseudo-heterozygous’ deletion). In principle, the formation of a ‘pseudo-diploid’ deleted chromosome may be owing to two alternative mechanisms (Fig. 4): (1) the deletion could be copied on the other arm through a single gene conversion event, resulting in a ‘pseudo-homozygous’ deleted state or (2) after a DNA duplication event, the deletion may have been transferred on the other arm as a consequence of a double inter-chromatid crossover between paralogous sequences, which will result in the formation of a Y chromosome with two different sister chromatids, one without any deletions and the other with the deletion in a ‘pseudo-homozygous’ state (Fig. 4).
Figure 4 .

Proposed mechanisms for the formation of a ‘pseudo-homozygous’ deletion on palindrome P6 in A2-PN3 lineage. (A) Schematic representation of P6 palindrome on the human Y chromosome. Gray, Y chromosome; black, P6 palindrome arms; yellow, P6 spacer; red, the 217-bp DRs; light blue, the fragment involved in the deletion. (B) Pairing and homologous recombination between the two DRs on the proximal arm of P6. (C) Formation of a 1393 bp circular deleted fragment, including a DR and of a ‘pseudo-heterozygous’ deleted chromosome. (D) DNA duplication producing two identical ‘pseudo-heterozygous’ sister chromatids. (E) Model of a double crossing-over between sister chromatids. (F) The resolution of the double crossing-over produces both types of ‘pseudo-homozygous’ chromatids. (G) Single gene conversion event involving at least 1393 bp, occurring before DNA duplication. The proximal-to-distal gene conversion causes the transfer of the deleted fragment between palindrome arms. (H) Formation of a ‘pseudo-homozygous’ deleted chromosome.
Notably, the frequency of double inter-chromatid crossing-overs within palindrome arms has never been thoroughly investigated. However, it should be considered that single events are extremely rare since they result in aberrant isodicentric and acentric chromosomes with clinical consequences (44,45); thus, it is reasonable to assume that double crossovers are even rarer (46). Moreover, it is widely recognized that gene conversion in ampliconic region is able to transfer genetic information over lengths of up to 10 kb (4,47,48) and it has been found to be involved in the deletion/insertion of entire gene sequences (43,46). We therefore conclude that gene conversion is the eligible mechanism to explain the ‘pseudo-homozygous’ deletion in A2-PN3 chromosomes. In this view, differently from what has been supposed so far, gene conversion could not be a mechanism exclusively involved in maintaining the structural integrity of palindromic regions, but it can also act as an evolutionary force that is able to erode the genetic structure of the chromosome by irreversibly fixing the loss of genetic material from palindrome arms. The involvement of gene conversion in the onset of deletions shared between paralogous sequences on the Y has already been identified in immortalized cell lines (that are highly prone to mutation) (44); however, our results show that arm-to-arm gene conversion may cause deletions also in germline cells, leading to evolutionary consequences.
Because of the disproportion between very short sequenced reads (100–200 bp) and the length of palindrome arms, a crucial step in the targeted NGS analysis is represented by the read mapping of highly similar sequences. The most commonly used bioinformatic methods for the analysis of sequenced reads inadequately discriminate between regions with almost complete identity (39), and this mapping distortion tends to affect downstream analyses, including the detection of variants. As a consequence, the identification of true SNPs in highly similar gene-converted regions may be complex when performing short-read targeted NGS. The main problem occurs in case of a ‘pseudo-heterozygous’ reference; in the present study, we report some cases where the unsupervised SNP calling procedure failed in the correct detection of variants (Fig. 2). Importantly, the alignment of a ‘pseudo-homozygous’-converted sample against a ‘pseudo-heterozygous’ reference could result in the failure to identify the correct number of conversions.. In fact, the SNPs generated by the conversion event would not be identified (through automatic SNP calling) and the sample would be genotyped as ‘pseudo-heterozygous’ instead of ‘pseudo-homozygous’ (Fig. 2A). In light of this, a data analysis based on the evaluation of the read distribution over the paralogous sites combined with the comparison of read depth between highly similar sequences has been necessary to assess the actual number of mutations/conversions that occurred within palindrome arms.
By comparing orthologous (human-chimpanzee) elements, Rozen and colleagues (3) found an inter-species sequence divergence corresponding to 1.44% for P6 palindrome arms, which is significantly lower than the divergence between the spacers (~2.0%). The authors suggested that the observed discrepancy might have been owing to a tendency for gene conversion to revert mutations to their ancestral state, thus preserving the nucleotide sequence of paralogous elements, whereas the spacer was free to accumulate new mutations. In accordance with this hypothesis, Hallast and colleagues (4), through the analysis of 10 PSVs of the human P6 palindrome, found a weak significant excess of gene conversions toward the ancestral state.
Here, we identified a total of 118 new PSVs involved in 80 gene conversion events. By analyzing the direction of conversion, we found no evidence for a gene conversion bias (even after correcting for undetectable to-ancestral events), implying that this non-allelic recombination may actually work without a specific trend in P6 palindrome. In light of this finding, our observations contradict the hypothesis that Y-Y gene conversion is a molecular mechanism acquired to retain the ancestral state of palindromic sequences, rejecting the possibility that the gene conversion bias toward the ancestral state is a universal property of human MSY palindromes.
A preferential trend of Y-Y recombination emerged from the analysis of a bias toward the fixation of specific nucleotides. Generally, it has been observed that gene conversion could favor some variants over others (49). When a PSV exists, a conversion bias is to be expected when one paralog, bearing a particular variant state, is more prone to double-strand breaks. This process, known as biased gene conversion, tends to favor the paralog bearing the G (or C) variant as donor rather than the paralog with the A (or T) variant, which will act as an acceptor sequence. We found a significant excess of conversions fixing GC bases over AT which is in line with previous findings (4,5,50–53). This might be related to the possibility that a to-ancestral bias actually exists but can be masked by the GC bias acting through the fixation of G or C as derived bases of the conversion event. By testing the final number of GC-biased events, we found that the amount of derived conversions complies with the number of ancestral ones, confirming the absence of a directional bias and making the biased gene conversion the unique driving force of the gene conversion mechanism within P6 palindrome.
Based on these observations, we compared our results with those of Hallast et al. (4), focused on the analysis of the same human palindrome. As the authors speculate, it is likely that the weak bias toward the ancestral state they observed is actually owing to the GC-biased conversion (4). Indeed, of the 10 PSVs they analyzed, 5 had a G or C nucleotide as their ancestral state (4). Moreover, it is worth noting that, differently from us, Hallast et al. (4) analyzed PSVs mostly falling into interspersed repeated elements, which could interact through gene conversion with highly similar repeats present on both sex chromosomes and autosomes (54), further complicating the interpretation of the diversity pattern of Y-linked palindromes.
Recently, by the analysis of 2.7 Mb of the ampliconic region in 62 subjects covering a narrow portion of the Y chromosome diversity, Skov and colleagues (5) showed evidence for a gene conversion bias toward the ancestral state within the palindromic region as a whole. However, through a deeper analysis of their data, we noted that such bias emerges only for two (P1 and P5) out of all the MSY palindromes (Supplementary Material, Table S10) and is not observed in P6, maybe suggesting the existence of possible different conversion dynamics among human MSY palindromes.
By considering no Y-Y conversion bias toward the ancestral state, we propose that the lower divergence between arms with respect to the spacers in the human–chimpanzee comparison may simply be the consequence of different mutation rates between the two regions of P6. In this scenario, a higher spacer mutation rate compared with the arms could explain the lower orthologous diversity in the latter elements. Consistently, we found a significantly higher mutation rate for the spacer (9.16 × 10⁻¹⁰ mutations/base/year) with respect to palindrome arms (6.18 × 10⁻¹⁰ mutations/base/year) and a ratio between the two rates (9.16/6.18 = 1.48) that is very similar to the ratio of the observed orthologous nucleotide diversity (0.0200/0.0144 = 1.38).
The lower arm versus spacer mutation rate could be owing to the action of a conservative force, such as natural selection acting on the P6-arms functional elements (43). When a new variant arises in one arm, even if slightly harmful, it could escape the action of natural selection since its hypothetical function is governed by the unmodified base on the other arm of the palindrome. In this context, gene conversion may act toward the restoring of the ancestral state or, on the contrary, may operate by ‘fixing’ the derived state and leading to the establishment of a harmful variant on both arms of the palindrome so that purifying selection can act to eliminate such variant and counteract the steady accumulation of new deleterious mutations within a population. Thus, even if no ancestral/derived bias of conversion has been observed, Y-Y recombination may still have a role in the maintenance of inter-species sequence identity between arms.
By studying the mutational trend in palindrome P6, we found that the proportion of mutations toward A or T (W) bases within arms exceeds the proportion toward G or C (S) bases (Table 1). This is in line with the findings by Skov et al. (5), but we show that this excess of mutations toward W nucleotides is mainly owing to the hypermutable CpG dinucleotides (Table 1). However, it is important to note that there is an excess of mutations toward W bases in the spacer when compared with the arms (Table 1). This could simply reflect the effect of GC-biased gene conversion, which results in reducing the possibility to identify mutations toward A or T within the interacting paralogs.
By precisely knowing the evolutionary time of each branch of the Y tree and the distribution of the PSVs within the phylogeny, we obtained an observed Y-Y gene conversion rate of 6.01 × 10⁻⁶ conversions per base per year. Our rate is based on the average evolutionary lifetime of PSVs within the phylogeny (therefore, on the real possibility to observe or not a gene conversion event) (see Materials and Methods and Supplementary Material, Fig. S4); thus, it turns out to be more accurate than the estimates based on the entire time spanning the phylogeny (4,5). Our rate is about three times higher than a gene conversion rate previously calculated on a narrow portion of the same human palindrome (4). Importantly, it has been possible to estimate an expected gene conversion rate in P6 under the assumption of a dynamic equilibrium between mutation and gene conversion in maintaining an average level of divergence between arms (3). We obtained an expected conversion rate of 7.54 × 10⁻⁶ events per duplicated nucleotide per year, which is in line with the observed gene conversion rate we calculated independently. This may suggest the existence of a balance between these two forces in driving P6 arms evolution and that the arm-to-arm genetic diversity will be probably conserved over time. The existence of such a balance could be expected, given that P6 origin pre-dates human-chimpanzee separation, so it had a long lifetime to reach an equilibrium. However, unpublished data about the analysis of palindrome P8 (which originated before human-chimp separation) show the lack of a mutation/conversion equilibrium, suggesting that it is not a general feature of the palindromic structures (unpublished data).
To sum up, our results revise and expand previous research on human MSY palindromes (3,4,5) by describing the dynamics of mutation and conversion of P6 palindrome. Our analysis suggests that the evolution of the ampliconic region of human MSY should not be analyzed as a unique sequence but that each palindrome probably follows its own evolutionary path.
Materials and Methods
The sample
We performed targeted NGS of the P6 palindrome (arms and spacer) on 157 samples (Supplementary Material, Table S2) selected from our laboratory collection in order to maximize the haplogroup differentiation of the Y phylogeny. For exactly the same samples, the sequence of about 3.3 Mb of the unique X-degenerate region of the human Y chromosome was available (23,24). Samples were obtained from peripheral blood or buccal swab and DNA was extracted using appropriate procedures. Haplogroup affiliation is described in Supplementary Material, Table S2. This study was approved by the ‘Sapienza Università di Roma’ ethical committee (protocol numbers 1158/13 and 496/13) and by ‘University of Rome Tor Vergata’ (protocol number 164/14) who considered the list of collaborators, anonymity of samples and the compliance with consent regulations. All the procedures used in this study adhere to the tenets of the Declaration of Helsinki.
SNP calling of X-degenerate region
We performed a new SNP calling analysis of 3 328 701 bp of the X-degenerate region both in the 157 samples that were previously sequenced at a depth >50× (23,24), and in 4 radiocarbon-dated ancient samples (27–29), for a total of 161 Y chromosomes. The variant positions from the X-degenerate portion were extracted using the SAMtools platform (55,56) by comparing the sequence of all samples to the human Y chromosome reference sequence (Human Feb. 2009—GRCh37/hg19 assembly). In order to discard false-positive calls, we applied the same filtering criteria described in D'Atanasio et al. (23).
Phylogenetic tree reconstruction
The maximum parsimony tree was reconstructed by using the MEGA software (57) after generating a .meg input file. Since we could not univocally define how many mutations were private of the A00 chromosome or occurred at A0-T branch (both branches indicated as branch 1 in Fig. 1), the root of the tree was positioned at midpoint by default. The Network software (58) was used to produce a median joining network of the samples, submitting a .rdf file as input, and to obtain the list of mutations for each branch and the positions of recurrent ones.
Mutation rate of the X-degenerate region and tree dating
The mutation rate for the X-degenerate portion here analyzed was estimated by means of BEAST software (59). The input was a NEXUS (.nex) file containing a list of the variable positions for all the 161 subjects and the structure of the maximum parsimony tree in the newick format. The input was loaded onto BEAUTY suite, assigning to the four ancient specimens the calibrated radiocarbon dates in years before present. We used a general time-reversible (GTR) nucleotide substitution model under a strict clock and an expansion growth model for the population size by using the same parameters of Trombetta et al. (60). The output was checked on the Tree Annotator and Tracer platforms.
The average elapsed time for each mutation (tm) has been calculated with the following formula:
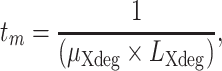 |
where  is the mutation rate of the sequenced X-degenerate region and
  is the total number of sequenced bp.
DNA quality control
Target sequencing of the selected palindromic regions required specific quality and quantity parameters for the DNA to be analyzed: (1) absence or low amount of DNA degradation, (2) quantity ≥3 μg, (3) concentration ≥37.5 ng/μl and (4) purity, A260/280 = 1.8–2.0. Concentration and purity were measured using a NanoDrop 1000 spectrophotometer (Thermo Fisher Scientific Carlsbad, California, US). Degradation was assessed by means of an electrophoretic run on a 1% agarose gel.
Selection of palindromic regions to be sequenced
The structure of palindromic regions is quite complex. P1 palindrome hosts two smaller inverted repeats (palindromes P1.1 and P1.2), each 24 kb in length, and its central part is nearly identical to the adjacent P2 palindrome. Other extensive portions of the P1 palindrome are homologous to P3, P4 and P5 as well as to other non-palindromic sequences. So the only ‘singleton’ palindromes, being characterized by a single repeat unit for each arm, are P6, P7 and P8 (1,25,26).
We decide to analyze P6, since it is the largest singleton palindrome of the human MSY, for a total of 266 kb (~220 kb of the arms and ~46 kb of the spacer). The total number of bases selected for the sequencing decreased to ~89 kb/sample (~70 kb of the arms and ~19 kb of the spacer) after discarding the interspersed repeated elements (Supplementary Material, Table S6). For these selection steps, we used the ‘Table browser’ tool of the UCSC Genome browser, considering the aligned annotation tracks for the human February 2009 (GRCh37/hg19) assembly.
Targeted NGS
The DNA samples were analyzed by the BGI-Tech (Hong Kong), which performed the library preparation, targeting, sequencing and alignment steps. The targeted P6 portions were enriched using a Roche Nimblegen capture array, which was composed of 200 bp probes which overlapped the selected regions. The captured regions were loaded onto an Illumina Hi-Seq 2500 platform to produce ≥50× mean depth sequences. The raw output was refined discarding low-quality reads and contaminations with adapters. The sequences of each subject were aligned to the human reference genome (Human Feb. 2009—GRCh37/hg19 assembly) by means of the Burrows-Wheeler Aligner (BWA) software (55) producing an alignment file.bam format (61).
In the present study was performed a target enrichment of haploid regions, for which a sequencing depth (DP) equal to N is expected. However, owing to the duplicated nature of palindrome arms, each read maps at the two different paralogous positions of P6 palindrome, resulting in a DP = 2N, whereas a precise mapping for the sequenced reads of the spacer has been obtained (DP = N). The data underlying this article are incorporated into the online supplementary material. The alignment .bam files of palindrome P6 for the 157 Y chromosomes analyzed here have been deposited in the European Nucleotide Archive (https://www.ebi.ac.uk/ena/browser/home) under the study accession number PRJEB44535. The alignment .bam files of the X-degenerate region of the same 157 chromosomes are available through the European Nucleotide Archive under the accession number PRJEB24071 (from S101 to S210) and PRJEB25861 (from S300 to S353).
Analysis of the sequencing depth
To identify possible deletions/duplications within P6, we performed an in silico depth analysis through the extraction of DP values from each sequenced position by means of SAMtools platform (56,61). For each sample, we standardized the DP values with the average depth of the ~3.3 Mb of non-repetitive regions of the MSY. Then, for the palindromic region, we calculated the EMA for 100 bp sliding windows and 1 bp moving by using the ‘TTR’ package in the R software. Since we expected to observe standardized EMA values ~2 within ‘pseudo-diploid’ arms (or e.g. ~1 within the haploid spacer), we specifically selected blocks of sequences with average EMA values <1.5 and >2.5 to detect putative deletions and duplications, respectively. These blocks were subsequently inspected with the Integrative Genome Viewer (IGVtools) and were validated by Sanger sequencing.
Variant calling and filtering
We identified the variant positions within P6 palindrome by using the mpileup command in SAMtools (56,61). The output was a Variant Call Format (VCF) file for each sample, from which we removed the indels.
Within the duplicated arms, to discard false-positive variants and to assess the genotype of true variants, we applied the criteria listed in Supplementary Material, Table S11, set on the basis of the ‘pseudo-diploid’ features of palindromic regions. These parameters took into account the total number of reads covering each position (DP), the number of reads calling the alternative base (DPALT) and the number of reads showing the reference base (DPREF). Considering the ‘pseudo-diploid’ nature of palindrome arms, we discarded all variants with a DP ≥ 2 and a DPALT ≤ 2. After this first filtering step, we discarded the variants showing DPALT/DPREF < 0.1.
Finally, to refine the list of true variants, we defined the new PD parameter (Supplementary Material, Table S11):
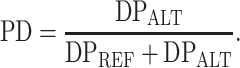 |
We directly eliminated variant positions with PD value < 0.1, since they probably represent false-positive calls. We retained all positions with PD value ≥0.9 and assigned them an alternative ‘pseudo-homozygous’ genotype. All the positions showing PD ≥ 0.4 and PD ≤ 0.6 have been considered ‘pseudo-heterozygous’ since these variants show about half of calls as ‘alternative’ and about half of them as ‘reference’. The variant sites exhibiting values out of the ranges indicated before (Supplementary Material, Table S11) have been considered as variants to be validated by Sanger sequencing.
The final set of ‘pseudo-diploid’ variants that passed the filtering criteria were then manually checked in the alignment .bam file of the samples of interest using IGV. In the final decision, we considered several criteria, such as the phylogenetic context, the depth and the quality of the examined region. We also retained the clustered variants since the presence of clusters of mutation, occurring at closely spaced positions, may be indicative of a common origin through the same recombinational event, such as the gene conversion. Owing to the haploid nature of the P6 spacer, the filtering criteria used for the variants called in this portion are the same adopted for the X-degenerate region.
Validation of variants
We validated the genetic status of the variant positions showing intermediate PD values by means of PCRs and Sanger sequencing. All markers have been amplified following a standard protocol of touchdown PCR. The amplification reaction was performed starting from 50/100 ng of genomic DNA. The 20-mer primers selected for both amplification and sequencing have been designed to specifically amplify the Y chromosome referring to the GRCh37/hg19 human genome sequence and using Primer3 v. 0.4.0. software. The specific Y chromosome amplification was confirmed by an in silico PCR with the UCSC Genome Browser tool, which returned two amplicons for palindrome arms and one for the spacer. The purification of the PCR products and the sequencing reaction were carried out at Eurofins srl in Milan (http://www.eurofins.it) or at Bio-Fab Research srl in Rome (http://www.biofabresearch.it). Fluorescent sequencing reactions were performed and run on an automatic Applied Biosystems 3730xl DNA Analyzer using 20-mer internal oligonucleotides as sequencing primers. The sequences obtained were aligned and compared with Sequencher v. 4.8 (Gene Codes Corporation) in order to establish the allelic variants. The primer list for sequencing and amplification is available upon request.
Detection of PSVs and Y-Y gene conversion events
Gene conversion changes the state of a ‘pseudo-diploid’ genotype from heterozygous to homozygous. So, the detection of a gene conversion event strongly depends on the possibility to observe PSVs within the examined sequences, which designate ‘pseudo-heterozygous’ states. Generally, PSVs have been generated by a single mutational event on the proximal or on the distal arm of the palindrome. Thus, the possibility to find a gene conversion event does not depend on the arm where the mutation occurred. Although different scenarios explaining the observed genetic diversity are possible, here, we based on the maximum parsimony principle to infer occurred events. The minimum number of mutations (generating new PSVs) and gene conversion events is given by mapping each event within the phylogeny, according to the following criteria:
—When we observed a single chromosome showing a PSV, we considered it as the result of a single mutational event occurring on a palindrome arm of that chromosome. The observation of a phylogenetic cluster of chromosomes showing the same PSV indicates that the mutational event generating such PSV occurred at the branch joining all the interested chromosomes (Supplementary Material, Fig. S3A). On the contrary, the same PSV shared between ≥2 phylogenetically unrelated chromosomes has been considered as generated by different mutational events occurred at different branches. We inferred the ancestral/derived state of PSVs according to their phylogenetic distribution. This method is not applicable for some PSVs (e.g. those generated by mutations occurring on the basal branches of the phylogeny, such as V539, as shown in Supplementary Material, Fig. S2). For these elements, the ancestral state has been determined by the observation of the orthologous base on the chimpanzee (Clint_PTRv2/panTro6).
—The observation of ‘pseudo-homozygous’ chromosomes descending from the branch where the PSV arose is indicative that a gene conversion event (Supplementary Material, Fig. S3B) (or more than one—Supplementary Material, Fig. S3C) has occurred. In order to investigate the direction of the conversion events (ancestral to derived or vice versa), we used the ancestral/derived state information of the PSV.
—The observation in the phylogeny of exclusively ‘pseudo-homozygous’ chromosomes showing different genotypes (see e.g. V567 in Supplementary Material, Fig. S2) suggests that a mutational event generating a PSV and a subsequent gene conversion toward the derived state have occurred on the same branch of the phylogeny in a close time frame (Supplementary Material, Fig. S3D).
P6 gene conversion rate
By knowing both the number of mutations that occurred on each branch of the phylogeny and the average elapsed time for the occurrence of a mutational event (406.6 years/mutation), we could estimate the lifetime of each branch of the tree by multiplying the number of mutations associated with that specific branch by the average time of one event.
We calculated a P6-specific gene conversion rate (c) according to the following equation:
 |
where C is the number of the independent gene conversion events observed along the phylogeny which occurred within the ith PSV and n is the total number of PSVs identified within P6. To the denominator, t is the time of persistence of a single PSV within the phylogeny, calculated as the sum of the times of all the branches (internal and terminal ones) in which the PSV is present. This calculation is an estimate of the time in which a gene conversion event could be observed for each PSV. We calculated a minimum and a maximum time which resulted in a maximum and a minimum gene conversion rate, respectively (Supplementary Material, Fig. S4). To calculate the maximum time (and a minimum rate of conversion), we included all the branches carrying the PSV and the branch(es) where the gene conversion event(s) occurred. For the estimate of the minimum time (and a maximum rate of conversion), we excluded the exact branch(es) where the PSV arose and where the gene conversion event(s) occurred. The average value of gene conversion rate is obtained by averaging the two estimated times (Supplementary Material, Fig. S4).
The conversion rate (c) assuming the mutation/conversion steady-state balance has been calculated using the method of Rozen et al. (3), as follows:
 |
where μ is the specific mutation rate of P6 arms and d is the observed divergence between palindrome arms calculated as the average arm-to-arm nucleotide diversity of the 157 sequenced chromosomes.
P6 mutation rate
We calculated the mutation rate of both spacer and arms of the P6 palindrome using the following formula:
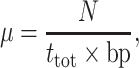 |
where N is the total number of mutational events, ttot is the time that encompasses the entire phylogeny and bp is the length of the sequenced region.
Supplementary Material
Acknowledgements
The authors are grateful to all the anonymous donors for providing DNA samples and to the people who contributed to the sample collection.
Conflict of interest statement. None declared.
Contributor Information
Maria Bonito, Department of Biology and Biotechnology ‘Charles Darwin’, Sapienza University of Rome, Laboratory affiliated to Istituto Pasteur Italia-Fondazione Cenci Bolognetti, Rome 0185, Italy.
Eugenia D’Atanasio, Institute of Molecular Biology and Pathology (IBPM), CNR, Rome 0185, Italy.
Francesco Ravasini, Department of Biology and Biotechnology ‘Charles Darwin’, Sapienza University of Rome, Laboratory affiliated to Istituto Pasteur Italia-Fondazione Cenci Bolognetti, Rome 0185, Italy.
Selene Cariati, Department of Biology and Biotechnology ‘Charles Darwin’, Sapienza University of Rome, Laboratory affiliated to Istituto Pasteur Italia-Fondazione Cenci Bolognetti, Rome 0185, Italy.
Andrea Finocchio, Department of Biology, University of Rome Tor Vergata, Rome 0133, Italy.
Andrea Novelletto, Department of Biology, University of Rome Tor Vergata, Rome 0133, Italy.
Beniamino Trombetta, Department of Biology and Biotechnology ‘Charles Darwin’, Sapienza University of Rome, Laboratory affiliated to Istituto Pasteur Italia-Fondazione Cenci Bolognetti, Rome 0185, Italy.
Fulvio Cruciani, Department of Biology and Biotechnology ‘Charles Darwin’, Sapienza University of Rome, Laboratory affiliated to Istituto Pasteur Italia-Fondazione Cenci Bolognetti, Rome 0185, Italy; Institute of Molecular Biology and Pathology (IBPM), CNR, Rome 0185, Italy.
Funding
This work was supported by Istituto Pasteur Fondazione Cenci Bolognetti, Programmi di Ricerca 2018-2020 to F.C. (grant number 60) and Sapienza Università di Roma, Progetti per Avvio alla Ricerca - Tipo 1 to E. D’A. (grant number AR116154C4529590).
References
- 1. Skaletsky, H., Kuroda-Kawaguchi, T., Minx, P.J., Cordum, H.S., Hillier, L., Brown, L.G., Repping, S., Pyntikova, T., Ali, J., Bieri, T.et al. (2003) The male-specific region of the human Y chromosome is a mosaic of discrete sequence classes. Nature, 423, 825–837. [DOI] [PubMed] [Google Scholar]
- 2. Ross, M.T., Grafham, D.V., Coffey, A.J., Scherer, S., McLay, K., Muzny, D., Platzer, M., Howell, G.R., Burrows, C., Bird, C.P.et al. (2005) The DNA sequence of the human X chromosome. Nature, 434, 325–337. [DOI] [PMC free article] [PubMed] [Google Scholar]
- 3. Rozen, S., Skaletsky, H., Marszalek, J.D., Minx, P.J., Cordum, H.S., Waterston, R.H., Wilson, R.K. and Page, D.C. (2003) Abundant gene conversion between arms of palindromes in human and ape Y chromosomes. Nature, 423, 873–876. [DOI] [PubMed] [Google Scholar]
- 4. Hallast, P., Balaresque, P., Bowden, G.R., Ballereau, S. and Jobling, M.A. (2013) Recombination dynamics of a human Y-chromosomal palindrome: rapid GC-biased gene conversion, multi-kilobase conversion tracts, and rare inversions. PLoS Genet., 9, e1003666. [DOI] [PMC free article] [PubMed] [Google Scholar]
- 5. Skov, L., The Danish Pan Genome Consortium and Schierup, M.H. (2017) Analysis of 62 hybrid assembled human Y chromosomes exposes rapid structural changes and high rates of gene conversion. PLoS Genet., 13, e1006834. [DOI] [PMC free article] [PubMed] [Google Scholar]
- 6. Trombetta, B. and Cruciani, F. (2017) Y chromosome palindromes and gene conversion. Hum. Genet., 136, 605–619. [DOI] [PubMed] [Google Scholar]
- 7. Ezawa, K., OOta, S. and Saitou, N. (2006) Genome-wide search of gene conversions in duplicated genes of mouse and rat. Mol. Biol. Evol., 23, 927–940. [DOI] [PubMed] [Google Scholar]
- 8. Davis, J.K., Thomas, P.J., Comparative Sequencing Program, N.I.S.C. and Thomas, J.W. (2010) A W-linked palindrome and gene conversion in New World sparrows and blackbirds. Chromosom. Res., 18, 543–553. [DOI] [PMC free article] [PubMed] [Google Scholar]
- 9. Méndez-Lago, M., Bergman, C.M., dePablos, B., Tracey, A., Whitehead, S.L. and Villasante, A. (2011) A large palindrome with interchromosomal gene duplications in the pericentromeric region of the D. melanogaster Y chromosome. Mol. Biol. Evol., 28, 1967–1971. [DOI] [PMC free article] [PubMed] [Google Scholar]
- 10. Soh, Y.Q., Alföldi, J., Pyntikova, T., Brown, L.G., Graves, T., Minx, P.J., Fulton, R.S., Kremitzki, C., Koutseva, N., Mueller, J.L.et al. (2014) Sequencing the mouse Y chromosome reveals convergent gene acquisition and amplification on both sex chromosomes. Cell, 159, 800–813. [DOI] [PMC free article] [PubMed] [Google Scholar]
- 11. Skinner, B.M., Sargent, C.A., Churcher, C., Hunt, T., Herrero, J., Loveland, J.E., Dunn, M., Louzada, S., Fu, B., Chow, W.et al. (2016) The pig X and Y chromosomes: structure, sequence, and evolution. Genome Res., 26, 130–139. [DOI] [PMC free article] [PubMed] [Google Scholar]
- 12. Tomaszkiewicz, M., Rangavittal, S., Cechova, M., Campos Sanchez, R., Fescemyer, H.W., Harris, R., Ye, D., O'Brien, P.C., Chikhi, R., Ryder, O.A.et al. (2016) A time- and cost-effective strategy to sequence mammalian Y chromosomes: an application to the de novo assembly of gorilla Y. Genome Res., 26, 530–540. [DOI] [PMC free article] [PubMed] [Google Scholar]
- 13. Shi, W., Massaia, A., Louzada, S., Handsaker, J., Chow, W., McCarthy, S., Collins, J., Hallast, P., Howe, K., Church, D.M.et al. (2019) Birth, expansion, and death of VCY-containing palindromes on the human Y chromosome. Genome Biol., 20, 207. [DOI] [PMC free article] [PubMed] [Google Scholar]
- 14. Swanepoel, C.M., Gerlinger, E.R. and Mueller, J.L. (2020) Large X-linked palindromes undergo arm-to-arm gene conversion across Mus lineages. Mol. Biol. Evol., 37, 1979–1985. [DOI] [PMC free article] [PubMed] [Google Scholar]
- 15. Zhou, R., Macaya-Sanz, D., Carlson, C.H., Schmutz, J., Jenkins, J.W., Kudrna, D., Sharma, A., Sandor, L., Shu, S., Barry, K.et al. (2020) A willow sex chromosome reveals convergent evolution of complex palindromic repeats. Genome Biol., 21, 38. [DOI] [PMC free article] [PubMed] [Google Scholar]
- 16. Warburton, P.E., Giordano, J., Cheung, F., Gelfand, Y. and Benson, G. (2004) Inverted repeat structure of the human genome: the X-chromosome contains a preponderance of large, highly homologous inverted repeats that contain testes genes. Genome Res., 14, 1861–1869. [DOI] [PMC free article] [PubMed] [Google Scholar]
- 17. Mueller, J.L., Mahadevaiah, S.K., Park, P.J., Warburton, P.E., Page, D.C. and Turner, J.M.A. (2008) The mouse X chromosome is enriched for multicopy testis genes showing postmeiotic expression. Nat. Genet., 40, 794–799. [DOI] [PMC free article] [PubMed] [Google Scholar]
- 18. Mueller, J.L., Skaletsky, H., Brown, L.G., Zaghlul, S., Rock, S., Graves, T., Auger, K., Warren, W.C., Wilson, R.K. and Page, D.C. (2013) Independent specialization of the human and mouse X chromosomes for the male germ line. Nat. Genet., 45, 1083–1087. [DOI] [PMC free article] [PubMed] [Google Scholar]
- 19. Charlesworth, B. (2003) The organization and evolution of the human Y chromosome. Genome Biol., 4, 226–226. [DOI] [PMC free article] [PubMed] [Google Scholar]
- 20. Connallon, T. and Clark, A.G. (2010) Gene duplication, gene conversion and the evolution of the Y chromosome. Genetics, 186, 277–286. [DOI] [PMC free article] [PubMed] [Google Scholar]
- 21. Marais, G.A.B., Campos, P.R.A. and Gordo, I. (2010) Can intra-Y gene conversion oppose the degeneration of the human Y chromosome? A simulation study. Genome Biol. Evol., 2, 347–357. [DOI] [PMC free article] [PubMed] [Google Scholar]
- 22. Betrán, E., Demuth, J.P. and Williford, A. (2012) Why chromosome palindromes? Int. J. Evol. Biol., 2012, 1–14. [DOI] [PMC free article] [PubMed] [Google Scholar]
- 23. D'Atanasio, E., Trombetta, B., Bonito, M., Finocchio, A., Di Vito, G., Seghizzi, M., Romano, R., Russo, G., Paganotti, G.M., Watson, E.et al. (2018) The peopling of the last Green Sahara revealed by high-coverage resequencing of trans-Saharan patrilineages. Genome Biol., 19, 20. [DOI] [PMC free article] [PubMed] [Google Scholar]
- 24. Finocchio, A., Trombetta, B., Messina, F., D’Atanasio, E., Akar, N., Loutradis, A., Michalodimitrakis, E.I., Cruciani, F. and Novelletto, A. (2018) A finely resolved phylogeny of Y chromosome Hg J illuminates the processes of Phoenician and Greek colonizations in the Mediterranean. Sci. Rep., 8, 7465–7465. [DOI] [PMC free article] [PubMed] [Google Scholar]
- 25. Kuroda-Kawaguchi, T., Skaletsky, H., Brown, L.G., Minx, P.J., Cordum, H.S., Waterston, R.H., Wilson, R.K., Silber, S., Oates, R., Rozen, S.et al. (2001) The AZFc region of the Y chromosome features massive palindromes and uniform recurrent deletions in infertile men. Nat. Genet., 29, 279–286. [DOI] [PubMed] [Google Scholar]
- 26. Costa, P., Gonçalves, R., Ferrás, C., Fernandes, S., Fernandes, A.T., Sousa, M. and Barros, A. (2008) Identification of new breakpoints in AZFb and AZFc. Mol. Hum. Reprod., 14, 251–258. [DOI] [PubMed] [Google Scholar]
- 27. Fu, Q., Li, H., Moorjani, P., Jay, F., Slepchenko, S.M., Bondarev, A.A., Johnson, P.L., Aximu-Petri, A., Prüfer, K., deFilippo, C.et al. (2014) Genome sequence of a 45,000-year-old modern human from western Siberia. Nature, 514, 445–449. [DOI] [PMC free article] [PubMed] [Google Scholar]
- 28. Lazaridis, I., Patterson, N., Mittnik, A., Renaud, G., Mallick, S., Kirsanow, K., Sudmant, P.H., Schraiber, J.G., Castellano, S., Lipson, M.et al. (2014) Ancient human genomes suggest three ancestral populations for present-day Europeans. Nature, 513, 409–413. [DOI] [PMC free article] [PubMed] [Google Scholar]
- 29. Jones, E.R., Gonzalez-Fortes, G., Connell, S., Siska, V., Eriksson, A., Martiniano, R., McLaughlin, R.L., Gallego Llorente, M., Cassidy, L.M., Gamba, C.et al. (2015) Upper Palaeolithic genomes reveal deep roots of modern Eurasians. Nat. Commun., 6, 8912. [DOI] [PMC free article] [PubMed] [Google Scholar]
- 30. Scozzari, R., Massaia, A., Trombetta, B., Bellusci, G., Myres, N.M., Novelletto, A. and Cruciani, F. (2014) An unbiased resource of novel SNP markers provides a new chronology for the human Y chromosome and reveals a deep phylogenetic structure in Africa. Genome Res., 24, 535–544. [DOI] [PMC free article] [PubMed] [Google Scholar]
- 31. Trombetta, B., D'Atanasio, E., Massaia, A., Myres, N.M., Scozzari, R., Cruciani, F. and Novelletto, A. (2015) Regional differences in the accumulation of SNPs on the male-specific portion of the human Y chromosome replicate autosomal patterns: implications for genetic dating. PLoS One, 10, e0134646. [DOI] [PMC free article] [PubMed] [Google Scholar]
- 32. Helgason, A., Einarsson, A.W., Guðmundsdóttir, V.B., Sigurðsson, Á., Gunnarsdóttir, E.D., Jagadeesan, A., Ebenesersdóttir, S.S., Kong, A. and Stefánsson, K. (2015) The Y-chromosome point mutation rate in humans. Nat. Genet., 47, 453–457. [DOI] [PubMed] [Google Scholar]
- 33. Cruciani, F., Trombetta, B., Massaia, A., Destro-Bisol, G., Sellitto, D. and Scozzari, R. (2011) A revised root for the human Y chromosomal phylogenetic tree: the origin of patrilineal diversity in Africa. Am. J. Hum. Genet., 88, 814–818. [DOI] [PMC free article] [PubMed] [Google Scholar]
- 34. Scozzari, R., Massaia, A., D’Atanasio, E., Myres, N.M., Perego, U.A., Trombetta, B. and Cruciani, F. (2012) Molecular dissection of the basal clades in the human Y chromosome phylogenetic tree. PLoS One, 7, e49170. [DOI] [PMC free article] [PubMed] [Google Scholar]
- 35. Mendez, F.L., Krahn, T., Schrack, B., Krahn, A.M., Veeramah, K.R., Woerner, A.E., Fomine, F.L., Bradman, N., Thomas, M.G., Karafet, T.M.et al. (2013) An African American paternal lineage adds an extremely ancient root to the human Y chromosome phylogenetic tree. Am. J. Hum. Genet., 92, 454–459. [DOI] [PMC free article] [PubMed] [Google Scholar]
- 36. Hallast, P., Batini, C., Zadik, D., Maisano Delser, P., Wetton, J.H., Arroyo-Pardo, E., Cavalleri, G.L., deKnijff, P., Destro Bisol, G., Dupuy, B.M.et al. (2015) The Y-chromosome tree bursts into leaf: 13,000 high-confidence SNPs covering the majority of known clades. Mol. Biol. Evol., 32, 661–673. [DOI] [PMC free article] [PubMed] [Google Scholar]
- 37. Karmin, M., Saag, L., Vicente, M., Wilson Sayres, M.A., Järve, M., Talas, U.G., Rootsi, S., Ilumäe, A.M., Mägi, R., Mitt, M.et al. (2015) A recent bottleneck of Y chromosome diversity coincides with a global change in culture. Genome Res., 25, 459–466. [DOI] [PMC free article] [PubMed] [Google Scholar]
- 38. Poznik, G.D., Xue, Y., Mendez, F.L., Willems, T.F., Massaia, A., Wilson Sayres, M.A., Ayub, Q., McCarthy, S.A., Narechania, A., Kashin, S.et al. (2016) Punctuated bursts in human male demography inferred from 1,244 worldwide Y-chromosome sequences. Nat. Genet., 48, 593–599. [DOI] [PMC free article] [PubMed] [Google Scholar]
- 39. Li, W. and Freudenberg, J. (2014) Mappability and read length. Front. Genet., 5, 381–381. [DOI] [PMC free article] [PubMed] [Google Scholar]
- 40. Massaia, A. and Xue, Y. (2017) Human Y chromosome copy number variation in the next generation sequencing era and beyond. Hum. Genet., 136, 591–603. [DOI] [PMC free article] [PubMed] [Google Scholar]
- 41. Teitz, L.S., Pyntikova, T., Skaletsky, H. and Page, D.C. (2018) Selection has countered high mutability to preserve the ancestral copy number of Y chromosome amplicons in diverse human lineages. Am. J. Hum. Genet., 103, 261–275. [DOI] [PMC free article] [PubMed] [Google Scholar]
- 42. Fawcett, J.A. and Innan, H. (2011) Neutral and non-neutral evolution of duplicated genes with gene conversion. Genes (Basel), 2, 191–209. [DOI] [PMC free article] [PubMed] [Google Scholar]
- 43. Cechova, M., Vegesna, R., Tomaszkiewicz, M., Harris, R.S., Chen, D., Rangavittal, S., Medvedev, P. and Makova, K.D. (2020) Dynamic evolution of great ape Y chromosomes. Proc. Natl. Acad. Sci. U. S. A., 117, 26273–26280. [DOI] [PMC free article] [PubMed] [Google Scholar]
- 44. Lange, J., Skaletsky, H., vanDaalen, S.K.M., Embry, S.L., Korver, C.M., Brown, L.G., Oates, R.D., Silber, S., Repping, S. and Page, D.C. (2009) Isodicentric Y chromosomes and sex disorders as byproducts of homologous recombination that maintains palindromes. Cell, 138, 855–869. [DOI] [PMC free article] [PubMed] [Google Scholar]
- 45. Lange, J., Noordam, M.J., vanDaalen, S.K.M., Skaletsky, H., Clark, B.A., Macville, M.V., Page, D.C. and Repping, S. (2013) Intrachromosomal homologous recombination between inverted amplicons on opposing Y-chromosome arms. Genomics, 102, 257–264. [DOI] [PMC free article] [PubMed] [Google Scholar]
- 46. Shi, W., Massaia, A., Louzada, S., Banerjee, R., Hallast, P., Chen, Y., Bergström, A., Gu, Y., Leonard, S., Quail, M.A.et al. (2018) Copy number variation arising from gene conversion on the human Y chromosome. Hum. Genet., 137, 73–83. [DOI] [PubMed] [Google Scholar]
- 47. Bosch, E., Hurles, M.E., Navarro, A. and Jobling, M.A. (2004) Dynamics of a human interparalog gene conversion hotspot. Genome Res., 14, 835–844. [DOI] [PMC free article] [PubMed] [Google Scholar]
- 48. Hurles, M.E., Willey, D., Matthews, L. and Hussain, S.S. (2004) Origins of chromosomal rearrangement hotspots in the human genome: evidence from the AZFa deletion hotspots. Genome Biol., 5, R55. [DOI] [PMC free article] [PubMed] [Google Scholar]
- 49. Marais, G. (2003) Biased gene conversion: implications for genome and sex evolution. Trends Genet., 19, 330–338. [DOI] [PubMed] [Google Scholar]
- 50. Galtier, N. (2003) Gene conversion drives GC content evolution in mammalian histones. Trends Genet., 19, 65–68. [DOI] [PubMed] [Google Scholar]
- 51. Kudla, G., Helwak, A. and Lipinski, L. (2004) Gene conversion and GC-content evolution in mammalian Hsp70. Mol. Biol. Evol., 21, 1438–1444. [DOI] [PubMed] [Google Scholar]
- 52. Duret, L. and Galtier, N. (2009) Biased gene conversion and the evolution of mammalian genomic landscapes. Annu. Rev. Genomics Hum. Genet., 10, 285–311. [DOI] [PubMed] [Google Scholar]
- 53. Lartillot, N. (2013) Phylogenetic patterns of GC-biased gene conversion in placental mammals and the evolutionary dynamics of recombination landscapes. Mol. Biol. Evol., 30, 489–502. [DOI] [PubMed] [Google Scholar]
- 54. Trombetta, B., Fantini, G., D’Atanasio, E., Sellitto, D. and Cruciani, F. (2016) Evidence of extensive non-allelic gene conversion among LTR elements in the human genome. Sci. Rep., 6, 28710–28710. [DOI] [PMC free article] [PubMed] [Google Scholar]
- 55. Li, H. and Durbin, R. (2009) Fast and accurate short read alignment with Burrows–Wheeler transform. Bioinformatics, 25, 1754–1760. [DOI] [PMC free article] [PubMed] [Google Scholar]
- 56. Li, H. (2011) A statistical framework for SNP calling, mutation discovery, association mapping and population genetical parameter estimation from sequencing data. Bioinformatics, 27, 2987–2993. [DOI] [PMC free article] [PubMed] [Google Scholar]
- 57. Tamura, K., Peterson, D., Peterson, N., Stecher, G., Nei, M. and Kumar, S. (2011) MEGA5: molecular evolutionary genetics analysis using maximum likelihood, evolutionary distance, and maximum parsimony methods. Mol. Biol. Evol., 28, 2731–2739. [DOI] [PMC free article] [PubMed] [Google Scholar]
- 58. Bandelt, H.J., Forster, P. and Röhl, A. (1999) Median-joining networks for inferring intraspecific phylogenies. Mol. Biol. Evol., 16, 37–48. [DOI] [PubMed] [Google Scholar]
- 59. Drummond, A.J. and Rambaut, A. (2007) BEAST: Bayesian evolutionary analysis by sampling trees. BMC Evol. Biol., 7, 214. [DOI] [PMC free article] [PubMed] [Google Scholar]
- 60. Trombetta, B., D'Atanasio, E., Massaia, A., Ippoliti, M., Coppa, A., Candilio, F., Coia, V., Russo, G., Dugoujon, J.M., Moral, P.et al. (2015) Phylogeographic refinement and large scale genotyping of human Y chromosome haplogroup E provide new insights into the dispersal of early pastoralists in the African Continent. Genome Biol. Evol., 7, 1940–1950. [DOI] [PMC free article] [PubMed] [Google Scholar]
- 61. Li, H., Handsaker, B., Wysoker, A., Fennell, T., Ruan, J., Homer, N., Marth, G., Abecasis, G., Durbin, R. and 1000 Genome Project Data Processing Subgroup (2009) The sequence alignment/map format and SAMtools. Bioinformatics, 25, 2078–2079. [DOI] [PMC free article] [PubMed] [Google Scholar]
Associated Data
This section collects any data citations, data availability statements, or supplementary materials included in this article.