Abstract
T cell exhaustion is an induced state of dysfunction that arises in response to chronic infection and cancer. Exhausted CD8+ T cells acquire a distinct epigenetic state, but it is not known whether that chromatin landscape is fixed or plastic following resolution of chronic infection. Here, we show that the epigenetic state of exhaustion is largely irreversible, even after curative therapy. Analysis of chromatin accessibility in HCV and HIV-specific responses identifies a core epigenetic program of exhaustion in CD8+ T cells which undergoes only limited remodeling before and after resolution of infection. Moreover, canonical features of exhaustion, including super-enhancers near the genes TOX and HIF1A, remain “epigenetically scarred”. T cell exhaustion, therefore, is a conserved epigenetic state that becomes fixed and persists independent of chronic antigen stimulation and inflammation. Therapeutic efforts to reverse T cell exhaustion may require new approaches that increase the epigenetic plasticity of exhausted T cells.
Introduction
CD8+ T cell exhaustion is a hallmark of chronic viral infection and cancer1. In mouse models of chronic viral infection, exhausted T cells acquire varied functional deficits along with a distinct transcriptional and epigenetic state2–4. However, whether similar epigenetic changes underlie T cell dysfunction in human chronic infection, as well as the ultimate differentiation of these T cells after curative therapy, remains unknown.
T cell exhaustion has been extensively studied in mice using strains of the Lymphocytic Choriomeningitis Virus (LCMV), and is characterized by expression of co-inhibitory receptors, low effector cytokine production, and poor viral control5–8. Similar deficits are observed in human T cells responding to chronic viral infections including Human Immunodeficiency Virus (HIV) and Hepatitis C Virus (HCV)9–13. Only 20–30% of HCV infections resolve spontaneously due to a variety of viral mechanisms for immune evasion, including viral escape14. Importantly, viral escape from CD8+ T cell responses through mutation of recognized HCV epitopes happens early in disease progression13,15–17. Nevertheless, HCV infection becomes chronic in most cases and ultimately induces CD8+ T cell exhaustion within the HCV-specific T cells.
Recently developed direct-acting antiviral (DAA) therapies have been strikingly effective, curing HCV infection in over 95% of patients18–20. Previous work has demonstrated that a subset of virus-specific T cells persist long-term after curative therapy21,22, but do not regain substantial effector function. However, the mechanisms underlying these continued functional deficits, and whether removal of chronic stimulation can fundamentally reprogram the exhausted state, remains unknown.
Here we show that exhausted CD8+ T cells responding to HCV and HIV share a core regulatory program that is largely irreversible after cure of infection, leading to epigenetic “scarring”. The establishment of this exhaustion-associated program largely depends on chronic Ag stimulation, and not the inflammatory milieu. Consistent with this, HCV-specific responses to mutated viral epitopes retain less of the exhausted epigenetic signature despite continued exposure to the inflammatory milieu. We develop a novel algorithm to infer super-enhancer (SE) activity directly from chromatin accessibility and show that epigenetic scars include exhaustion-specific SEs. Scarred SEs were found near key transcription factors, including TOX and HIF-1α, and were retained by HCV-specific cells post-DAA therapy upon long-term follow-up. The epigenetic inflexibility of CD8+ T cell responses in HCV has crucial implications for clinical efforts to reverse T cell exhaustion and generate protective memory responses to chronic infection.
Results
Distinct epigenetic changes define T cells in chronic HCV
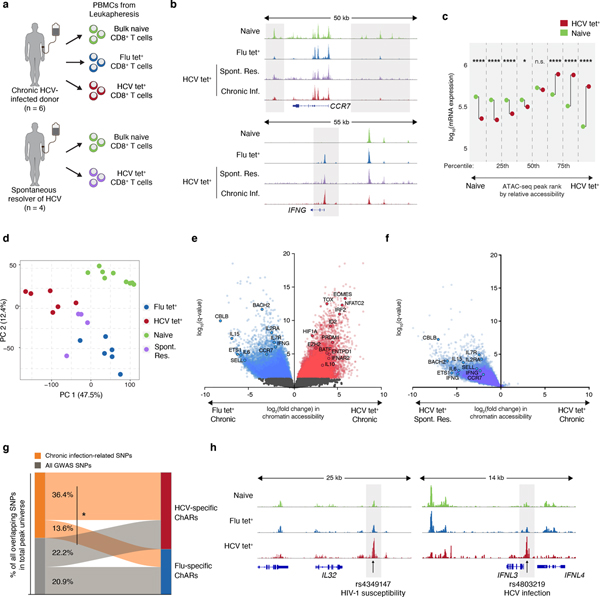
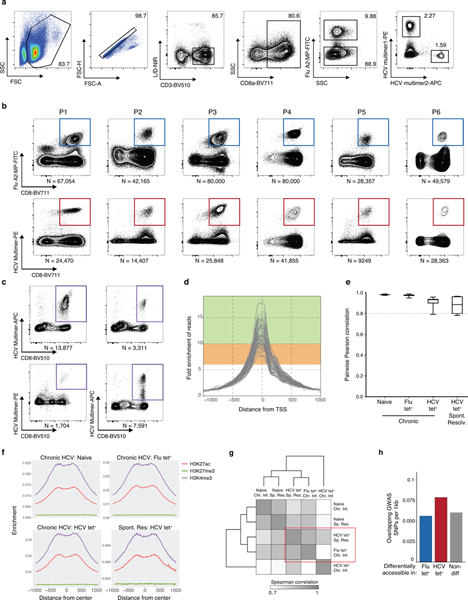
To characterize epigenetic changes following chronic HCV infection, we isolated 10–80,000 antigen-specific CD8+ T cells responding to HCV or influenza (Flu) virus – representing exhausted and functional memory responses, respectively – along with control naive CD8+ T cells from six chronically HCV-infected donors, and four spontaneous resolvers of HCV infection (Fig. 1a, Extended Data Fig. 1a–c, Supplementary Table 1). We used ATAC-seq to profile chromatin accessibility, identifying 128,327 chromatin-accessible regions (ChARs) across all biological conditions (Supplementary Table 2). Marked enrichment of chromatin accessibility at transcriptional start sites (TSSs) and strong correlation between individual donor samples suggested high data quality (Extended Data Fig. 1d–e).
Figure 1. Distinct epigenetic changes underlie CD8+ T cell responses to influenza and chronic HCV infection.
(A) Schematic diagram of the experiment. (B) Representative ATAC-seq tracks at the CCR7 and IFNG gene loci. (C) Median mRNA expression of genes neighboring chromatin accessibility regions, which were partitioned into 8 bins based on relative accessibility in naïve vs. HCV tet+ CD8+ T cells. Gene expression from naïve T cells is denoted in green, and that from HCV tet+ cells in red. (D) Principal component analysis of naïve, HCV tet+ and Flu tet+ CD8+ T cell populations across 6 patients. (E) Volcano plot highlighting differential transcripts present in Flu tet+ CD8+ T cells versus HCV tet+ CD8+ T cells (colored dots, FDR < 0.05). (F) Reprojection of Flu-specific ChARs from (E) onto volcano plots comparing HCV tet+ in spontaneously resolved versus chronic infection. (G) Classification of SNPs falling within HCV-specific (red) and Flu-specific (blue) ChARs. SNPs that were subcategorized into those associated with chronic viral infection are summarized in Supplementary Table 3. (H) Representative ATAC-seq tracks at the IL32 and IFNL3 gene locus, showing the location of a SNP associated with HIV-1 susceptibility and HCV infection, respectively.
Initial inspection revealed chromatin accessibility changes consistent with known biology of CD8+ T cells. As expected, we observed increased accessibility at the CCR7 gene locus within naïve T cells, which encodes a key chemokine receptor expressed in that cell population (Fig. 1b). Conversely, antigen experienced Flu- and HCV-specific cells showed a gain of ChARs in the IFNG gene locus, consistent with upregulation of IFN-γ in activated CD8+ T cells (Fig. 1b). We then asked how changes in chromatin accessibility related to transcriptional differences between the populations. We ranked ChARs by differential accessibility and binned into eight groups, ranging from most to least accessible in naive T cells relative to HCV tet+ T cells from chronic infection. We observed significant and concordant changes in the average mRNA expression of neighboring genes in the top and bottom 25% of differential ChARs between naive and HCV-specific cells (p<0.0001, Mann-Whitney U) (Fig. 1c). The positive correlation in chromatin accessibility and mRNA transcription levels, and strong enrichment for activating histone marks within ChARs, suggested that the vast majority of differential ChARs act as positive regulators of gene expression (Extended Data Fig. 1f).
Principal component analysis (PCA) of all ChARs showed clear separation of naïve, Flu-specific and exhausted HCV-specific CD8+ T cells (Fig. 1d). To characterize features that distinguished the Flu- and HCV-specific responses in chronic infection, we performed supervised differential accessibility analysis between Flu tet+ and HCV tet+ CD8+ T cells. Higher accessibility in HCV tet+ relative to Flu tet+ cells was found in 21,490 regions (FDR<0.05, DESeq2), suggesting that the HCV-specific population had a markedly different chromatin accessibility landscape (Fig. 1e). Critically, HCV tet+ T cells from resolved infection were distinct from HCV tet+ exhausted T cells within chronically-infected donors by PCA projection, suggesting that disease-specificity could not entirely explain the difference between HCV and Flu tet+ T cells in chronic infection. Consistent with this, the HCV-specific population from resolved infection was more similar to Flu-specific T cells than exhausted HCV-specific T cells in chronic infection (Extended Data Fig. 1g). Indeed, the majority of Flu-specific ChARs relative to HCV-specific ChARs in chronic infection were also more accessible in resolved HCV-specific responses (Fig. 1f). These data suggest that HCV-specific T cells in chronic settings have markedly different epigenetic changes compared to both donor-matched functional memory populations and resolved HCV infection. Differentially-accessible ChARs in Flu- and resolved HCV-specific T cells were found near genes such as IL15 and IL7R, important for CD8+ T cell memory formation23, while chronic HCV-specific T cells had increased accessibility at loci including EOMES3 and NFATC224, previously implicated in regulating T cell exhaustion.
We then looked for evidence that these large-scale epigenetic changes were relevant in disease processes. We reasoned that if state-specific ChARs represented important regulatory units, they might be associated with disease-causing genetic variants, which are preferentially located in active promoters and enhancers relative to background non-coding regions. Given known chromatin accessibility differences associated with genetic variation i.e. ATAC-QTLs25, we specifically focused on differences between Flu- and HCV- specific ChARs within chronically-infected donors and assayed the enrichment of single nucleotide polymorphisms (SNPs) derived from genome-wide association studies (GWAS). HCV-specific ChARs tended to overlap SNPs at a greater rate per base pair compared to non-differential or Flu-specific ChARs (1.3-fold and 1.4-fold, respectively) (Extended Data Fig. 1h). Furthermore, when subcategorized by etiology, SNPs related to chronic viral infections (Supplementary Table 3) were significantly overrepresented in HCV-specific ChARs relative to Flu-specific ones (36.4% vs. 13.6%) (p=0.0042, hypergeometric test) (Fig. 1g). For example, a GWAS SNP for HIV-1 susceptibility was found within an HCV-specific ChAR near the IL32 gene, which encodes a pro-inflammatory cytokine implicated in regulating disease outcome in chronic infection26–29 (Fig. 1h). Moreover, HCV-specific ChARs overlapped at least one GWAS SNP found at the IFNL3 locus, one of the strongest predictors of spontaneous viral clearance30 (Fig. 1h). The exact role of these genes in chronic viral infections is still being investigated30,31. Nevertheless, these data suggest that the underlying mechanism of some GWAS SNP associations may be through modulation of enhancer activity within HCV-specific responses. The CD8+ T cell response to HCV, therefore, involves large-scale differences in chromatin accessibility that are associated with regulatory activity in human disease.
Epigenetic signature of T cell exhaustion is conserved
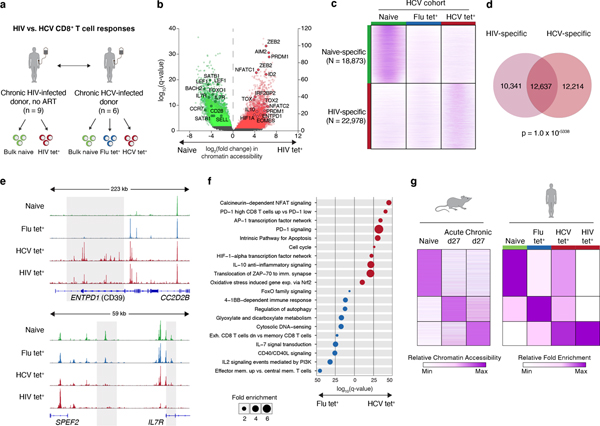
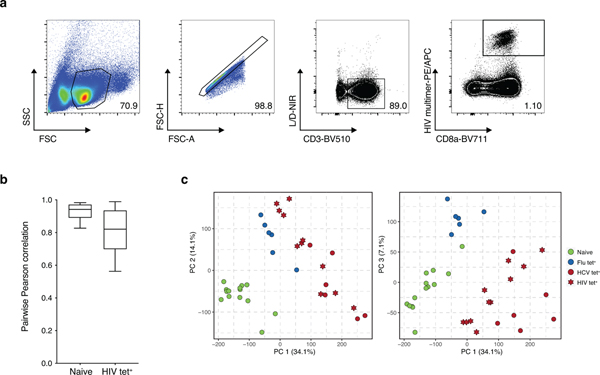
We reasoned that changes observed in HCV-specific cells relative to Flu-specific T cells could be exhaustion-related or specific to the immunobiology of the Hepatitis C virus. We therefore asked whether observed changes in chromatin accessibility could be recovered in the context of another chronic viral infection, HIV. Comparison of ATAC-seq profiles isolated from nine treatment-naïve HIV infected donors identified 18,873 naive-specific and 22,978 HIV-specific ChARs (Fig. 2a–b, Extended Data Fig. 2a–b, Supplementary Table 4). As expected, naive-specific ChARs identified in HIV-infected donors were also more open in naive T cells isolated from HCV patients (Fig. 2c). Conversely, HIV-specific ChARs had greater accessibility on average in HCV tet+ cells compared to their openness in naive and Flu tet+ cells (Fig. 2c). Consistent with this, PCA separated not only naïve T cells from antigen-experienced cells but also HIV- and HCV-specific T cells from Flu-specific memory T cells (Extended Data Fig. 2c). Indeed, 12,637 ChARs showed greater accessibility in both HIV and HCV tet+ cells relative to their naive T cell counterparts, representing marked overlap (p=1.0×10−5338; hypergeometric test) (Fig. 2d). All chronic-infection related GWAS SNPs found within HIV-specific ChARs were shared with HCV-specific T cells, highlighting the potential functional role of this shared epigenetic profile. Thus, T cell exhaustion in human CD8+ T cells induces hallmark epigenetic changes across multiple chronic viral infections such as HIV and HCV.
Figure 2. Epigenetic signature of T cell exhaustion is conserved across chronic viral infections.
(A) Schematic diagram of the experiment. (B) Volcano plot highlighting differential transcripts present in HIV tet+ CD8+ T cells versus naive CD8+ T cells from HIV patients (colored dots, FDR < 0.05). (C) Chromatin accessibility at naïve-specific and HIV-specific ChARs within the indicated conditions from the HCV cohort. (D) Venn diagram of overlap between ChARs with increased in accessibility in HIV and HCV tet+ T cells relative to naïve T cells. (E) Representative ATAC-seq tracks at the ENTPD1 and IL7R gene loci. (F) Gene ontology and gene set enrichment (rows) in Flu-specific (blue) or HCV-specific (red) ChARs. FDR values (hypergeometric test) presented as 1–log10. (G) Heatmap of peak intensity within modules of ChARs (rows) from mouse naïve CD8+ T cells, and CD8+ T cells responding to acute and chronic LCMV (left). Fold enrichment of regions orthologous to mouse naïve, memory and exhaustion enhancers in human samples indicated (right).
This shared regulatory program included HIV- and HCV-specific ChARs found near exhaustion-specific inhibitory receptor genes such as ENTPD1 (encoding CD39) (Fig. 2e). HIV- and HCV-specific cells also lacked memory-associated ChARs that were recovered near CD127 (IL-7R) in Flu tet+ populations (Fig. 2e). Accordingly, Flu-specific ChARs enriched for pathways associated with IL-7 signaling and effector memory formation, while HCV-specific ChARs were found near genes associated with NFAT signaling and PD-1 upregulation, both related to T cell exhaustion (Fig. 2f).
Finally, we asked whether chronic infection induced analogous changes in mouse and human CD8+ T cell responses. We compared Flu-, HCV- and HIV- specific epigenetic profiles to that of memory and exhausted CD8+ T cells from mouse acute and chronic infection, respectively. Flu tet+ cells had higher accessibility in orthologous memory-specific regions defined in acute LCMV Armstrong (p=1.06×10−60, hypergeometric test) (Fig. 2g). Conversely, ChARs specific to HCV tet+ and HIV tet+ cells enriched for exhaustion-specific regions identified in chronic LCMV Clone 13 infection (p=1.20×10−83 and 6.25×10⁻⁶, hypergeometric test) (Fig. 2g). Exhaustion is therefore associated with an evolutionarily conserved epigenetic state across mouse and human chronic infections.
HCV-specific T cells retain epigenetic scars of exhaustion
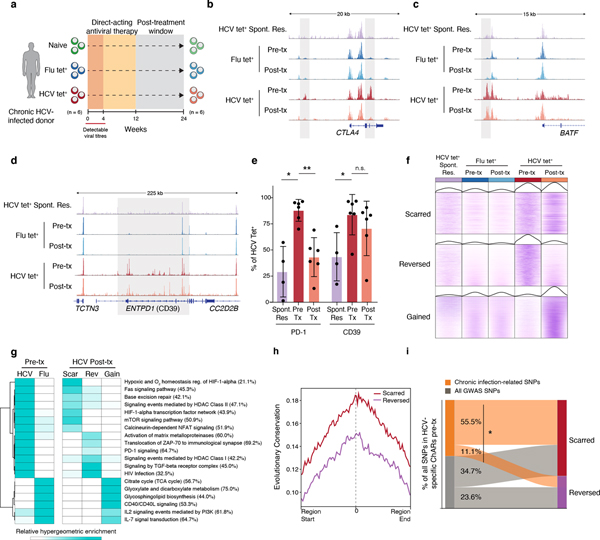
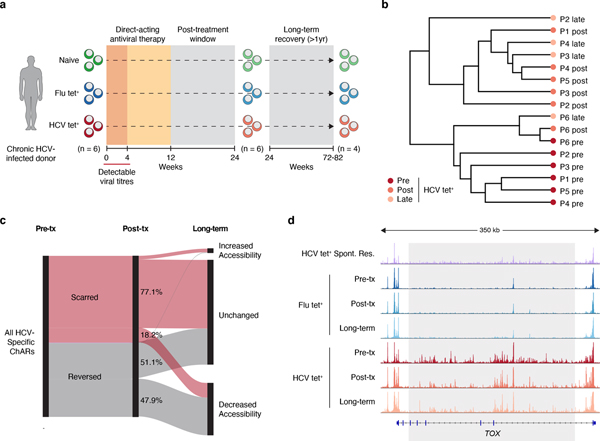
Recently developed direct-acting antiviral (DAA) therapies have enabled cure of chronic HCV infection without use of interferon18–20. However, whether removal of chronic antigen and inflammation can remodel the exhaustion-specific epigenetic program remains unknown. We investigated changes within the HCV tet+ population after cure of infection by profiling antigen-specific CD8+ T cells from the same donors 12 weeks after cessation of DAA therapy, which is approximately 20 weeks after viral clearance (Fig 3a). 25,237 ChARs were differentially accessible between HCV tet+ cells pre- and post-therapy (FDR<0.05; DESeq2). Examples of differential ChARs lost post-therapy included HCV tet+ specific ChARs near key exhaustion-associated genes such as CTLA4 (Fig. 3b).
Figure 3. HCV-specific CD8+ T cells retain epigenetic scars of exhaustion despite cure of chronic infection.
(A) Schematic diagram of the treatment regimen. (B-D) Representative ATAC-seq tracks at the CTLA4 (B), ENTPD1 (C) and BATF (D) gene loci. (E) Frequency of PD-1 and CD39 in HCV-specific CD8+ T cells from spontaneously resolved and chronic HCV infection. Mean ± s.d., two-sided Student’s t-test with Welch’s correction; *P ≤ 0.05, **P ≤ 0.01, ***P ≤ 0.001. N = 6 donors for chronic HCV, N = 4 donors for resolved HCV infection. (F) Chromatin accessibility at “scarred”, “reversed” and “gained” ChARs within the indicated conditions from the HCV cohort. (G) Heatmap showing pathway enrichment (rows) within HCV-specific and Flu-specific ChARs pre-treatment, and within scarred, reversed and gained ChARs post-treatment (columns). Percentage of genes observed within total gene-set is denoted in parentheses for the “scarred”, “reversed” and “gained” clusters, respectively. (H) Average evolutionary conservation across the length of all ChARs within the scarred and reversed ChAR set. (I) Alluvial diagram showing shared chronic-infection related or all GWAS SNPs between HCV-specific ChARs pre-treatment and scarred and reversed ChARs post-treatment.
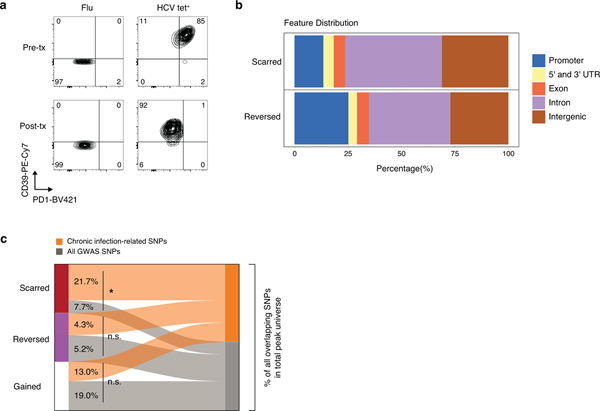
However, in addition to identifying instances of epigenetic remodeling, we identified exhaustion-specific ChARs that were not reversed (Fig. 3c–d). ChARs near key genes such as BATF and ENTPD1 remained accessible, consistent with the fact that high surface expression of CD39 was maintained post-cure in the HCV tet+ population (Fig. 3e, Extended Data Fig. 3a). We analyzed ChARs genome-wide and found that ChARs specific to HCV tet+ cells pre-treatment could be broadly separated into two classes: those retained or “scarred” and those “reversed” by DAA-therapy (Fig. 3f). We also studied ChARs that were “gained” or became accessible in HCV tet+ cells only after cure of infection (Fig. 3f). Pathway enrichment suggested that scarred, reversed, and gained ChARs regulated functionally distinct programs of genes (Fig. 3g). Scarred regions enriched for genes related to NFAT and HIF1α signaling while reversed regions enriched for pathways such as translocation of ZAP70 and PD-1 signaling. Shared enrichment of pathways including IL-7 signal transduction in Flu-specific as well as “gained” ChARs demonstrated that cure of infection could initiate some epigenetic changes associated with memory T cells.
We next investigated the regulatory impact of scarred vs. reversed ChARs by assaying several associated features. We examined differential genomic localization and found that epigenetic scars were preferentially located in introns and intergenic regions (Extended Data Fig. 3b), suggesting enrichment for distal regulatory elements. Scarred ChARs also had higher sequence conservation across mammals compared to reversed regions (Fig. 3h), highlighting their potential importance. Scarred, but not reversed or gained ChARs, were enriched for GWAS SNPs related to chronic viral infections compared to all SNPs (p=0.021, scarred; p=0.37, reversed; p=0.17, gained; hypergeometric test) (Extended Data Fig. 3c). Indeed, the majority of HCV-specific ChARs that initially overlapped chronic-infection-related SNPs pre-DAA therapy were scarred rather than reversed post-treatment (55.5% vs. 11.1%, p=0.043, hypergeometric test) (Fig. 3i), suggesting that regions with the greatest regulatory impact in human disease were preferentially retained in exhausted T cells post-cure.
Chronic TCR signaling is required for epigenetic scarring
Chronic antigen stimulation and persistent inflammation have each been thought to contribute to the development of T cell dysfunction32. We next investigated the relative contribution of these two factors in driving chromatin accessibility changes and the associated epigenetic scarring observed in chronic HCV-specific T cell responses.
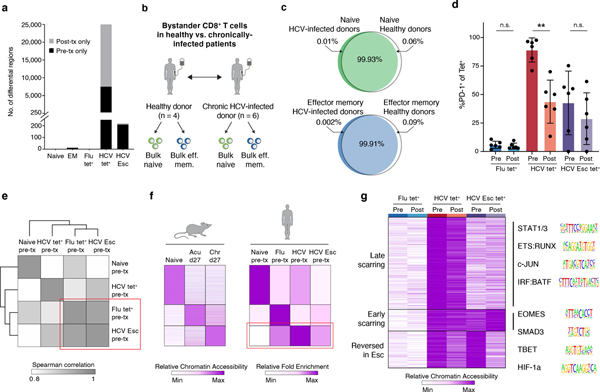
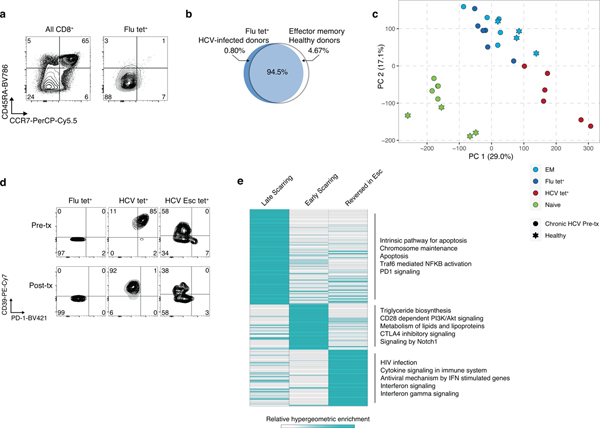
First, we examined the epigenetic changes induced by DAA therapy in bystander populations. Notably, almost no changes (<5 differential ChARs, FDR<0.05) were detected within the naive and Flu-specific T cell populations before and after treatment (Fig. 4a). This finding could be explained in two ways: either TCR-independent chronic inflammation does not mediate significant epigenetic changes, or those changes are permanent and thus unaffected by cure of infection. We reasoned that comparison to naive and memory populations from uninfected donors could identify changes driven specifically by the inflammatory microenvironment in bystander populations. Therefore, we generated chromatin accessibility profiles from bulk naive and effector memory populations from 4 healthy donors and compared them to naïve and bulk effector memory T cells in HCV-infected patients (Fig. 4b). Less than 0.1% of all ChARs were differentially accessible between the respective naive and effector memory populations in healthy donors (Fig. 4c). Furthermore, less than 5% of all ChARs were altered between the Flu-specific cells, which were also marked by an effector-memory (CCR7−CD45RA−) phenotype (Extended Data Fig. 4a–b). In contrast, almost 10-fold more ChARs (44,798 out of 128,327; 34.9%) were differential between Flu- and HCV-specific cells. Consistent with this, naïve and effector memory responses (including Flu tet+ T cells) derived from chronically-infected donors co-clustered with their counterparts from healthy donors by PCA but were segregated from exhausted HCV-specific populations (Extended Data Fig. 4c). These data suggest that an inflammatory milieu imprints minimal epigenetic changes in bystander populations.
Figure 4. Chronic TCR signaling, and not inflammatory milieu, drives epigenetic scarring in exhausted CD8+ T cells.
(A) Quantification of differential ChARs within indicated conditions, before and after DAA therapy.
(B) Schematic diagram of the experiment. (C) Venn diagram of ChAR overlap in naïve T cells (top) and bulk effector memory cells (bottom) from HCV-infected donors and healthy donors. (D) PD-1 staining on tetramer populations before and after DAA therapy. Mean ± s.d., two-sided Student’s t-test with Welch’s correction; *P ≤ 0.05, **P ≤ 0.01, ***P ≤ 0.001. N = 6 donors. (E) Clustered similarity matrix between the indicated biological conditions at the pre-treatment timepoint. (F) Heatmap of peak intensity within modules of ChARs (rows) from mouse naïve CD8+ T cells, and CD8+ T cells responding to acute and chronic LCMV (left). Fold enrichment of regions orthologous to mouse naïve, memory and exhaustion enhancers in human samples indicated (right). (G) Heatmap of chromatin accessibility within scarred ChARs (rows), clustered across the indicated cell states (columns). Sequence logos for transcription factor motifs enriched within the indicated clusters (right).
Chronic TCR stimulation is thought to be the other major contributor to the development of T cell exhaustion. To address this, we leveraged the detection of multiple HCV tet+ responses within each patient, including instances where the virus mutated away from the T cell epitope, thus abrogating or diminishing TCR signaling (denoted “HCV Esc”). We reasoned that comparison of the previously-characterized conserved HCV tet+ response to the HCV Esc tet+ response prior to DAA therapy would allow us to dissect the role of TCR signaling while controlling for the inflammatory milieu.
First, we examined inhibitory receptor expression on antigen-specific CD8+ T cell populations pre- and post-resolution of infection. We noted that the HCV Esc tet+ population had lower PD-1 expression than HCV tet+ cells prior to initiation of DAA-therapy (7% vs. 87%) (Fig. 4d, Extended Data Fig. 4d). Indeed, hierarchical clustering of samples before DAA-therapy showed that the HCV Esc tet+ response was epigenetically more similar to the functional Flu tet+ response than the exhausted HCV tet+ response (Fig. 4e). This was supported by the fact that the HCV Esc-specific ChARs failed to enrich for mouse-model derived signatures of exhaustion (Fig. 4f) and that resolution of infection led to minimal differences within the HCV Esc tet+ response (<250 differential ChARs, FDR<0.05). Together, these data suggest that epigenetic changes of exhaustion could not be attributed solely to the presence of inflammation and that chronic TCR stimulation might instead be a major driver.
Next, we asked how the establishment of epigenetic scars might be affected by early loss of TCR signaling in the context of chronic viral infection. Comparison of scarred ChARs between the HCV tet+ and HCV Esc tet+ responses revealed distinct patterns of accessibility (Fig. 4g). The scars shared between HCV tet+ and HCV Esc tet+ cells were presumably acquired early in the course of infection. Accordingly, these ChARs were enriched for motifs of canonical transcription factors in exhaustion such as T-bet and Eomes (p<0.05, hypergeometric test). Of note, the lack of strong memory enrichment within HCV Esc-specific responses (Fig. 4f) is likely explained by the presence of these epigenetic scars and may underlie the lack of protective memory formation in chronic HCV as noted in previous studies21,22. Nevertheless, the majority of scarred ChARs were only observed in HCV tet+, but not in HCV Esc tet+ responses, and thus were likely related to the chronicity of viral exposure. Consistent with this, these ChARs were enriched for motifs related to STATs and AP-1 family members, which are often activated downstream of TCR ligation (Fig. 4g). Early vs. late scarred regions were also differentially enriched for pathways related to apoptosis, inhibitory receptor signaling, and lipid metabolism (Extended Data Fig. 4e). These data are consistent with a model where the degree and duration of chronic TCR signaling, rather than the inflammatory microenvironment, drive epigenetic scarring in exhaustion.
Scars represent critical epigenetic hallmarks of exhaustion
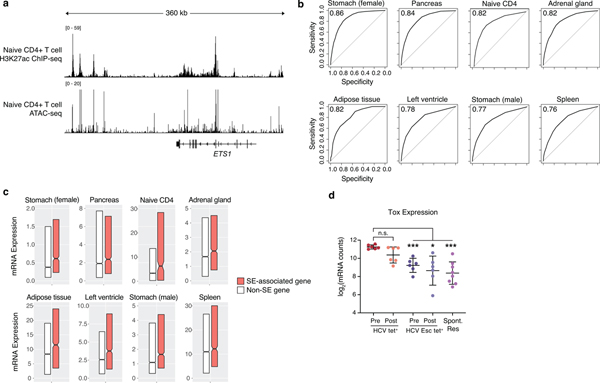
We next investigated the impact of epigenetic scarring on the regulation of T cell exhaustion. Characterization of super-enhancers (SEs) and their associated genes has been utilized to define important regulatory nodes in many cell types33–36, but assaying SE activity within exhausted T cells using standard H3K27ac ChIP-seq has been limited by low cell numbers. Therefore, we developed a novel method relying solely on chromatin accessibility profiles generated using ATAC-seq that allow inference of super-enhancer activity and recapitulate H3K27ac ChIP-seq-based results. As expected, we saw concordant enrichment of H3K27ac signal and presence of open chromatin at the ETS1 SE locus in CD4+ T cells (Extended Data Fig. 5a)36. Across 8 human cell types, chromatin accessibility data could largely predict H3K27ac-based SE identities, with AUC values ranging from 0.76 to 0.86 (Extended Data Fig. 5b). SE-associated genes identified via ATAC-seq were transcribed at higher levels than non-SE-associated genes in each respective cell type (Extended Data Fig. 5c), further supporting our ability to accurately identify super-enhancer associated genes solely from open chromatin regions37.
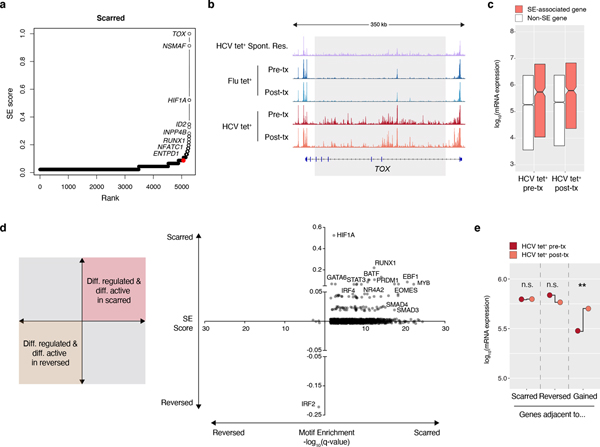
Having validated our method for identifying super-enhancers, we then applied it to the epigenetic scars in HCV tet+ cells (Fig. 5a). The gene encoding the transcription factor TOX was ranked as the top SE-associated gene within the scarred regions (Fig. 5a–b). This is consistent with the known role of TOX as a critical regulator of exhausted T cells in multiple contexts of chronic stimulation3,38–40. Strikingly, Tox mRNA expression was elevated in HCV tet+ cells pre-treatment relative to both HCV Esc and spontaneously resolved HCV infection (Extended Data Fig. 5d) and was not altered by DAA-therapy. Other SE-associated transcription factors (TFs) included HIF1α, ID2, and NFAT (Fig. 5a), along with others which may represent novel regulators of the exhausted state.
Figure 5. Scarred regions identify critical regulators of exhaustion.
(A) Super-enhancer elbow plots based on ChARs within the scarred set of regions. (B) Representative ATAC-seq tracks at the TOX gene locus. (C) Boxplots of log10(mRNA expression) from HCV tet+ cells before and after treatment, partitioned by genes with or without an associated super-enhancer. Centre, median; box limits, first and third percentiles. (D) Plot of transcription factors based on their super-enhancer ranking (y-axis) and differential motif enrichment between scarred and reversed ChARs (x-axis). (E) Median mRNA expression of genes neighboring scarred, reversed or gained chromatin accessibility regions. Gene expression from HCV tet+ cells before and after treatment are denoted in red and orange, respectively.
As expected, SE-associated genes had higher mRNA expression than non-SE genes within HCV-specific T cells (Fig. 5c). To explore the regulatory impact of SE-associated TFs, we performed differential motif enrichment between scarred and reversed ChARs. Strikingly, a large fraction of SE-associated TFs had motifs that were overrepresented in scarred vs. reversed regions (Fig. 5d). This included not just HIF1α but also other exhaustion-associated TFs including EOMES, RUNX1, and BATF. Importantly, these transcription factors themselves are differentially regulated by epigenetic scars. Therefore, the overrepresentation of their downstream binding sites in those same scars indicates the existence of a positive feedback loop that may reinforce the epigenetic state of T cell exhaustion. Consistent with this, newly gained ChARs post-DAA therapy were associated with significant changes in the average mRNA expression of neighboring genes (p=0.0022, paired T-test) whereas transcription of genes neighboring scarred and reversed ChARs were not altered (Fig. 5e). The continued elevated transcription of genes adjacent to reversed ChARs further highlights the fixed differentiation state of HCV-specific T cells after resolution of infection. Together, these data suggest that failure to reverse CD8+ T cell exhaustion after curative therapy may be mediated by the activity of distinct transcriptional regulators within epigenetic scars.
Epigenetic scars of exhaustion are retained long-term
Our results suggested that cure of infection through DAA therapy leaves epigenetic scars that include regions regulating the function of exhausted T cells. However, it is possible that these regions simply represent those that are slower to revert than others. To test this, we profiled 4 patients 60–80 weeks after cessation of therapy (Fig. 6a). The chromatin accessibility profiles of HCV tet+ cells at the late time-point largely clustered with those generated immediately post-therapy as opposed to pre-treatment (Fig. 6b). We then compared reversed ChARs at the late time-point to the post-therapy measurement and found that about half were unchanged while the rest continued to decrease in accessibility over time (Fig. 6c). In contrast, 77.1% of scarred ChARs remained unchanged and only 18.2% diminished in accessibility upon long-term follow-up (Fig. 6c). Regions that remained accessible at this late time-point included the super-enhancer near TOX (Fig. 6d). Overall, these data suggest that the epigenetic scars of exhaustion are retained long-term after cure of infection, likely restraining the formation of protective memory responses to HCV.
Figure 6. Epigenetic scars of exhaustion are retained long-term after cure of infection.
(A) Schematic diagram of experimental time-points before and after DAA therapy. (B) Clustering of individual HCV tet+ profiles from patients across 3 time-points (pre-treatment, post-treatment and long-term). (C) Longitudinal trajectory of scarred and reversed ChARs at each time point. (D) Representative ATAC-seq tracks at the TOX gene locus.
Discussion
T cell responses to chronic viral infection are characterized by a range of functional defects10–12,41,42, but the epigenetic mechanisms that specify T cell exhaustion and the potential for reprogramming the exhausted cell state after curative therapy remains an open question. Here we show that the landscape of regulatory regions in HCV-specific exhausted CD8+ T cells: 1) is markedly different from memory responses; 2) is established in a TCR-dependent fashion; and 3) becomes fixed despite cure of infection. HCV-specific epigenetic changes are conserved across chronic viral infection settings where T cell exhaustion is observed, including HIV and the LCMV mouse model. By developing a novel algorithm to infer super-enhancer activity despite low cell input, we also pinpoint key transcriptional regulators of exhaustion such as TOX and HIF1α within these epigenetic scars. These findings have important implications for understanding the regulation of exhausted T cells at the epigenetic level.
First, we show that T cell exhaustion is defined by a distinct epigenetic program that is conserved across chronic viral infection paradigms, including HIV and the LCMV mouse model. While this has been previously established in mouse models of chronic viral infection4,43,44, previous studies in humans have been limited by the small numbers of virus-specific T cells that can be isolated from patients. Here, we overcome this by analyzing leukapheresis samples from a specifically designed interventional trial to investigate the fate of exhausted HCV-specific T cells, and further compare them to treatment-naive HIV samples. To our knowledge, this study is the first to show that exhausted T cells in multiple human viral infections adopt a similar epigenetic profile in response to chronic antigen. By mapping chromatin accessibility changes in several contexts of T cell exhaustion, we also establish a core epigenetic signature that can act as a biomarker of the exhausted state in human CD8+ T cells.
Second, we dissect the relative contribution of chronic TCR signaling versus the inflammatory milieu in driving epigenetic changes. Previous studies in both mice and humans have highlighted the potential role of chronic type I IFN signaling as well as the role of immunosuppressive cytokines such as IL-10 and TGF-b in the development of T cell exhaustion45–48. Separating direct cell-intrinsic effects in CD8+ T cells from indirect effects mediated by other populations remains a challenge in these studies. We resolve this by studying antigen-specific responses to acute and chronic viral infections within the same patient, thus controlling for microenvironment effects. We show that the epigenetic profile of effector-memory phenotype Flu-specific T cells and bulk effector memory populations in chronic infection are virtually indistinguishable from that of effector memory cells from healthy donors. Furthermore, we observe partial epigenetic remodeling within HCV-specific responses where viral epitope escape has abrogated specific TCR recognition, despite continued exposure to the inflammatory milieu. These data suggest that chronic TCR signaling, rather than the inflammatory microenvironment, is largely responsible for inducing epigenetic changes associated with T cell exhaustion.
Third, we find only limited remodeling of the epigenetic landscape after cure of infection, suggesting that the exhausted T cell state cannot be fully reversed with DAA treatment. Indeed, epigenetic scars are preserved for over a year after termination of viremia and removal of chronic antigen. Scarred regions are enriched for disease-associated SNPs relative to reversed regions following DAA therapy, suggesting they may have a greater regulatory role in mediating continued impairment of HCV-specific responses. Epigenetic scars include super-enhancer elements near critical exhaustion-associated transcription factors such as TOX and HIF1α, which may provide positive feedback to maintain the state of exhaustion. Consistent with this, we observe persistent high expression of genes neighboring not just scarred, but also reversed ChARs, after DAA-therapy. Further study is required to assess whether epigenetic scars are maintained indefinitely, and how their persistence could be impacted by shifts in subpopulations of exhausted T cells.
There are several other limitations to our current study. First, the lack of epigenetic remodeling within bystander populations in chronic HCV might not be generalizable to other diseases like HIV. Second, the degree of epigenetic changes may be related to priming, or the amount of re-activation experienced by bystander T cells in chronic contexts, and therefore Flu-specific responses, which are often generated early in life, may be relatively shielded. Due to limited sample size, we are currently unable to resolve whether differences in the amount of epigenetic scarring observed between conserved and escaped HCV-specific responses could be partially driven by epitope-specific differences. Finally, CD8+ T cell populations in the peripheral blood compartment may not perfectly reflect those found in the liver in chronic HCV infection49. Nevertheless, our data is consistent with studies showing that chronic TCR signaling is necessary and sufficient to induce molecular, transcriptional and epigenetic changes of exhaustion in human T cells activated in vitro50. The critical regulatory impact of retained epigenetic scars may underlie emerging evidence that HCV-specific cells isolated post-cure produce less IFN-γ and TNF relative to functional Flu-specific memory cells21,22. These findings are also consistent with studies showing limited CD8+ T cell reactivity to HIV antigens51, and continued demethylation at the PD-1 locus52, after successful anti-retroviral therapy (ART). Thus, continued dysfunction of exhausted CD8+ T cells even after removal of antigen might be mediated by inflexibility at the epigenetic level.
In this study, we show that the distinct epigenetic landscape of T cell exhaustion cannot be fully reversed by cure of chronic viral infection and is instead maintained long-term. In addition to providing greater insight into the regulation of exhausted T cells, these findings have important implications for therapeutic strategies targeting T cell dysfunction. The epigenetic irreversibility of exhausted T cells observed herein is consistent with previous studies showing that checkpoint blockade immunotherapy does not fundamentally reverse exhaustion-associated epigenetic changes43,44. Furthermore, we show that the degree of scarring may be driven by the timing and magnitude of TCR stimulation. Reversing T cell exhaustion may thus require targeted approaches to modulate the inflexible epigenetic program that mediates dysfunction and restrains the generation of protective memory T cell responses.
Methods
Subjects.
For the HCV cohort (Supplementary Table 1), all patients were enrolled in an open label Phase 3 clinical trial of paritaprevir/ritonavir, ombitasvir, dasabuvir and ribavirin for genotype 1a hepatitis C virus infection designed to evaluate the effect of successful antiviral therapy on innate and adaptive immune responses (NCT02476617). The trial was approved by the Massachusetts General Hospital Institutional Review Board.
Trial subjects were confirmed to be chronically infected with HCV genotype (GT) 1a infection based on viral load and were screened for specific HLA alleles. To reduce the impact of sources of variability or bias, subjects that had tested positive for co-infections such as HIV or HBV or resolved a previous infection on their own were excluded.
Trial participants were treated for 12 weeks with a combination of paritaprevir/ritonavir, ombitasvir, dasabuvir and ribavirin. Only patients with hepatitis C virus RNA levels less than the lower limit of quantification (<LLOQ) 12 weeks after the last dose of study drug were included for further analysis. All included patients were followed for at least one-year post treatment. Informed consent was given by all subjects under protocols approved by the Massachusetts General Hospital IRB.
Blood samples via leukapheresis were collected from 6 patients at 2–3 time points representing pre-treatment, 12 weeks post-treatment, and long-term follow-up (60–80 weeks post treatment). Peripheral blood mononuclear cells (PBMCs) were extracted by Ficoll-Paque (GE Healthcare Life Sciences) density gradient centrifugation and frozen down for further processing. A small aliquot of sample was reserved and analyzed by flow cytometry to identify virus-specific CD8+ T cell responses using appropriate HLA class I multimers. Circulating HCV virus was then sequenced and compared to known epitopes that had elicited T cell responses. If the donor’s viral repertoire fully matched the epitope peptide sequence, that corresponding T cell response was considered conserved. If the donor’s viral repertoire diverged from the epitope peptide sequence, the ability of the new variant peptides to re-stimulate HCV-specific T cells was assayed. Only T cell responses that had none or minimal (less than 10% of original sequence) responsiveness were classified as HCV Esc. Partially escaped T cell responses were excluded from this study.
For the HIV cohort (Supplementary Table 4), all patients were enrolled in either the SPARTAC (‘Short Pulse Anti-Retroviral Therapy at Seroconversion’) or HEATHER (‘HIV Reservoir targeting with Early Antiretroviral Therapy’) trials. The SPARTAC trial (EudraCT Number: 2004–000446-20) was approved by the following authorities: the Medicines and Healthcare products Regulatory Agency (UK), the Ministry of Health (Brazil), the Irish Medicines Board (Ireland), the Medicines Control Council (South Africa) and the Uganda National Council for Science and Technology (Uganda). It was also approved by the following ethics committees in the participating countries: the Central London Research Ethics Committee (UK), Hospital Universitário Clementino Fraga Filho Ethics in Research Committee (Brazil), the Clinical Research and Ethics Committee of Hospital Clinic in the province of Barcelona (Spain), the Adelaide and Meath Hospital Research Ethics Committee (Ireland), the University of Witwatersrand Human Research Ethics Committee, the University of Kwazulu-Natal Research Ethics Committee and the University of Cape Town Research Ethics Committee (South Africa), Uganda Virus Research Institute Science and Ethics Committee (Uganda), the Prince Charles Hospital Human Research Ethics Committee and St Vincent’s Hospital Human Research Ethics Committee (Australia) and the National Institute for Infectious Diseases Lazzaro Spallanzani, Institute Hospital and the Medical Research Ethics Committee, and the ethical committee of the Central Foundation of San Raffaele, MonteTabor (Italy). The HEATHER trial (REC reference: 14/WM/1104) was approved by the West Midlands—South Birmingham Research Ethics Committee. Informed consent was given by all subjects.
The full inclusion criteria and details of these trials are published elsewhere53,54 and were similar in terms of inclusion criteria and demographics. In brief, the inclusion criteria were: HIV-1 positive antibody test within 6 months of a HIV-1 negative antibody test, HIV-1 antibody negative with positive PCR (or positive p24 Ag or viral load detectable), RITA (recent incident assay test algorithm) assay result consistent with recent infection, equivocal HIV-1 antibody test supported by a repeat test within 2 weeks showing a rising optical density, having clinical manifestations of symptomatic HIV seroconversion illness supported by antigen positivity. Cryopreserved peripheral blood mononuclear cells (PBMCs) were collected at each study visit, as previously described. All samples were collected before initiation of HAART to enable a fairer comparison to the HCV-cohort before treatment.
Cell isolation and cell sorting.
PBMCs from HCV patients were thawed rapidly in warm T cell culture medium (RPMI supplemented with 10% FBS) and counted. CD8+ T cells were enriched using MACS CD8 negative selection kit (Miltenyi). After enrichment, cells were stained for 15 minutes at 4°C using fluorochrome-conjugated multimers for HCV A*02:01 NS3 1073 CINGVCWTV (Immudex), influenza A*02:01 MP GILGFVFTL (Immudex), and other appropriate HCV multimers representing escaped viral epitopes (ProImmune). When required, unlabeled multimers were conjugated to APC by staining with Pro5 Fluorotags (ProImmune) per manufacturer’s protocol.
Multimer-positive cells were enriched using MACS anti-PE, anti-APC and anti-Fitc positive selection kits (Miltenyi). Cells were then stained for the following other cell surface markers from Biolegend and sorted on a FACSAria cell sorter (BD Biosciences) using FACSDIVA (v.8.0.1): anti–CD45RA (HI100 at 1:50), anti-CCR7 (G043H7 at 1:50), anti-CD3 (OKT3 at 1:50), anti-CD39 (A1 at 1:20), anti-PD-1 (EH12.2H7 at 1:20), anti-CD8a (SK1 at 1:50), anti-CD95 (DX2 at 1:20) and Near-IR Live/Dead (Invitrogen at 1:1000). Cell sorting strategy has been summarized in Fig. S1. For sorting bulk naïve and bulk effector memory T cells, we used 3 additional markers, CCR7, CD45RA and CD95: Naïve (live CD3+ CD8+ multimer- CCR7+CD45RA-); EM (live CD3+ CD8+ multimer-CCR7-CD45RA-). Cells were stained with the markers CD39 and PD-1 only to enable subsequent analysis of protein expression and were not used for any sort gates. All flow data was analyzed using FlowJo version 10.4.1. A maximum of 80,000 cells were sorted into PBS supplemented with 10% FBS for subsequent ATAC-seq library generation.
For the HIV cohort, the following fluorochrome-conjugated multimers from ImmunAware were used: HIV A*02:01 RLRPGGKKK, HIV B*07:02 GPGHKARVL, HIV B*57:01 KAFSPEVIPMF, HIV B*53:01 YPLTFGWCF. Cell isolation and processing was performed as previously described, but without secondary multimer enrichment.
ATAC-seq library generation.
ATAC-seq libraries were generated as previously described. Briefly, cell counts from the sorter were adjusted by assuming 65–70% cell loss. Sorted cells were pelleted for 10 minutes at 400 r.c.f and incubated in 5–50ul of Tn5 reaction mix (2x TD buffer, Tn5 enzyme, 2% digitonin in nuclease-free water) for 30 mins at 37°C. DNA was purified using a QIAgen MinElute Reaction Cleanup kit, and polymerase chain reaction (PCR) was used to add dual-indexed barcodes (Illumina). Post-PCR cleanup was done using Agencourt AMPure XP beads (Beckman Coulter/Agencourt) and ATAC library quality was verified using Tapestation analysis. Patient samples across multiple time-points were pooled for sequencing whenever possible to minimize batch effects. Samples were sequenced on an Illumina NextSeq500 sequencer using paired-end 37bp reads.
Data processing and quality control.
Sequencing reads were demultiplexed into fastq files using bcl2fastq (v2.19.1.403). Quality trimming and primer removal within raw fastq files were done with Trimmomatic (v0.36) using the following parameters: LEADING:15 TRAILING:15 SLIDINGWINDOW:4:15 MINLEN:36. Sequencing read QC was run before and after quality trimming using the FastQC software (Babraham Bioinformatics). Trimmed reads were aligned to hg19 with Bowtie2 (v2.2.9) using a maximum insert size of 1000. Aligned bams were sorted, duplicates marked, and reads mapping to the blacklist 55 region removed using PICARD. Aligned reads were shifted +4bp or −5bp as appropriate. All samples were assessed for library quality according to ENCODE guidelines (https://www.encodeproject.org/atac-seq/). Briefly, the fraction of reads in called peak regions (FRiP score) as well as TSS enrichment was calculated as previously described. Additionally, concordance of each biological condition was assessed by the average Pearson correlation across all pairwise combinations.
Peak universe generation and differential accessibility analysis.
For consensus peak generation, biological replicate samples (n = 6 patients) were downsampled to the lowest read count among the replicates separately for each of 12 biological conditions (Naive, Flu tet+, HCV tet+, HCV Esc tet+ x 3 time-points). Downsampled bams for each biological replicate were then merged using Samtools v1.3.1. Peak-calling was done for each biological condition using MACS (v2.1.1) on merged bam files with a q-value threshold of 0.001. Consensus peaks from all biological conditions were then merged to create a single HCV peak universe of 128,327 regions. Cut sites were extracted from each biological replicate and the number of cuts within each peak region was quantified (BEDtools v2.26.0) to generate a raw counts matrix. DESeq2 (v1.18.1) was used to normalize the counts matrix and perform differential accessibility analysis between all relevant comparisons. For any given comparison, an FDR cutoff of 0.05 was used to determine differential ChARs.
Comparative analysis of chromatin accessibility from LCMV mouse model.
Orthologous mouse ChARs (mm10) were mapped to the human genome (hg19) as described4. Since the mapping algorithm requires input regions in mm10, the UCSC liftover tool was applied to ChARs to transfer them onto mm10 from mm9. All mouse peaks partitioned into 3 categories based on previously published clustering: peaks found in the Naïve cluster a (mouse Naïve), peaks found in the Acute d27 cluster c (mouse Memory), and peaks found in the Chronic d27 cluster e (mouse Exhausted). Then, for each set of consensus peaks in the HCV dataset, the hypergeometric fold enrichment was calculated separately for the 3 categories of mouse orthologous peaks (Naïve, Memory, Exhaustion).
Enhancer classification.
For identification of “scarred”, “reversed” and “gained” regions, first we identified all ChARs that were significantly more accessible in HCV tet+ cells compared to Flu tet+ cells pre-treatment (n = 21,490; FDR < 0.05). Of these, all ChARs that became significantly less accessible in HCV tet+ cells post-treatment compared to HCV tet+ cells pre-treatment were denoted as “reversed” (n = 5203; FDR < 0.05). In contrast, all ChARs that were unchanged in HCV tet+ cells before and after treatment (FDR > 0.05 and absolute FC < 1.5) were termed “scarred” (n = 5769). Finally, ChARs that became significantly more accessible in HCV tet+ cells post-treatment compared to HCV tet+ cells pre-treatment were denoted as “gained” (n = 17,739; FDR < 0.05). These analyses, as summarized in Figures 1–3, were conducted only on conserved HCV responses relative to Flu-specific and naive T cells. Escaped responses were always analyzed separately and are denoted as “HCV Esc” in the figures/text.
Pathway and motif enrichment.
Gene to peak associations were determined using the GREAT software package (v3.0.0, http://bejerano.stanford.edu/great/public/html/) with default settings. GREAT was also used to determine gene set enrichment, with default settings and the binomial test to measure significance. Motif enrichment analysis was performed using HOMER (v3.0) with default settings.
SNP overlap analysis.
All GWAS SNPs in the NHGRI catalog (https://www.ebi.ac.uk/gwas/) annotated as “AIDS”, “Chronic hepatitis B virus infection”, “Hepatitis B virus infection”, “Hepatitis C virus infection”, “HIV infection” or “HIV-1 infection” were defined as being chronic infection-related. A detailed summary of all chronic infection-related SNPs along with associated metadata are provided in Supplementary Table 3. Hypergeometric tests were performed to quantify overlap of enhancers with all GWAS SNPS, and chronic infection-related SNPS.
Inference and validation of super-enhancer associated genes.
Super-enhancers (SEs) are composed of multiple constituent enhancer segments, encompassing large chromatin domains that are broadly marked by H3K27ac histone mark and/or Mediator binding33,35. Since ATAC-seq identifies smaller, more punctate regions of chromatin accessibility, we reasoned that counting the number of regulatory units near a given gene would allow us to approximate broad stretches of H3K27ac accumulation in SEs37. Based on this principle, SEs were identified by counting individual putative enhancers per gene within each sample. Specifically, the online tool GREAT (see above) was used to assign each ChAR to nearby gene(s). Afterwards, the number of regions was calculated per gene and the resultant list was ranked from highest to lowest. The list of ranked genes could then be plotted against the total number of regions to generate a characteristic elbow plot. As observed in the original definition of SEs33, this gene-centric approach also revealed a clear point in the distribution where the number of enhancers per gene increased rapidly. The x- and y-axes were then scaled from 0–1 and the inflection point in the curve was determined by using the findElbow tool within the ChemoSpecMarkeR package (Bryan A. Hanson). All genes with a higher number of regions than the inflection point were defined as SE-associated. This method can be used to call SE-associated genes from any set of ChARs, ranging from the whole universe to subsets of regions such as “scarred” or “reversed”.
Of note, this analysis directly identifies a set of genes associated with SE-like loci rather than identifying chromatin regions themselves, allowing for less ambiguity in assigning SEs to genes. However, the constituent enhancers of a putative super-enhancer can still be identified by inspecting the regions that are assigned to a SE-associated gene.
The performance of this method was tested by its ability to predict SE-associated genes as defined by the H3K27ac gold-standard. For consistency, H3K27ac-based SEs were assigned to genes using the GREAT tool. Eight human tissues were chosen based on the availability of matched ATAC-seq, H3K27ac ChIP-seq and RNA-seq datasets. Lists of H3K27ac-based super-enhancers for each tissue was obtained from dbSUPER (https://asntech.org/dbsuper/) and associated to genes using the GREAT tool for internal consistency. Paired ATAC-seq data for each tissue was obtained from ENCODE, and SE-associated gene identification was performed in the space of all regions as previously described. Genes associated with H3K27ac-based SEs were used as the “true-positives” to generate ROC curves for the predictive power of ATAC-based SE inference.
Statistics and data visualization.
Statistical analysis of differential chromatin accessibility tests was done using DESeq2, and FDR correction was performed using the Benjamini-Hochberg method in R 3.6.1. 2-group two-sided Mann-Whitney U tests were run to compare differences in mRNA expression of neighboring genes in Figure 1 and Figure 5. Significance of GO term enrichments and motif enrichments were calculated with two-sided hypergeometric tests. Significance of ChARs overlapping GWAS SNPs, HIV-specific regions or mouse orthologous ChARs were determined using two-sided hypergeometric tests. P-values and q-values < 0.05 were considered to indicate a significant difference. Asterisks used to indicate significance correspond with: p<0.05*, p<0.01**, p<0.001***, p<0.0001****.
ATAC-seq tracks were visualized using Integrative Genomics Viewer (v2.3.77). GENE-E (v3.0.215) was used for heatmap visualization and similarity matrix calculations (Pearson). Principal component analysis (PCA) was done using R (v3.3.1) in RStudio (v1.1.453). Volcano plots were generated using GraphPad Prism 7. All visualized boxplots depict the median, with the box representing the middle 50th percentile and whiskers representing the range.
Extended Data
Extended Data Fig. 1.
(A) Representative flow cytometry sorting strategy for Flu and HCV multimer+ CD8+ T cells. (B) Recovered numbers of Flu (top) and HCV (bottom) multimer+ cells for each donor during chronic HCV infection. (C) Recovered numbers of HCV multimer+ cells for each donor during resolved HCV infection. (D) Combined ATAC signal across all TSSs for each biological condition from each donor. Green and range bands indicate ranges for ideal and acceptable values, respectively, for TSS enrichment per ENCODE standards. (E) Boxplots of pairwise Pearson correlations for data from individual donors within each biological condition. Centre, median; box limits, first and third percentiles; whiskers, min and max. N = 6 donors. (F) Combined ATAC signal across all H3K27ac peaks (red), H3K27me3 (green) and H3K4me3 (purple). Histone mark peaks were determined from the following samples on ENCODE: ENCFF653OGM - H3K27ac, ENCFF285FID - H3K4me3, ENCFF367HSC - H3K27me3. (G) Clustered similarity matrix between the indicated biological conditions in the chronically-infected and spontaneously resolved cohort. (H) Density of overlapping GWAS SNPs per 1000bp in Flu-specific, HCV-specific or non-differential ChARs.
Extended Data Fig. 2.
(A) Representative flow cytometry sorting strategy for HIV multimer+ CD8+ T cells. (B) Boxplots of pairwise Pearson correlations for data from individual donors within each biological condition. Centre, median; box limits, first and third percentiles; whiskers, min and max. N = 11 donors. (C) Combined principal component analysis of naïve, HIV-, HCV- and Flu- specific CD8+ T cells from the HIV and HCV cohorts.
Extended Data Fig. 3.
(A) PD-1 and CD39 staining on tetramer populations before (top) and after (bottom) DAA therapy. (B) Partitioning of scarred and reversed regions into those overlapping promoters, UTRs, exons, introns and intergenic areas as indicated. (C) Classification of SNPs falling within scarred, reversed or gained ChARs. SNPs that were subcategorized into those associated with chronic viral infection are summarized in Supplementary Table 3.
Extended Data Fig. 4.
(A) CCR7 and CD45RA staining on all CD8+ T cells (left) and Flu-specific T cells (right). (B) Venn diagram of ChAR overlap in Flu tet+ cells (bottom) from HCV-infected donors and healthy donors. (C) PD-1 and CD39 staining on tetramer populations before (top) and after (bottom) DAA therapy. (D) Combined principal component analysis of naïve, effector memory, HCV-, and Flu- specific CD8+ T cells from the healthy and HCV cohorts. (E) Heatmap showing pathway enrichment (rows) within clustered ChARs from Figure 4g (columns).
Extended Data Fig. 5.
(A) H3K27ac ChIP-seq signal (top) and ATAC-seq signal (bottom) at the ETS1 gene locus. (B) ROC plots of varying cutoff for ATAC-based ranking of super-enhancer to predict bona fide super-enhancers defined using matched tissue-specific H3K27ac ChIP-seq. (C) Boxplots of tissue-specific mRNA expression, partitioned by genes with or without an associated super-enhancer. Centre, median; box limits, first and third percentiles. (D) Tox mRNA expression in HCV tetramer populations before and after DAA therapy. Mean ± s.d., two-sided Student’s t-test with Welch’s correction; *P ≤ 0.05, **P ≤ 0.01, ***P ≤ 0.001. N = 6 donors.
Supplementary Material
Supplementary Table 1. HCV-infected patient characteristics and multimer information. This table summarizes the characteristics of all HCV-infected subjects who were profiled in this study, including age, gender, viral subtype and multimers used for sorting.
Supplementary Table 2. Chromatin accessible regions (ChARs). This table lists the 128,327 Chromatin Accessible Regions identified in CD8+ T cells in this study. Each row represents a ChAR, and the columns contain the normalized number of ATAC-Seq cuts, along with log2 fold changes and FDRs of differential accessibility for relevant comparisons (calculated by DESeq2).
Supplementary Table 3. Summary of all chronic-infection related GWAS SNPs. This table lists all GWAS SNPs that were included as chronic infection-related (those mapping to following traits: “AIDS”, “Chronic hepatitis B virus infection”, “Hepatitis B virus infection”, “Hepatitis C virus infection”, “HIV infection”, “HIV-1 infection”). Columns represent the associated GWAS catalog details including details of the study, SNP ID, chromosomal location and P-value.
Supplementary Table 4. HIV-infected patient characteristics and multimer information. This table summarizes the characteristics of all HIV-infected subjects who were profiled in this study, including age, gender, viral subtype, viral load, CD4+ T cell count and multimers used for sorting.
Supplementary Table 5. Summary of all sets of chromatin accessible regions (ChARs). This table lists the various groups of ChARs (scarred, reversed, gained etc.) specifically analyzed across multiple time-points in this study.
Acknowledgements
The authors thank members of the Haining laboratory for their input, and the research subjects for their participation. This work was supported by NIH grants U19 AI086230 and funding from the Parker Institute for Cancer Immunotherapy. S.A.W. was supported by T32 GM007753 and T32 CA207021. R.T.C. was supported by AI136715, and the MGH Research Scholars Program. The authors also thank the Center for Virology and Vaccine Research Flow Cytometry Core at Beth Israel Deaconess Medical Center for their assistance.
Footnotes
Competing interests
AbbVie sponsored the clinical trial (NCT02476617) and gave input to trial design and clinical and biological sample collection schedule. W.N.H. is an employee of Merck and Company and holds equity in Tango Therapeutics and Arsenal Biosciences. The authors declare no other competing interests.
Data Availability
All sequencing data from this study will be made publicly available through the National Center for Biotechnology Information (NCBI) Gene Expression Omnibus (GEO) and/or NCBI database of Genotypes and Phenotypes (dbGaP). All other relevant data are available from the corresponding authors on request.
References
- 1.Hashimoto M et al. CD8 T Cell Exhaustion in Chronic Infection and Cancer: Opportunities for Interventions. Annu Rev Med 69, 301–318, doi: 10.1146/annurev-med-012017-043208 (2018). [DOI] [PubMed] [Google Scholar]
- 2.Wherry EJ et al. Molecular signature of CD8+ T cell exhaustion during chronic viral infection. Immunity 27, 670–684, doi: 10.1016/j.immuni.2007.09.006 (2007). [DOI] [PubMed] [Google Scholar]
- 3.Doering TA et al. Network analysis reveals centrally connected genes and pathways involved in CD8+ T cell exhaustion versus memory. Immunity 37, 1130–1144, doi: 10.1016/j.immuni.2012.08.021 (2012). [DOI] [PMC free article] [PubMed] [Google Scholar]
- 4.Sen DR et al. The epigenetic landscape of T cell exhaustion. Science 354, 1165–1169, doi: 10.1126/science.aae0491 (2016). [DOI] [PMC free article] [PubMed] [Google Scholar]
- 5.Gallimore A et al. Induction and exhaustion of lymphocytic choriomeningitis virus-specific cytotoxic T lymphocytes visualized using soluble tetrameric major histocompatibility complex class I-peptide complexes. J Exp Med 187, 1383–1393 (1998). [DOI] [PMC free article] [PubMed] [Google Scholar]
- 6.Zajac AJ et al. Viral immune evasion due to persistence of activated T cells without effector function. J Exp Med 188, 2205–2213 (1998). [DOI] [PMC free article] [PubMed] [Google Scholar]
- 7.Wherry EJ, Blattman JN, Murali-Krishna K, van der Most R & Ahmed R Viral persistence alters CD8 T-cell immunodominance and tissue distribution and results in distinct stages of functional impairment. J Virol 77, 4911–4927 (2003). [DOI] [PMC free article] [PubMed] [Google Scholar]
- 8.Blackburn SD et al. Coregulation of CD8+ T cell exhaustion by multiple inhibitory receptors during chronic viral infection. Nat Immunol 10, 29–37, doi: 10.1038/ni.1679 (2009). [DOI] [PMC free article] [PubMed] [Google Scholar]
- 9.Day CL et al. PD-1 expression on HIV-specific T cells is associated with T-cell exhaustion and disease progression. Nature 443, 350–354, doi: 10.1038/nature05115 (2006). [DOI] [PubMed] [Google Scholar]
- 10.Gruener NH et al. Sustained dysfunction of antiviral CD8+ T lymphocytes after infection with hepatitis C virus. J Virol 75, 5550–5558, doi: 10.1128/JVI.75.12.5550-5558.2001 (2001). [DOI] [PMC free article] [PubMed] [Google Scholar]
- 11.Wedemeyer H et al. Impaired effector function of hepatitis C virus-specific CD8+ T cells in chronic hepatitis C virus infection. J Immunol 169, 3447–3458 (2002). [DOI] [PubMed] [Google Scholar]
- 12.Radziewicz H et al. Liver-infiltrating lymphocytes in chronic human hepatitis C virus infection display an exhausted phenotype with high levels of PD-1 and low levels of CD127 expression. J Virol 81, 2545–2553, doi: 10.1128/JVI.02021-06 (2007). [DOI] [PMC free article] [PubMed] [Google Scholar]
- 13.Wolski D et al. Early Transcriptional Divergence Marks Virus-Specific Primary Human CD8(+) T Cells in Chronic versus Acute Infection. Immunity 47, 648–663 e648, doi: 10.1016/j.immuni.2017.09.006 (2017). [DOI] [PMC free article] [PubMed] [Google Scholar]
- 14.Micallef JM, Kaldor JM & Dore GJ Spontaneous viral clearance following acute hepatitis C infection: a systematic review of longitudinal studies. J Viral Hepat 13, 34–41, doi: 10.1111/j.1365-2893.2005.00651.x (2006). [DOI] [PubMed] [Google Scholar]
- 15.Cox AL et al. Cellular immune selection with hepatitis C virus persistence in humans. J Exp Med 201, 1741–1752, doi: 10.1084/jem.20050121 (2005). [DOI] [PMC free article] [PubMed] [Google Scholar]
- 16.Kuntzen T et al. Viral sequence evolution in acute hepatitis C virus infection. J Virol 81, 11658–11668, doi: 10.1128/JVI.00995-07 (2007). [DOI] [PMC free article] [PubMed] [Google Scholar]
- 17.Rutebemberwa A et al. High-programmed death-1 levels on hepatitis C virus-specific T cells during acute infection are associated with viral persistence and require preservation of cognate antigen during chronic infection. J Immunol 181, 8215–8225, doi: 10.4049/jimmunol.181.12.8215 (2008). [DOI] [PMC free article] [PubMed] [Google Scholar]
- 18.Feld JJ et al. Treatment of HCV with ABT-450/r-ombitasvir and dasabuvir with ribavirin. N Engl J Med 370, 1594–1603, doi: 10.1056/NEJMoa1315722 (2014). [DOI] [PubMed] [Google Scholar]
- 19.Ferenci P et al. ABT-450/r-ombitasvir and dasabuvir with or without ribavirin for HCV. N Engl J Med 370, 1983–1992, doi: 10.1056/NEJMoa1402338 (2014). [DOI] [PubMed] [Google Scholar]
- 20.Baumert TF, Berg T, Lim JK & Nelson DR Status of Direct-Acting Antiviral Therapy for Hepatitis C Virus Infection and Remaining Challenges. Gastroenterology 156, 431–445, doi: 10.1053/j.gastro.2018.10.024 (2019). [DOI] [PMC free article] [PubMed] [Google Scholar]
- 21.Wieland D et al. TCF1(+) hepatitis C virus-specific CD8(+) T cells are maintained after cessation of chronic antigen stimulation. Nat Commun 8, 15050, doi: 10.1038/ncomms15050 (2017). [DOI] [PMC free article] [PubMed] [Google Scholar]
- 22.Hensel N et al. Memory-like HCV-specific CD8(+) T cells retain a molecular scar after cure of chronic HCV infection. Nat Immunol 22, 229–239, doi: 10.1038/s41590-020-00817-w (2021). [DOI] [PubMed] [Google Scholar]
- 23.Joshi NS et al. Inflammation directs memory precursor and short-lived effector CD8(+) T cell fates via the graded expression of T-bet transcription factor. Immunity 27, 281–295, doi: 10.1016/j.immuni.2007.07.010 (2007). [DOI] [PMC free article] [PubMed] [Google Scholar]
- 24.Martinez GJ et al. The transcription factor NFAT promotes exhaustion of activated CD8(+) T cells. Immunity 42, 265–278, doi: 10.1016/j.immuni.2015.01.006 (2015). [DOI] [PMC free article] [PubMed] [Google Scholar]
- 25.Gate RE et al. Genetic determinants of co-accessible chromatin regions in activated T cells across humans. Nat Genet 50, 1140–1150, doi: 10.1038/s41588-018-0156-2 (2018). [DOI] [PMC free article] [PubMed] [Google Scholar]
- 26.Rasool ST et al. Increased level of IL-32 during human immunodeficiency virus infection suppresses HIV replication. Immunol Lett 117, 161–167, doi: 10.1016/j.imlet.2008.01.007 (2008). [DOI] [PubMed] [Google Scholar]
- 27.El-Far M et al. Proinflammatory isoforms of IL-32 as novel and robust biomarkers for control failure in HIV-infected slow progressors. Sci Rep 6, 22902, doi: 10.1038/srep22902 (2016). [DOI] [PMC free article] [PubMed] [Google Scholar]
- 28.Nguyen S et al. Elite control of HIV is associated with distinct functional and transcriptional signatures in lymphoid tissue CD8(+) T cells. Sci Transl Med 11, doi: 10.1126/scitranslmed.aax4077 (2019). [DOI] [PMC free article] [PubMed] [Google Scholar]
- 29.Zaidan SM et al. Upregulation of IL-32 Isoforms in Virologically Suppressed HIV-Infected Individuals: Potential Role in Persistent Inflammation and Transcription From Stable HIV-1 Reservoirs. J Acquir Immune Defic Syndr 82, 503–513, doi: 10.1097/QAI.0000000000002185 (2019). [DOI] [PMC free article] [PubMed] [Google Scholar]
- 30.Chinnaswamy S Genetic variants at the IFNL3 locus and their association with hepatitis C virus infections reveal novel insights into host-virus interactions. J Interferon Cytokine Res 34, 479–497, doi: 10.1089/jir.2013.0113 (2014). [DOI] [PMC free article] [PubMed] [Google Scholar]
- 31.Monteleone K et al. Interleukin-32 isoforms: expression, interaction with interferon-regulated genes and clinical significance in chronically HIV-1-infected patients. Med Microbiol Immunol 203, 207–216, doi: 10.1007/s00430-014-0329-2 (2014). [DOI] [PubMed] [Google Scholar]
- 32.Wherry EJ & Kurachi M Molecular and cellular insights into T cell exhaustion. Nat Rev Immunol 15, 486–499, doi: 10.1038/nri3862 (2015). [DOI] [PMC free article] [PubMed] [Google Scholar]
- 33.Whyte WA et al. Master transcription factors and mediator establish super-enhancers at key cell identity genes. Cell 153, 307–319, doi: 10.1016/j.cell.2013.03.035 (2013). [DOI] [PMC free article] [PubMed] [Google Scholar]
- 34.Chipumuro E et al. CDK7 inhibition suppresses super-enhancer-linked oncogenic transcription in MYCN-driven cancer. Cell 159, 1126–1139, doi: 10.1016/j.cell.2014.10.024 (2014). [DOI] [PMC free article] [PubMed] [Google Scholar]
- 35.Adam RC et al. Pioneer factors govern super-enhancer dynamics in stem cell plasticity and lineage choice. Nature 521, 366–370, doi: 10.1038/nature14289 (2015). [DOI] [PMC free article] [PubMed] [Google Scholar]
- 36.Vahedi G et al. Super-enhancers delineate disease-associated regulatory nodes in T cells. Nature 520, 558–562, doi: 10.1038/nature14154 (2015). [DOI] [PMC free article] [PubMed] [Google Scholar]
- 37.Ma S et al. Chromatin Potential Identified by Shared Single-Cell Profiling of RNA and Chromatin. Cell 183, 1103–1116 e1120, doi: 10.1016/j.cell.2020.09.056 (2020). [DOI] [PMC free article] [PubMed] [Google Scholar]
- 38.Khan O et al. TOX transcriptionally and epigenetically programs CD8(+) T cell exhaustion. Nature 571, 211–218, doi: 10.1038/s41586-019-1325-x (2019). [DOI] [PMC free article] [PubMed] [Google Scholar]
- 39.Scott AC et al. TOX is a critical regulator of tumour-specific T cell differentiation. Nature 571, 270–274, doi: 10.1038/s41586-019-1324-y (2019). [DOI] [PMC free article] [PubMed] [Google Scholar]
- 40.Alfei F et al. TOX reinforces the phenotype and longevity of exhausted T cells in chronic viral infection. Nature 571, 265–269, doi: 10.1038/s41586-019-1326-9 (2019). [DOI] [PubMed] [Google Scholar]
- 41.Urbani S et al. PD-1 expression in acute hepatitis C virus (HCV) infection is associated with HCV-specific CD8 exhaustion. J Virol 80, 11398–11403, doi: 10.1128/JVI.01177-06 (2006). [DOI] [PMC free article] [PubMed] [Google Scholar]
- 42.Bengsch B et al. Coexpression of PD-1, 2B4, CD160 and KLRG1 on exhausted HCV-specific CD8+ T cells is linked to antigen recognition and T cell differentiation. PLoS Pathog 6, e1000947, doi: 10.1371/journal.ppat.1000947 (2010). [DOI] [PMC free article] [PubMed] [Google Scholar]
- 43.Pauken KE et al. Epigenetic stability of exhausted T cells limits durability of reinvigoration by PD-1 blockade. Science 354, 1160–1165, doi: 10.1126/science.aaf2807 (2016). [DOI] [PMC free article] [PubMed] [Google Scholar]
- 44.Miller BC et al. Subsets of exhausted CD8(+) T cells differentially mediate tumor control and respond to checkpoint blockade. Nat Immunol 20, 326–336, doi: 10.1038/s41590-019-0312-6 (2019). [DOI] [PMC free article] [PubMed] [Google Scholar]
- 45.Alatrakchi N et al. Hepatitis C virus (HCV)-specific CD8+ cells produce transforming growth factor beta that can suppress HCV-specific T-cell responses. J Virol 81, 5882–5892, doi: 10.1128/JVI.02202-06 (2007). [DOI] [PMC free article] [PubMed] [Google Scholar]
- 46.Brooks DG et al. Interleukin-10 determines viral clearance or persistence in vivo. Nat Med 12, 1301–1309, doi: 10.1038/nm1492 (2006). [DOI] [PMC free article] [PubMed] [Google Scholar]
- 47.Ejrnaes M et al. Resolution of a chronic viral infection after interleukin-10 receptor blockade. J Exp Med 203, 2461–2472, doi: 10.1084/jem.20061462 (2006). [DOI] [PMC free article] [PubMed] [Google Scholar]
- 48.Tinoco R, Alcalde V, Yang Y, Sauer K & Zuniga EI Cell-intrinsic transforming growth factor-beta signaling mediates virus-specific CD8+ T cell deletion and viral persistence in vivo. Immunity 31, 145–157, doi: 10.1016/j.immuni.2009.06.015 (2009). [DOI] [PMC free article] [PubMed] [Google Scholar]
- 49.Kroy DC et al. Liver environment and HCV replication affect human T-cell phenotype and expression of inhibitory receptors. Gastroenterology 146, 550–561, doi: 10.1053/j.gastro.2013.10.022 (2014). [DOI] [PMC free article] [PubMed] [Google Scholar]
- 50.Lynn RC et al. c-Jun overexpression in CAR T cells induces exhaustion resistance. Nature 576, 293–300, doi: 10.1038/s41586-019-1805-z (2019). [DOI] [PMC free article] [PubMed] [Google Scholar]
- 51.Rutishauser RL et al. Early and Delayed Antiretroviral Therapy Results in Comparable Reductions in CD8(+) T Cell Exhaustion Marker Expression. AIDS Res Hum Retroviruses 33, 658–667, doi: 10.1089/AID.2016.0324 (2017). [DOI] [PMC free article] [PubMed] [Google Scholar]
- 52.Youngblood B et al. Cutting edge: Prolonged exposure to HIV reinforces a poised epigenetic program for PD-1 expression in virus-specific CD8 T cells. J Immunol 191, 540–544, doi: 10.4049/jimmunol.1203161 (2013). [DOI] [PMC free article] [PubMed] [Google Scholar]
- 53.Investigators ST et al. Short-course antiretroviral therapy in primary HIV infection. N Engl J Med 368, 207–217, doi: 10.1056/NEJMoa1110039 (2013). [DOI] [PMC free article] [PubMed] [Google Scholar]
- 54.Hoffmann M et al. Exhaustion of Activated CD8 T Cells Predicts Disease Progression in Primary HIV-1 Infection. PLoS Pathog 12, e1005661, doi: 10.1371/journal.ppat.1005661 (2016). [DOI] [PMC free article] [PubMed] [Google Scholar]
- 55.Amemiya HM, Kundaje A & Boyle AP The ENCODE Blacklist: Identification of Problematic Regions of the Genome. Sci Rep 9, 9354, doi: 10.1038/s41598-019-45839-z (2019). [DOI] [PMC free article] [PubMed] [Google Scholar]
Associated Data
This section collects any data citations, data availability statements, or supplementary materials included in this article.
Supplementary Materials
Supplementary Table 1. HCV-infected patient characteristics and multimer information. This table summarizes the characteristics of all HCV-infected subjects who were profiled in this study, including age, gender, viral subtype and multimers used for sorting.
Supplementary Table 2. Chromatin accessible regions (ChARs). This table lists the 128,327 Chromatin Accessible Regions identified in CD8+ T cells in this study. Each row represents a ChAR, and the columns contain the normalized number of ATAC-Seq cuts, along with log2 fold changes and FDRs of differential accessibility for relevant comparisons (calculated by DESeq2).
Supplementary Table 3. Summary of all chronic-infection related GWAS SNPs. This table lists all GWAS SNPs that were included as chronic infection-related (those mapping to following traits: “AIDS”, “Chronic hepatitis B virus infection”, “Hepatitis B virus infection”, “Hepatitis C virus infection”, “HIV infection”, “HIV-1 infection”). Columns represent the associated GWAS catalog details including details of the study, SNP ID, chromosomal location and P-value.
Supplementary Table 4. HIV-infected patient characteristics and multimer information. This table summarizes the characteristics of all HIV-infected subjects who were profiled in this study, including age, gender, viral subtype, viral load, CD4+ T cell count and multimers used for sorting.
Supplementary Table 5. Summary of all sets of chromatin accessible regions (ChARs). This table lists the various groups of ChARs (scarred, reversed, gained etc.) specifically analyzed across multiple time-points in this study.
Data Availability Statement
All sequencing data from this study will be made publicly available through the National Center for Biotechnology Information (NCBI) Gene Expression Omnibus (GEO) and/or NCBI database of Genotypes and Phenotypes (dbGaP). All other relevant data are available from the corresponding authors on request.


