

Abstract
One of the biggest unsolved questions in neuroscience is how molecules and neuronal circuitry create behaviors, and how their misregulation or dysfunction results in neurological disease. Light microscopy is a vital tool for the study of neural molecules and circuits. However, the fundamental optical diffraction limit precludes the use of conventional light microscopy for sufficient characterization of critical signaling compartments and nanoscopic organizations of synapse-associated molecules. We have witnessed rapid development of super-resolution microscopy methods that circumvent the resolution limit by controlling the number of emitting molecules in specific imaging volumes and allow highly resolved imaging in the 10–100 nm range. Most recently, Expansion Microscopy (ExM) emerged as an alternative solution to overcome the diffraction limit by physically magnifying biological specimens, including nervous systems. Here, we discuss how ExM works in general and currently available ExM methods. We then review ExM imaging in a wide range of nervous systems, including Caenorhabditis elegans, Drosophila, zebrafish, mouse, and human, and their applications to synaptic imaging, neuronal tracing, and the study of neurological disease. Finally, we provide our prospects for expansion microscopy as a powerful nanoscale imaging tool in the neurosciences.
Keywords: Expansion microscopy, Super-resolution imaging, Super-resolution microscopy, Neuroscience, Nanoscale imaging, Fluorescent imaging, Optical imaging, Synaptic imaging, Neuron tracing, Large volume imaging, Neural disease
1. Introduction
Many questions remain unanswered in neuroscience. For example, the molecular changes underlying the processes of learning and neurological disorder have yet to be fully understood. Additionally, at a larger scale it is still not clear how neurons wire to form various nerve systems with vastly different complexities, or how these circuits of neurons compute and lead to behaviors. To address these questions, one of the essential unmet needs is to completely map the organization of molecules and cells within neural circuits, a blueprint that is critical for understanding how complex brain functions arise. In neuroscience, optical microscopy has been a highly valuable tool for imaging nervous systems for over a hundred years.
Since the era of Ramón y Cajal and Camillo Golgi, optical microscopy has revealed brain anatomy and functions in great detail. Optical microscopy can be used in vivo, interrogate tissue in large volumes, and reveal features of individual neurons and neural circuits. Modern molecular and cellular neuroscience have discovered numerous synapse-associated proteins that shape basic neuronal transmission of information. These proteins are localized within nanoscopic core signaling compartments of neural circuits such as axons, presynaptic active zones, postsynaptic densities, and dendritic spines. Information regarding the localization and positional relationships of these proteins is essential to understanding their precise functions. Unfortunately, the ultimate resolution of conventional optical microscopes (e.g., widefield, laser scanning/spinning disk confocal and light-sheet microscopes) is governed by the fundamental optical diffraction limit (~200 nm), thus precluding analyses of these highly compressed key neuronal structural components. In contrast, electron microscopy provides sub-atomic resolution 2–3 orders of magnitude better than optical microscopy, and recently has resolved the wiring diagrams of some neural circuits in a very small volume (Eichler et al., 2017; Kasthuri et al., 2015). However, electron microscopy mostly reveals morphometric information and provides little information of specific molecules.
The development of far-field super-resolution microscopy is one of the most revolutionary breakthroughs in molecular and cellular biology in the 21st century. Super-resolution microscopy has provided researchers with powerful new means to circumvent the physical diffraction limit. Currently, several important types of super-resolution microscopy techniques have been developed, including structured illumination microscopy (SIM) (Gustafsson, 2000), stimulated emission depletion microscopy (STED) (Hell, 2007; Hell and Wichmann, 1994), and photoactivated localization microscopy (PALM) (Betzig et al., 2006)/stochastic optical reconstruction microscopy (STORM) (Rust et al., 2006), each with unique characteristics and features. Super resolution microscopy techniques have been quickly adapted for neuroscience applications (Kittel et al., 2006; Tønnesen and Nägerl, 2013; Willig et al., 2006), discovering new structures and functions about specific molecules important to neural function. We expect these techniques to have a long-lasting impact on neuroscience. Despite increasing popularity of super-resolution microscopy in the research community, the majority of super resolution microscopy methods require specialized hardware and/or software to operate. Most of them also have slow acquisition times and are challenging to use for nanoscale imaging of tissue samples, especially in large volume.
Expansion microscopy (ExM) is an emerging technology initially developed in the Boyden Laboratory that overcomes limitations of optical super-resolution techniques by physically expanding tissue samples with a water-swellable polymer (Chen et al., 2015) by 4–5× linearly in each dimension (by 64–125× in volume) in pure water (Wassie et al., 2019). This allows super-resolution imaging of biological specimens with reagents and hardware that most biological laboratories already have access to. Because conventional optical microscopes can image quickly, ExM greatly facilitates nanoscale resolution imaging of large specimens. In addition, the fully expanded tissue-gel is more than 98% water by volume, thus rendering the specimen transparent and dramatically reducing optical aberrations even deep into tissue.
In its brief history, ExM has been used in a broad array of neuroscience applications. In this review, we will discuss recent technical advances in ExM that better position it as an increasingly popular technique in neuroscience, how it has been utilized by neuroscientists thus far, and where we believe the future of the burgeoning field lays.
2. Principle of ExM
Technological development of ExM has proceeded rapidly, with numerous protocol advancements published in the first half-decade of its existence designed to improve the range of biomolecules that can be incorporated into the gel network as well as the resolving power of ExM. While a complete accounting of these advances is beyond the scope of this review (for a more thorough discussion on the principles behind individual ExM protocols, please refer to (Klimas and Zhao, 2020; Wassie et al., 2019)). We will briefly review general principles common to most ExM protocols and highlight those with a particular relevance to neuroscience research.
2.1. General workflow
All ExM protocols follow a general workflow that involves the following steps: (1) infusion and synthesis of gel throughout the specimen (we call it gelling); (2) anchoring key biomolecules to the gel; (3) homogenization of the specimen enzymatically (often with Proteinase K) or mechanically (i.e., softening the specimen by disrupting key protein-protein interactions that are not needed), and (4) physical expansion of the specimen (Fig. 1). All four steps are carefully designed to facilitate expansion as isotropically as possible. The low distortion of expansion process has been confirmed in various types of specimens from different species (Bucur et al., 2020; Chen et al., 2016, 2015; Chozinski et al., 2016; Tillberg et al., 2016; Zhao et al., 2017). Most ExM methods use poly (acrylate-co-acrylamide) gel that enables expansion of the sample size up to ~4.5× in the linear dimension (e.g., for a 270-nm resolution objective, the new effective resolution would become 270 / ~4.5 = ~60 nm).
Fig. 1.
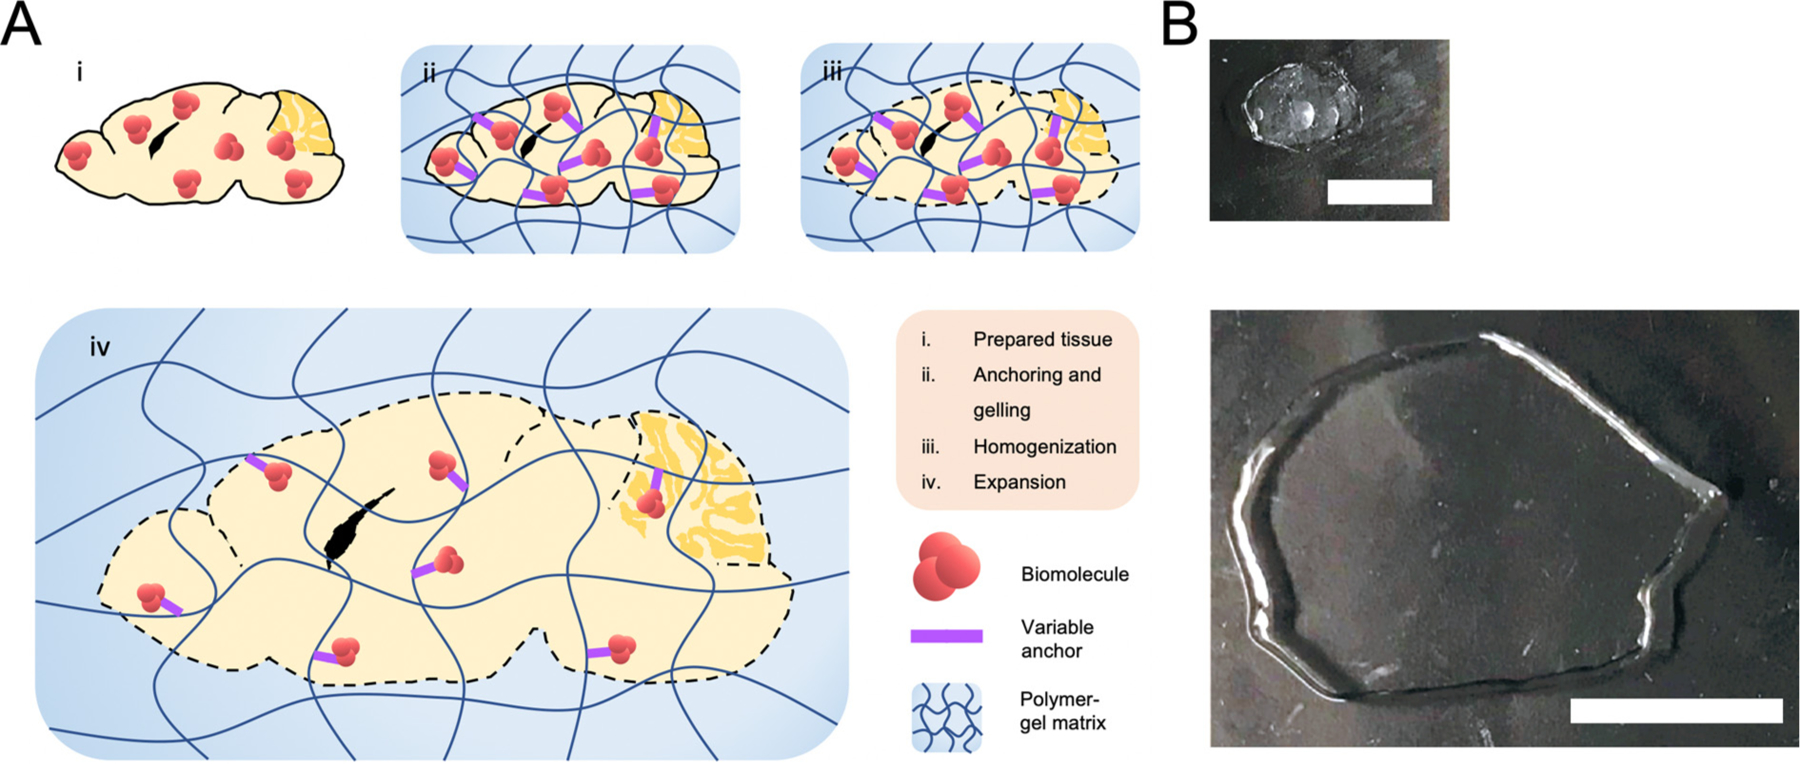
Basic principles of expansion microscopy. (A) The general protocol of expansion microscopy demonstrated in the mouse brain. Biomolecule labeling may occur after steps (i) or (iii). (B) Two sections of mouse brain at various stages of the expansion protocol. Top: Tissue has undergone the biomolecule-anchoring and gelling step (step (ii)). Bottom: The tissue has undergone the homogenization step and has been expanded ~4-fold (step (iv)). Scale bar: 2.5 mm (pre-expansion); 5 mm (post-expansion). Adapted from ref. (Klimas et al., 2019).
2.2. Strategies for biomolecule retention
To prevent biomolecules being displaced in the expansion process, sample pretreatment with anchoring reagents that link biomolecules such as proteins (including fluorescent proteins, antibodies, and streptavidin), nucleic acids, and lipids to the polymer is required. In the earliest ExM protocol, the spatial information of biomolecules of interest is transferred to the gel through the use of oligo-conjugated secondary antibodies and reverse-complement trifunctional fluorescent oligos containing a gel-anchorable methacryloyl group (Chen et al., 2015). The requirement for customized oligo-conjugated antibodies and trifunctional oligo limits the application of the earliest version of ExM in neuroscience and other areas. More recently, strategies have been developed to directly link biomolecules of interest to the gel network by using variable bifunctional anchors containing (i) a free-radical reactive group to covalently bond to the gel during polymerization and (ii) biomolecule reactive groups. Direct protein retention has been accomplished through the use of succinimidyl esters as the biomolecule reactive group to react with primary amines on the surface of proteins (Chozinski et al., 2016; Tillberg et al., 2016). Because antibodies are proteins, both groups demonstrated imaging of expanded mouse brain tissues that were immunostained with only commercially available primary antibodies and fluorescent secondary antibodies applied before expansion. The Boyden group also demonstrated the retention of signal from endogenous fluorescent proteins in their protocol (ProExM), opening the door for ExM to be used in a much broader array of neuroscience experiments that include transgenic animals and viral expression vectors without additional immunostaining (although additional immunostaining can be used to increase the signal intensity) (Tillberg et al., 2016).
As proteins were directly anchored into the gel, it was hypothesized that protein epitopes may be preserved for post-expansion immunostaining if no proteinase K was applied. This hypothesis was tested using two different milder homogenization methods: The first method denatures and hydrolyzes tissue proteins by incubating the specimen in an alkaline detergent solution at around 120 °C; The second method uses LysC, a more specific protease than proteinase K, to digest proteins of the specimen into larger protein fragments that better conserve epitopes (Tillberg et al., 2016). Both methods only achieved limited success in post-expansion immunostaining for a subset of protein targets due to incomplete conservation of epitopes. The Chung group also independently reported a heat denaturation approach for mechanical homogenization to achieve post-expansion labeling. Interestingly, they avoided using conventional paraformaldehyde (PFA) fixation that induces protein-protein crosslinking to preserve specimens. Instead, their PFA solution contains high concentrations of acrylamide that react with protein-bound PFA and prevents PFA-induced crosslinking prior to gelling (Ku et al., 2016). With minimal amount of crosslinking, the gelled specimens were efficiently homogenized by hot detergent solution and the epitopes were better preserved. This method, called magnified analysis of the proteome (MAP), had better success in post-expansion immunolabeling in mouse brain tissues, as 100 out of 122 antibodies tested were compatible, suggesting minimal epitope loss. As the antibodies were not covalently linked to the gel, they could be removed with a denaturant solution, and new antibodies could be applied to the same sample. In this way, highly multiplexed super-resolution images could be acquired with commercially available antibodies and conventional microscopes. Post-expansion labeling and the generation of highly multiplexed images in expanded samples have since been demonstrated on numerous occasions (Gambarotto et al., 2019; M’Saad and Bewersdorf, 2020; Saka et al., 2019; Zwettler et al., 2020).
In addition to proteins, the spatial arrangement of RNA molecules in the brain at both the cellular and subcellular scales are vital for normal neural functioning. The Boyden lab developed a small-molecule linker, dubbed LabelX, a reagent yielded by reactions between two commercially available chemicals, AcX (anchoring reagent of proExM) and Label IT, that covalently attaches to RNA and DNA primarily at guanine residues through an alkylating group (Chen et al., 2016). With LabelX treatment, RNA molecules can be conserved after expansion, which enables multiple FISH strategies to probe the identity and location of the RNA in neural tissue (Chen et al., 2016). This technology, called ExFISH, demonstrated standard single-molecule FISH for visualizing long non-coding RNAs, signal-amplified FISH and multiplexed single-molecule FISH by iterative rounds of probing and washing. It is worth noting that another group developed a different approach to retain the information of target RNA after expansion by anchoring the RNA FISH probe itself to the gel (Tsanov et al., 2016). Because RNA molecules are washed away after expansion, the method can only be used to image RNAs targeted pre-expansion, without the option of multiplexing.
Together, these advancements in direct biomolecule anchoring have greatly improved the accessibility of ExM as a super-resolution technique to any biological laboratory.
2.3. Improvements in image resolution of ExM
The effective resolution provided by an ExM method is mainly determined by the extent to which the gel itself can expand (i.e. expansion factor). Higher expansion factor leads to higher effective resolution, assuming the mechanic homogenization is complete. Two strategies have been explored to increase the expansion factor of a gel. The first method, called iterative expansion microscopy (iExM), expands the same tissue specimen multiple times (Chang et al., 2017). These successive rounds of 4.5-fold expansion on the same tissue sample achieve a total of 4.5 × 4.5 = ~20-fold expansion, and therefore ~25 nm effective resolution (Chang et al., 2017). This process relies on oligo-conjugated antibodies similarly to the first ExM protocol. A follow up work combined the concept multiple rounds of expansion (through semi-interpenetrating polymer networks) and bulk staining of the proteome through NHS-ester staining to achieve high contrast images of ~13–21-fold expanded cultured cells in their ultrastructural context, reminiscent of electron microscopy (M’Saad and Bewersdorf, 2020).
While iExM achieves 25 nm resolution by multiple rounds of expansion and custom oligonucleotide conjugated antibodies, the expansion factor can also be adjusted by simply changing the gel chemistry. In principle, one can simply reduce the concentration of crosslinker between polymer chains to increase the expansion factor, but such change reduces the mechanic strength of the gel and thus renders the gel difficult to handle. The Rizzoli group took a different approach and modified the monomer composition of the gel, utilizing N,N-dimethylacrylamide acid (DMAA) crosslinked with sodium acrylate to produce a gel that expands 10-fold in a single expansion step, in a process they called X10 microscopy (Truckenbrodt et al., 2019, 2018). X10 has been demonstrated in cell culture and mouse brain tissues. X10 requires very strong proteinase K digestion to enable expansion of specimens, probably due to the dense gel network (Cipriano et al., 2014). The distortion level has been measured in cultured cells and is similar to other ExM variants. Further isotropy measurement and refinement of X10 protocol in brain tissues would be useful for neuroscience applications.
A notable feature of ExM is that it is a physical, rather than optical, process. This means that, in theory, ExM is entirely orthogonal to optical super-resolution techniques and can be used in combination with them. To date, SIM (Halpern et al., 2017), STED (Gao et al., 2018), PALM (Tillberg et al., 2016), and STORM (Xu et al., 2019; Zwettler et al., 2020) have been demonstrated on expanded samples. However, the short working distances used in these optical super-resolution techniques, excluding SIM, are compounded by the increase in size of expanded samples. This makes them generally practical for use only in cell culture and neutralizes one of the main benefits ExM: super-resolution imaging deep in tissue.
3. ExM applications in neuroscience
While expansion microscopy is still a young technique, its applications in neuroscience are growing rapidly. We sample the current literature to give a sense of how researchers are using expansion to aid studies of the brain, but we recognize that the following section is not exhaustive of the impressive body of work in the field at the time of this publication. Here, we discuss the applications of ExM in synapse imaging, neuron tracing and imaging over large volumes of tissue, and the studies of neurological disease.
3.1. Synapse imaging
The utility of expansion microscopy in the imaging of synapses was demonstrated from its inception (Chen et al., 2015). Using the custom oligonucleotide-conjugated antibodies, pre- and postsynaptic scaffolding proteins bassoon and homer1 could be clearly resolved in their respective compartments in mouse brain tissue (Fig. 2A–C). More robust putative synapse identification was now possible, whereas the two labels were indistinguishable in space pre-expansion. Likewise, the bassoon and homer1 synaptic pair was one of the early demonstrations of direct expansion of proteins (Chozinski et al., 2016). Since then, expansion microscopy has been used to study synapses in a number of model organisms including larval and adult Drosophila brains (Jiang et al., 2018; Mosca et al., 2017), C. elegans (Yu et al., 2020), planarian glia (Wang et al., 2016), and larval zebrafish (Freifeld et al., 2017).
Fig. 2.
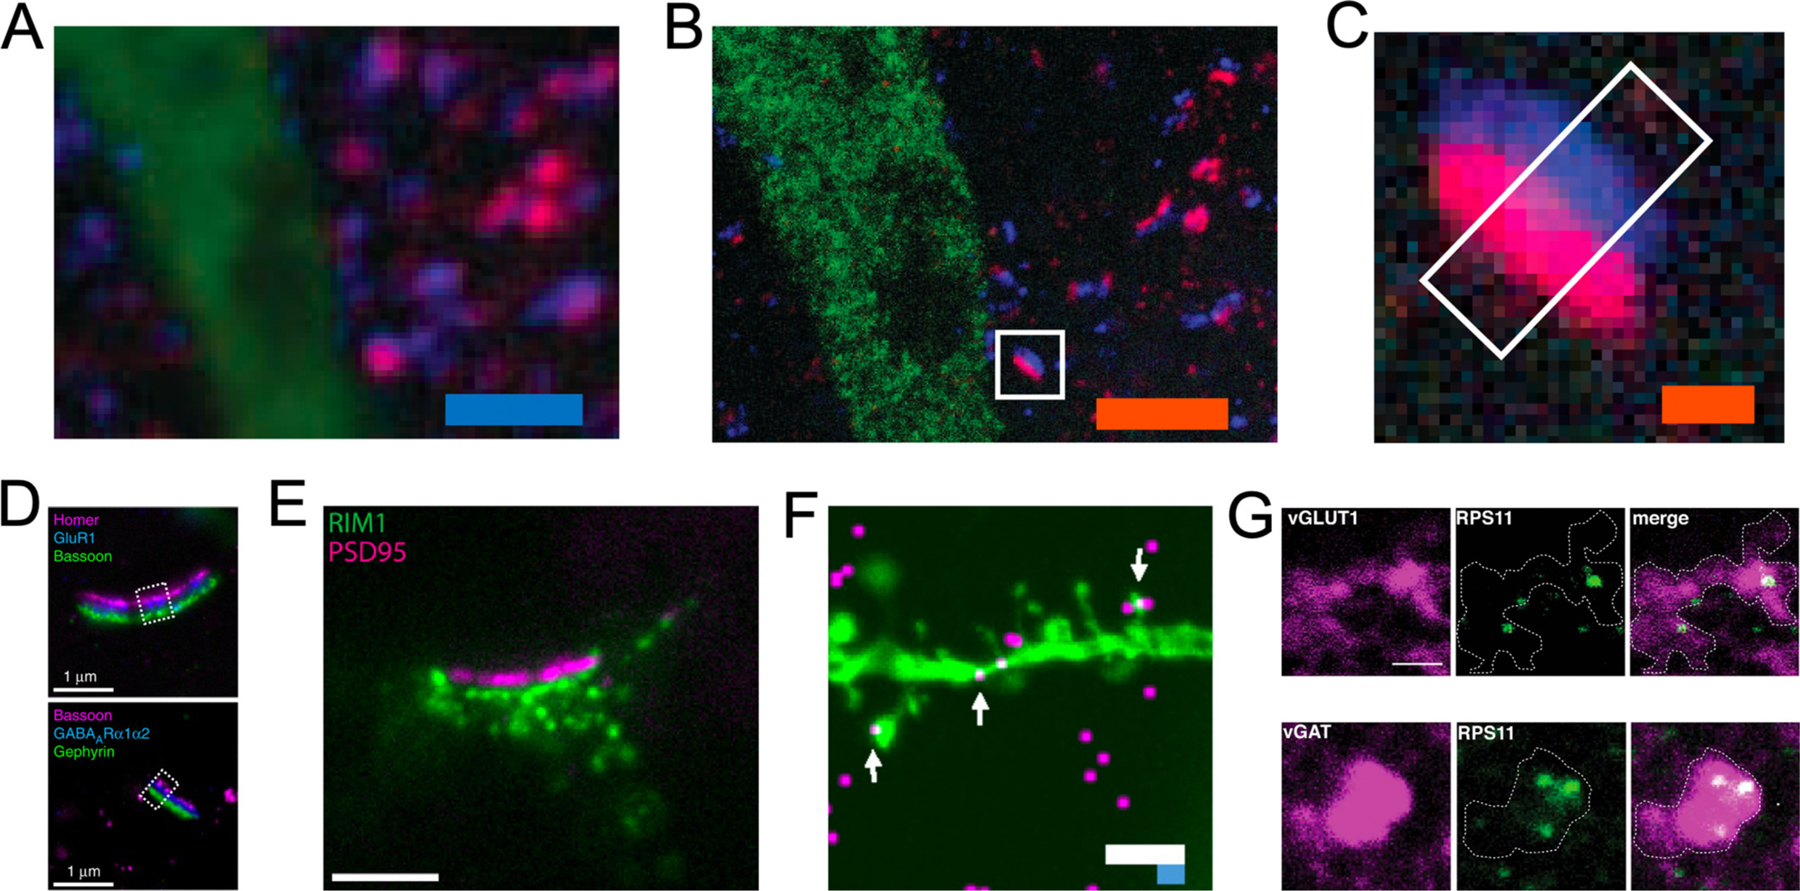
Expansion microscopy resolves synapses on conventional light microscopes. (A and B) Confocal fluorescence images of mouse brain section stained with presynaptic (anti-Bassoon, blue) and postsynaptic (anti-Homer1, red) markers, in addition to antibody to GFP (green) to label Thy-YFP neurons, pre- (A) versus post- (B) expansion. (C) Single representative synapse highlighted in (B). Adapted from ref. Chen et al., 2015. (D) Top: Epifluorescence image of cultured hippocampal neurons stained with antibodies against Homer1 (magenta), glutamate receptor 1 (GluR1, blue), and Bassoon (green), after ~13-fold expansion via iExM and DNA-hybridization-based signal amplification. Bottom: As in the top panel, but stained with antibodies against Bassoon (magenta), GABAARα1/α2 (blue), and Gephyrin (green). Adapted from ref. Chang et al., 2017. (E) Representative images of an immunostaining for pre-synaptic RIM1/2 and post-synaptic PSD95 in X10 expanded cell culture. Adapted from ref. Truckenbrodt et al., 2018. (F) Camk2a mRNA (magenta) resolved in dendritic spines and processes (green) by expansion fluorescent in situ hybridization. Adapted from Chen et al., 2016. (G) Representative images of expanded presynaptic compartments in mouse brain tissue, chosen for their positive (top) vGLUT1+ or (bottom) vGAT+ signal (magenta), showing the presence of small ribosomal proteins (green). Adapted from ref. Hafner et al., 2019. Scale bars, (A and B) 2.5 μm (C) 250 nm, (D) 1 μm, (E) 500 nm, (F) 10 μm (white – biological scale, blue – physical scale), (G) 1.5 μm. All scale bars are biological scale unless otherwise noted.
While expansion microscopy can be used to identify putative synaptic contacts with high fidelity in three dimensions (Bürgers et al., 2019), it is also able to resolve subsynaptic architecture. In larval zebrafish, expansion microscopy revealed heterogeneity in synapse structure as shown by a spectrum of glycine receptor ring sizes along the axon cap of the M cell, which were too fine to be resolved by confocal microscopy alone (Freifeld et al., 2017). Additionally, the bassoon-homer1 synaptic pair was imaged along with actin in mouse neural tissue through the use of fluorophore-conjugated phalloidin and antifluorophore antibodies (Park et al., 2020). The labeled actin, bassoon, and homer1 formed three-layered structures, with actin existing mostly within the postsynaptic compartment. While this structure was largely consistent in in CA1 region of the mouse hippocampus, a variety of synaptic architectures was observed in the dentate gyrus. Expansion microscopy has also documented changes in the presynaptic active zone of Drosophila neuromuscular junction due to aging (Jiang et al., 2018). A significant increase in two-dimensional active zone area via bruchpilot labeling was found as flies aged, along with a significant increase in the number of active zones observed containing multiple bruchpilot rings. The authors noted that if these multiple ring-containing active zones arose from fusion of singlet active zones they could have enhanced release, potentially providing a cellular mechanism for an increased release previously observed in Drosophila active zones with aging.
The sizes of some synaptic components are beyond the resolving power of even 4-fold expansion microscopy, as whole synapses can have a diameter of less than one micron, and the sizes of tiny synaptic features, such as presynaptic vesicles and the synaptic cleft, are on the order of tens of nanometers (Midgett et al., 2012). To resolve some of these features, ExM methods offering higher effective resolution (i.e., higher expansion factors) are needed. For example, iExM expands tissue samples twice by ~4.5-fold each time for a final expansion factor of ~20, providing demonstrated resolutions of ~25 nm (Chang et al., 2017). Using this technique, clear and complete separation of pre- and post-synaptic proteins was demonstrated in both excitatory and inhibitory synapses, and neurotransmitter receptors were resolved between them (Fig. 2D). iExM was also used to compare the distance between bassoon and homer1 across multiple brain regions, finding similar distances between the two scaffolding proteins in two regions of the primary somatosensory cortex and dorsal striatum, but distances that were ~ 50% larger in the medial pallidum. Finally, neural membranes were labeled through the expression of farnesylated fluorescent proteins (Chang et al., 2017; Cia et al., 2013). In this way, postsynaptic proteins could be localized within their specific compartment, providing yet another avenue for investigating intersynaptic heterogeneity. Taken together, these results demonstrate the ability of iterative expansion microscopy to localize proteins with incredible precision within individual synapses in tissue, providing resolution near that of the best optical super-resolution techniques on a confocal microscope.
iExM requires multiple rounds of expansion and the reliance on custom oligonucleotide conjugated antibodies to work. In contrast, X10 microscopy uses a modified gel composition that expands ~10-fold in water in a single expansion step (Truckenbrodt et al., 2018). X10 microscopy uses a direct protein anchoring method which allows the use of conventional antibodies. Using X10, the pre- and postsynaptic protein pairs of bassoon and homer1 as well as Rim1 and PSD95 were resolved in cell culture and the distances between each pair quantified. This experiment showed a bassoon-homer1 pair distance of ~120–140 nm and a Rim1-PSD95 pair distance of ~80 nm, comparable to measurements taken with STORM (Dani et al., 2010). The utility of X10 in multicolor nanoscale imaging was also demonstrated in thin sections of mouse brain, resolving individual presynaptic vesicles as labeled by synaptophysin, along with bassoon and homer1 (Fig. 2E) (Truckenbrodt et al., 2018), though rigorous isotropy measurement would be beneficial to estimate the distortion level in the future. X10 microscopy was also utilized as part of a creative correlative protocol to better understand how the ability of pyramidal neurons in the mouse visual cortex to integrate the activity of large amounts of inputs is impacted by the precise organization of specific subsets of synapses along their dendrites (Lee et al., 2019). In this work, two-photon microscopy was used to determine putatively whether presynaptic inputs to these pyramidal neurons were of callosal or cortical origin, as well as the grating orientation they responded most strongly to. As two-photon microscopy does not provide spatial resolution adequate to identify individual synapses, the precise locations of synapses was confirmed with X10 microscopy. This approach showed that while neither callosal or cortical inputs of a given preferred grating orientation were more likely to be adjacent to inputs of the same origin and orientation, callosal inputs were significantly more likely to be adjacent to cortical inputs of a similar orientation. Given this information, the authors proposed that the proximity of cortical and callosal synaptic inputs along these pyramidal neuron dendrites could be crucial for their integration of visual field information.
It has been known that RNA exists in nanoscale compartments like dendritic spines (Schuman, 1999), and recent studies indicate that those localized RNAs regulate various biological functions, such as local protein synthesis required for synaptic plasticity and heterogeneity (Hafner et al., 2019; Holt et al., 2019; Rodriguez et al., 2008; Schuman, 1999). Thus, to determine changes happening at individual synapses, it is important to pinpoint the subcellular RNAs in intact tissues in the nervous system. While there are an increasing number of new techniques for multiplexed measurements of the locations and identities of RNA molecules in cells and tissues (Crosetto et al., 2015; Lein et al., 2017), imaging RNAs within nanoscale compartments requires image resolution beyond the diffraction limit, which is not easily achieved within tissues using conventional optical methods.
Individual mRNA puncta, including overexpressed and HCR amplified transcripts, can be resolved in expanded neurons and within dendritic spines (Fig. 2F) (Chen et al., 2016). While protein synthesis within mature dendrites was not controversial (Scarnati et al., 2018; Shigeoka et al., 2016; Younts et al., 2016), there had been inconsistent evidence about local translation in axons and presynaptic terminals due to the inability to detect ribosomes within them (Akins et al., 2009). Expansion microscopy was used to image mRNA transcripts and translational machinery in pre- and postsynaptic compartments in multiple brain areas (Hafner et al., 2019). In this work, mouse brain slices were immunostained for either vesicular glutamate transporter 1 (vGluT1) or vesicular GABA transporter (vGAT) to label excitatory or inhibitory presynaptic terminals, respectively, as well as for either large or small ribosomal proteins, and were then expanded (Fig. 2G). Ribosomes were localized within over 75% of both excitatory and inhibitory presynaptic terminals. Ribosomal RNA and polyadenylated mRNA were detected with FISH probes in over 80% of vGluT1 and vGAT positive nerve terminals. In addition, presynaptic terminals were imaged in expanded cultured neurons after puromycin metabolic labeling. Nascent peptides were found in dendritic spines, vGAT positive presynaptic sites, and vGluT1 positive presynaptic sites, with decreasing abundance in that order. This study shows local translation in presynaptic terminals that could not be otherwise characterized with diffraction-limited optical microscopy (Hafner et al., 2019). Most recently, ExM was adapted for in situ RNA sequencing in mouse brain (Alon et al., 2020). They developed two versions: long-read untargeted expansion sequencing (ExSeq) and targeted ExSeq. The untargeted ExSeq was demonstrated to readout thousands of genes, including splice variants and novel transcripts in mouse brain. On the other hand, targeted ExSeq was applied to map selected RNAs throughout dendrites and spines in neurons of the mouse hippocampus and mouse visual cortex.
3.2. Neuron tracing and large-volume imaging
Neurons make many connections both locally and distally. The study of these connections between neurons across length scales is crucial for understanding the role individual neurons play in circuits that enable thought and action. The identification of these connections has, however, posed a challenge to neuroscientists (Acciai et al., 2016; Meijering, 2010). The brain is densely packed with small neural processes tightly entwined, making it difficult to trace individual projections to their point of origin. Sparse labeling of neurons (Fujiyama et al., 2011; Suárez et al., 2014) and the development of monosynaptic viral tracing (Wickersham et al., 2007) may alleviate some of this, but issues still abound. For instance, by its very nature sparse labeling of neurons is low throughput, taking a considerable effort to characterize the numerous projection targets of a single region of the brain, let alone the entire organ. Additionally, information on long-range projections may be lost due to the sectioning of tissue (Ku et al., 2016). To retain this information of long-range projections, tissue clearing methods have been developed to render brain specimens optically transparent, reducing light scattering and allowing for large-volume imaging without the need for tissue sectioning (Richardson and Lichtman, 2015). Yet, it is still challenging to identify points of connection between neurons in cleared brain tissues, due to the diffraction limit of conventional optical microscopy.
Expansion microscopy overcomes these challenges, as it renders tissue specimens transparent after expansion and offers the resolution and throughput useful for the assignment of axons to individual neurons and confirmation of synaptic connections across large volumes. The first ExM report gave a glimpse of its potential in this regard by imaging a 100-μm column of mouse hippocampal tissue (Chen et al., 2015). The processes of neurons labeled with YFP were clearly separated in the fourfold expanded tissue and synapses could be seen on dendritic spines through labeling of bassoon and homer1. An impressive demonstration of the capabilities of ExM for large-volume imaging came from the Chung lab and their MAP protocol (Ku et al., 2016), in which the physical expansion of a whole mouse brain was demonstrated (Fig. 3A), however hardware constraints (namely short working distances of the objectives) prevented complete imaging of this tissue. Instead, mouse brain sections ranging from 100 μm to 1 mm were successfully imaged (Fig. 3B). The entire dendritic arbor and axonal projection of a cortical pyramidal neuron was isolated from a densely labeled 500-μm section, and a 3-mm-long inter-region projection of a tyrosine hydroxylase neuron was traced in a 1-mm-thick hemispheric section (Fig. 3C).
Fig. 3.
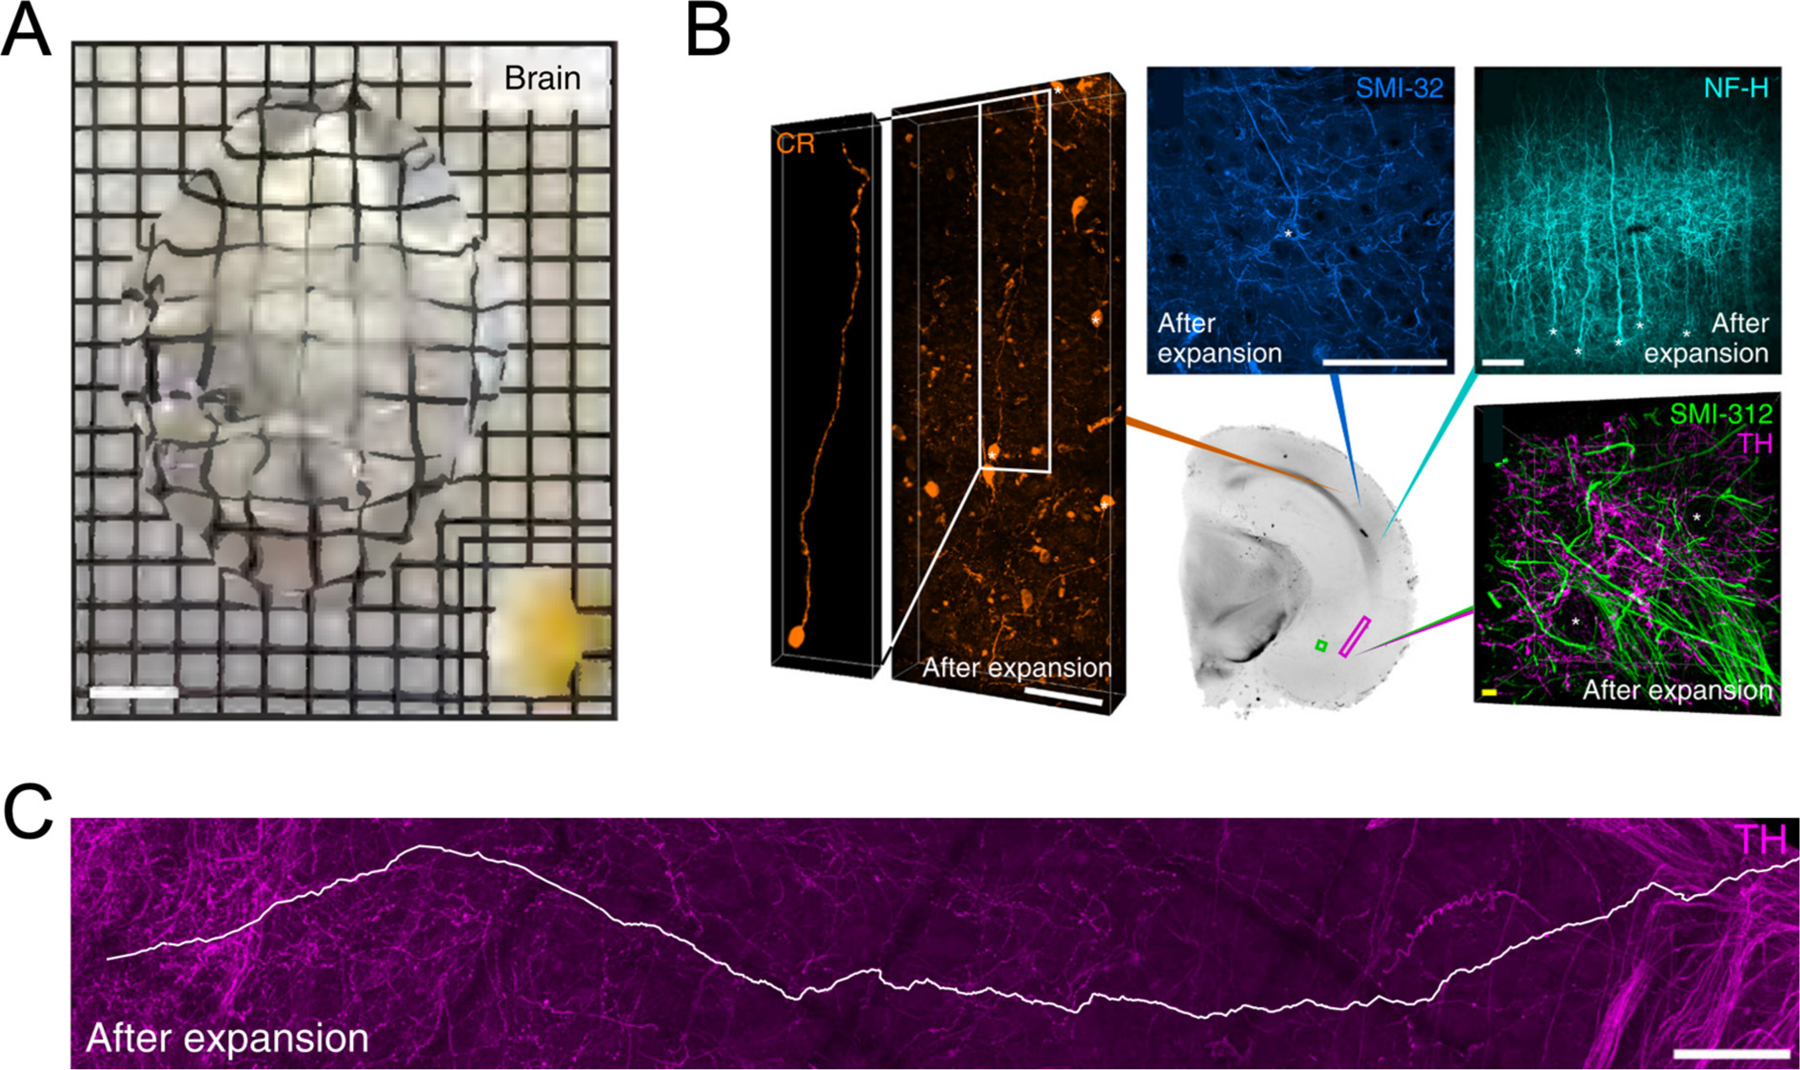
Large volume imaging of expanded tissue with MAP. (A) MAP applied to a whole mouse brain. The entire process from perfusion to full expansion took 7 d. Compared with the original organ size (picture at right bottom corner), the final expansion of the brain showed a more than fourfold increase in length. (B) Neuronal fibers and cell body (asterisks) morphology visualized using various markers (Clockwise from left: CR, SMI-32, NF-H, SMI-312 and TH) in different cortical and subcortical regions of a 1-mm-thick hemisphere slice (Center). (C) Long-range tracing (white line, longer than 3 mm) of an inter-regional TH neurofilament within the magenta box in the section shown in (B). A-C are adapted from ref. Ku et al., 2016. Scale bars, (A) 10 mm, (B) 200 μm (white), 10 μm (yellow). (C) 200 μm. All scale bars are biological scale.
Further increased resolving power benefits tracing neurons in densely labeled tissue. For example, iterative expansion microscopy has been used to unambiguously differentiate between brainbow-labeled neural processes (Chang et al., 2017). However, the increased size of the tissue makes the application of iterative expansion microscopy to tracing neurons over large distances challenging with currently available microscopes.
As notable as these demonstrations were, they still suffered from a flaw inherent to expansion: the physical separation of fluorophores causes a decrease in fluorescence intensity over the same unit volume, increasing susceptibility to photobleaching because of the need of long exposure time and high-power excitation light. By combining ExM with lattice light sheet microscopy (ExLLSM), this photobleaching effect can be reduced (Gao et al., 2019a). The thickness of the mouse cortex and the entire drosophila brain were imaged through with limited loss of fluorescence intensity and 60 nm lateral and 90 nm axial resolution at 2–3 orders of magnitude the imaging rate of other common imaging methods (e.g., laser scanning confocal microscopy and 2 photon microscopy). ExLLSM was used to image entire neurons and their projections in densely labeled mouse primary visual cortex, with spines clearly resolved and attributable to their dendrite. Zooming further in, ExLLSM resolved synaptic contacts on Thy1-YFP-expressing neurons in three dimensions, allowing the comparison of YFP-associated and non-YFP-associated bassoon-homer1 synaptic pairs and showing an average decrease in distance between the two scaffolding proteins when associated with YFP.
Impressively, an entire expanded drosophila brain was stained for nc82 (bruchpilot) and imaged with lattice light sheet microscopy (Gao et al., 2019a). The total number of presynaptic active zone puncta was measured to be approximately 40 million, of which over 500,000 were determined to be associated with dopamine neurons (Fig. 4A). The density of puncta could then be compared across brain regions. Olfactory projection neurons in the adult drosophila brain were also traced from the antenna lobe to the calyx and lateral horn (Fig. 4B), and the stereotypy of these projections was compared across five brains.
Fig. 4.
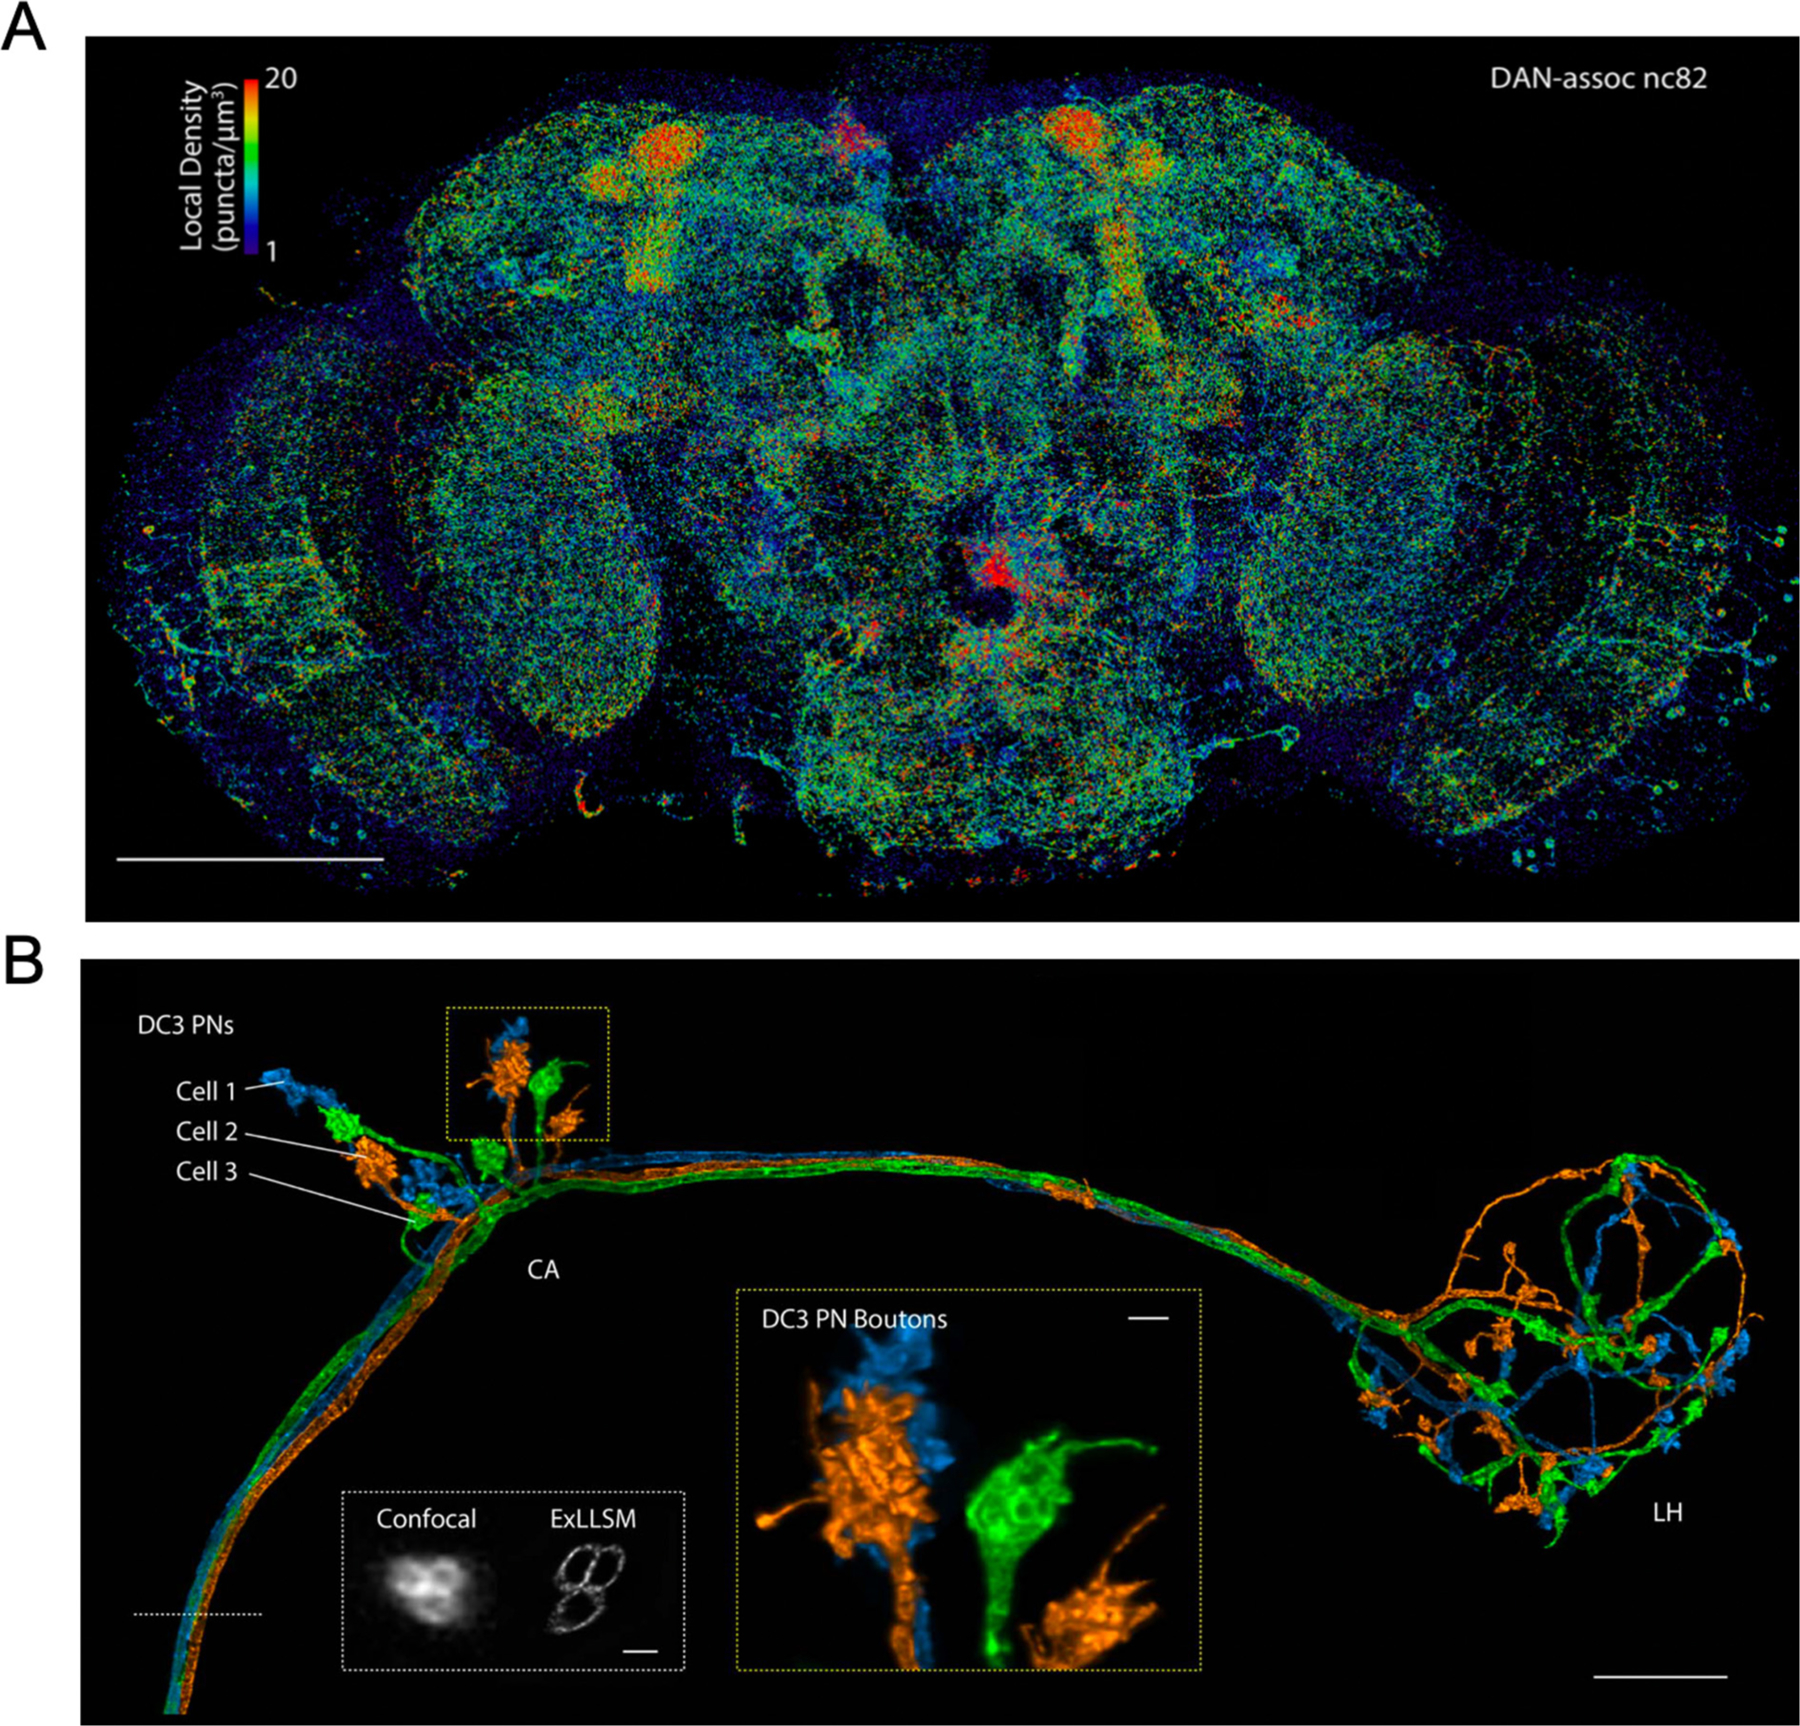
ExLLSM imaging of the drosophila brain. (A) MIP view of the subset of nc82 puncta marking presynaptic sites that are associated with dopamine neurons (DANs; DAN-assoc nc82), color coded by the local puncta density, in an adult Drosophila brain. (B) Maximum intensity projection of olfactory projection neurons in a four-fold expanded adult Drosophila brain imaged with lattice light-sheet microscopy and traced to the calyx (CA) and lateral horn (LH). White box: Expanded axon cross sections imaged with confocal microscopy and LLSM. Yellow box: A magnified view of DC3 PN boutons in CA. A and B are adapted from ref. Gao et al., 2019a. Scale bars, (A) 100 μm and (B) 10 μm (main), 1 μm (both insets). All scale bars are biological scale.
3.3. Applications in neurological disease
Thus far, we have described the vast capabilities of expansion microscopy as a neuroscientific tool, one able to image the finest units of neural communication with nanoscale precision and to trace neural connections through large volumes of densely labeled tissue. In this section, we thought it wise to highlight the instances in which expansion microscopy has been utilized to contribute to the study of neurological disease.
Parkinson’s disease is a neurodegenerative disease characterized by dysfunction and loss of dopaminergic neurons in the substantia nigra pars compacta (SNc). A key regulator of these dopaminergic neurons reside in striosomal compartments within the striatum (Fujiyama et al., 2011; Watabe-Uchida et al., 2012), and these striosomal neurons have been demonstrated to be differentially affected in Parkinson’s disease (Crittenden and Graybiel, 2016). A novel arborization formed by the projections of striosomal neurons to dopaminergic neurons in the mouse SNc was discovered (Fig. 5A) (Crittenden et al., 2016). Due to their striking form, with tightly interwound axons and dendrites coming to a head at the soma of SNc neurons, these structures were termed “striosome-dendron bouquets.” Evidence of interaction with cholinergic, GABAergic, glutamatergic, and astrocytic processes was observed in unexpanded tissue, yet the proximity of such a large number of processes left many questions unanswerable with diffraction-limited microscopy alone. Using ProExM, individual fibers could be visualized in three dimensions in four-fold expanded tissue (Fig. 5B). In this way, putative direct connections could be seen between striosomal axons and dopamine-containing dendrites in the bouquets (Fig. 5C). In addition, while astrocytes were found in and around these bouquets through confocal imaging of GFAP-labeled tissue, only in the expanded state were connexin-43 puncta clearly resolved (Fig. 5D), providing stronger evidence of astrocytic function within the structure. In all, expansion microscopy was used to characterize a novel neural structure, the striosome-dendron bouquet, that is in prime position to affect the dopaminergic system that goes awry in neurodegenerative disease and provides a point of future study into the mechanisms of its dysfunction.
Fig. 5.
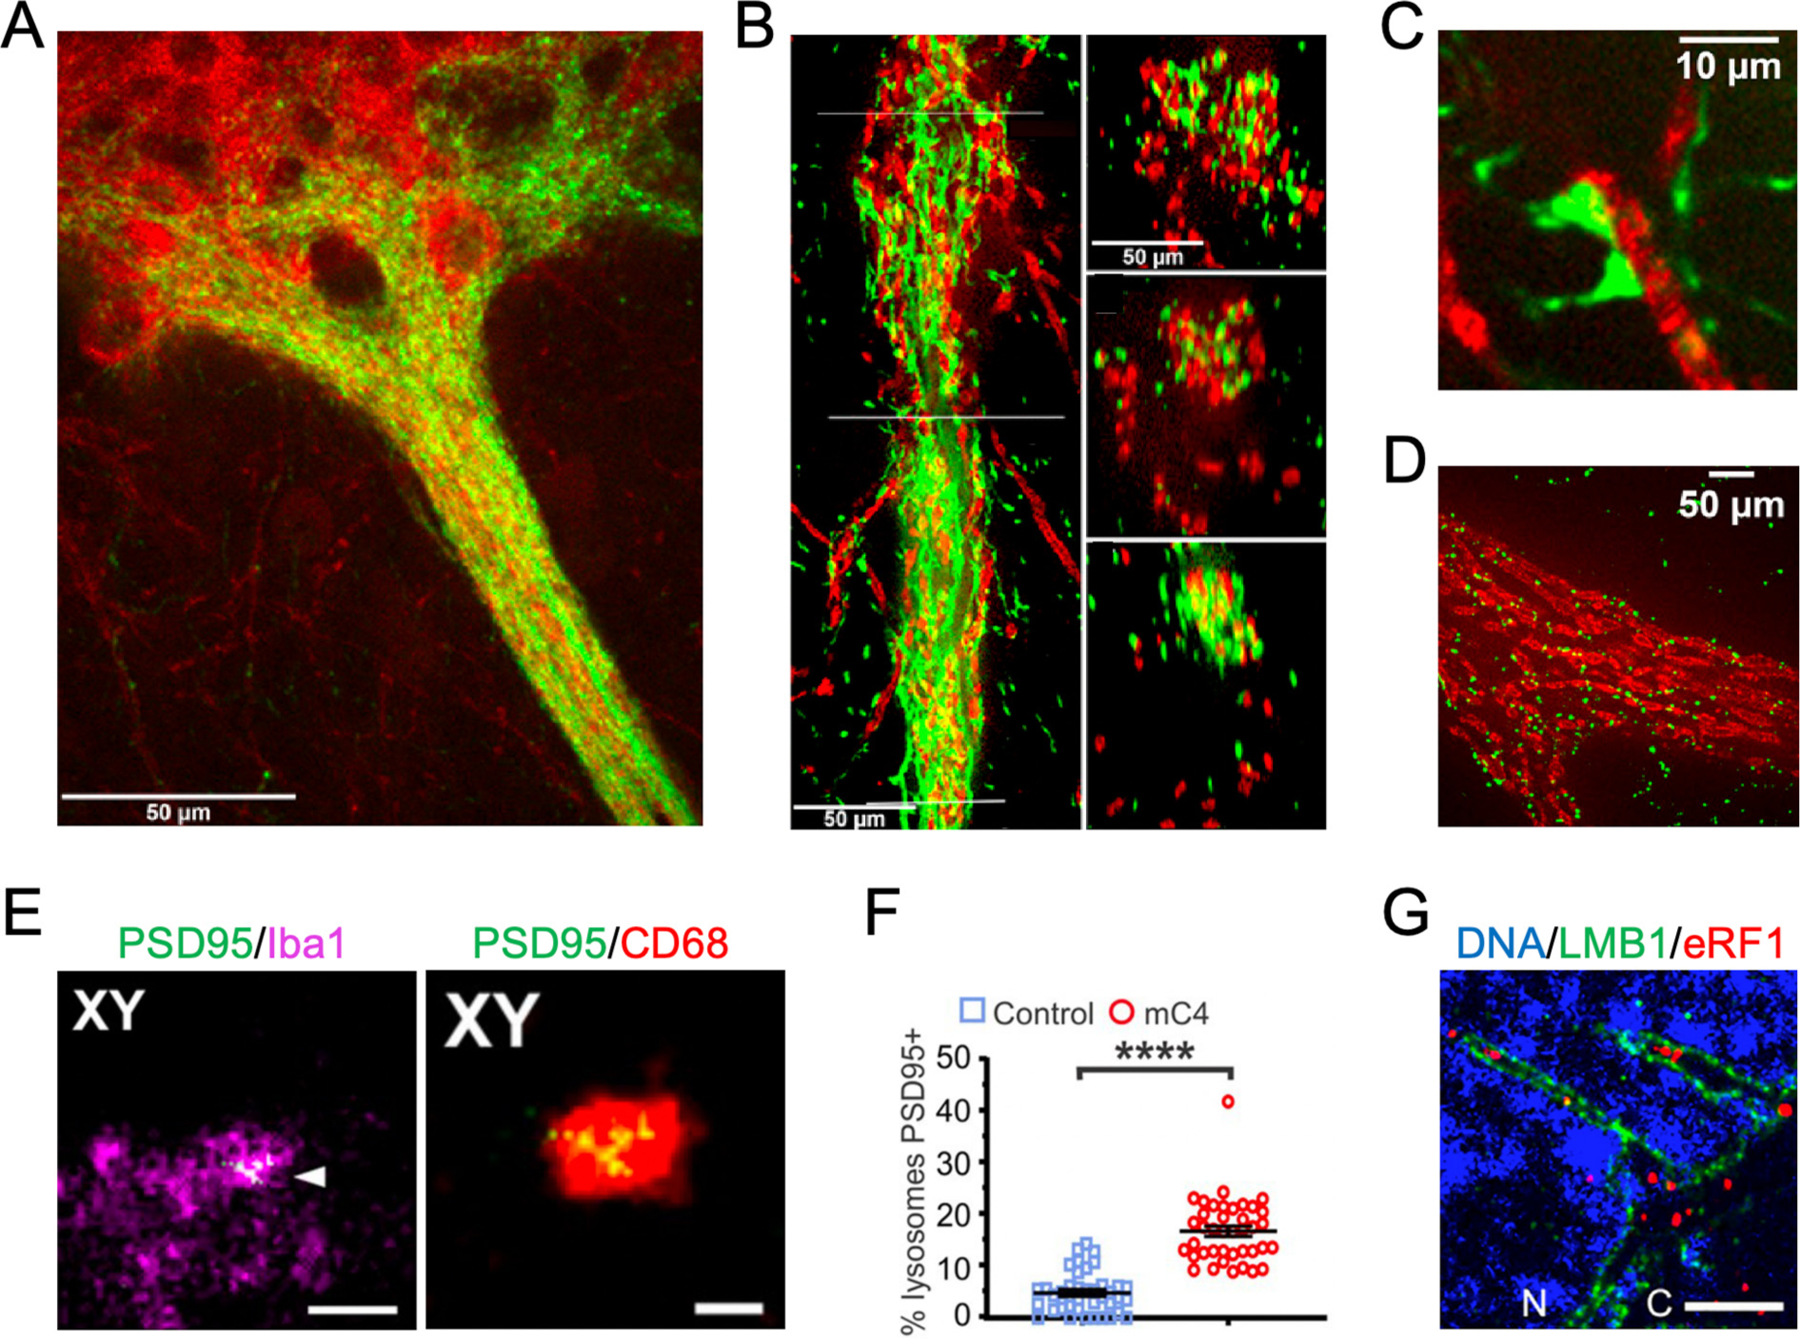
Expansion microscopy applications in neurological disease. (A) Confocal image of SNc neurons and their ventrally extending dendrites (red) and striosomal axons (green) in the P172-mCitrine (n = 12 sections from 3 animals) striosome line. Tightly entwined striosomal and dopaminergic fibers in dendrons appear mainly yellow. (B) ProExM imaging of the bouquet shown in (A) resolves individual striosomal fibers (green) and dendrites (red) in a longitudinal view (left) and in cross-sections at three levels (right) corresponding to the lines drawn on the left panel. (C) With ProExM, two mCitrine-positive (green) presumed contacts onto a DAT-positive (red) fiber are visible in the P172 striosome line (n = 2 sections from 1 animal). (J–L). (D) ProExM single-plane confocal images at the centers of dendrons (immunolabeled for DAT in red) with connexin-43 (green) junctions along the dendron (n = one section from 1 animal). A-D are adapted from ref. Crittenden et al., 2016. (E) A representative microglia for the mC4 condition, including Iba1 and PSD95-FingR-RFP (pseudocolored green) signal. White arrowhead indicate colocalization of PSD-95 with Iba1. Right: The same z-plane the left panel but with CD68 and PSD95-FingR-RFP signal. (F) mC4 overexpression led to an increase of lysosomes that were positive for PSD-95 signal. The percent of lysosomes that were PSD95 positive per each microglia compared between control and mC4. t-test. ****p < 0.0001. E and F are adapted from Comer et al., 2020. (G) eRF1 resolved in nuclear invaginations in C9-ALS patient motor neurons. G are adapted from ref. Ortega et al., 2020. Scale bars, (A-C) 50 μm (physical scale), (D) 10 μm (physical scale), (E) 2.5 μm (left, biological scale) and 1 μm (right, biological scale), and (G) 5 μm (biological scale).
Schizophrenia is a neurological disorder with unknown mechanism in which patients may experience impaired cognition, psychosis, and motivation. (Sekar et al., 2016). A striking feature of Schizophrenia is the loss of synapses (Glausier and Lewis, 2013) and there is evidence that the immune gene C4, overexpression-causing mutations in which have been linked to a greater incidence of Schizophrenia and was demonstrated to be involved in synaptic pruning in adolescence (Sekar et al., 2016), could contribute to pathogenesis of the disease. Evidence that C4 overexpression causes cortical layer-specific microglial engulfment of synaptic material and reduced synaptic connectivity was found through electrophysiological and immunofluorescence experiments in mice (Comer et al., 2020). In this work, ExM was used to confirm the presence of the postsynaptic protein PSD95 within microglia. In expanded samples, PSD95 was colocalized with the microglial marker Iba1 as well as CD68, which is found on microglial lysosomes (Fig. 5E). In addition, there was a significant increase in the number of lysosomes in microglia in expanded C4-overexpressed samples compared to controls (Fig. 5F), whereas no significant difference was found in non-expanded samples. The enhanced resolution provided by expansion microscopy also allowed comparison of PSD95-positive and -negative lysosome size, finding that PSD95-positive lysosomes were on average 1.5 times larger than PSD95-negative lysosomes in both C4 overexpression and control samples. This study provided evidence that overexpression of C4 in mice can cause synaptic loss through microglial engulfment, similar to pathology seen in Schizophrenia.
A common cause of amyotrophic lateral sclerosis and frontotemporal dementia is disruption of nucleocytoplasmic transport by RNA and dipeptide repeats produced by a hexanucleotide repeat expansion in C9orf72 (C9-HRE) (Ortega et al., 2020). ExM has been used to demonstrate eRF1, a regulator of translation termination and nonsense-mediated decay, accumulated abnormally within nuclear envelope invaginations in C9-ALS patient induced pluripotent stem cell neurons and postmortem tissue (Fig. 5G) (Ortega et al., 2020). It was also demonstrated that eRF1 overexpression ameliorated C9-HRE toxicity in vivo, marking eRF1 as a potential therapeutic target in amyotrophic lateral sclerosis and frontotemporal dementia.
3.4. Adaption of ExM
While conducting an ExM experiment does not require complicated lab equipment or skills, adopters may nevertheless encounter issues before successfully implementing it in their own projects. We recommend optimization of experimental parameters and the design of validation experiments when applying ExM methods to new model systems that are not previously documented. Indeed, since the publication of early versions of ExM, multiple groups have reported their own versions of ExM optimized for C. elegans (Yu et al., 2020), Drosophila (Jiang et al., 2018), zebrafish (Freifeld et al., 2017), human brain (Deshpande et al., 2017; Ortega et al., 2020), etc. There are common problems such as handling and transporting delicate expanded specimens, placing the specimen in the correct orientation, finding the regions of interest, and preventing gel drifting during the imaging session. For more details on general strategies and helpful tips to overcome these common problems, please refer to (Gao et al., 2017; Klimas et al., 2019; Klimas and Zhao, 2020; Truckenbrodt et al., 2019).
4. Perspective
We have reviewed several ExM methods that are promising for neuroscience applications and discussed some specific examples of their use in the field to date. We now provide our perspectives on the current bottlenecks in ExM and the opportunities for the future.
One major bottleneck is the signal strength in expanded specimens. While expansion improves the effective resolution in principle, it also effectively reduces the concentration of fluorescent label (for instance, a 4-fold expanded tissue will see a 4 × 4 × 4 = 64-fold reduction in signal intensity). In addition, if the fluorescently labeled oligo or antibody is applied pre-expansion, polymerization and homogenization processes will cause partial loss of fluorophores due to oxidation and hydrolysis of antibodies (Min et al., 2019). To alleviate the loss of fluorescent signal, various signal amplification strategies have been explored to boost the signal for post-expansion imaging, for example by hybridization chain reaction (Lin et al., 2018), primer exchange reaction (Saka et al., 2019) or iterative antibody binding (Cho et al., 2020). Post-expansion immunolabeling may also mitigate this issue to some extent since the expansion process separates crowded epitopes and thus allows more antibody molecules to bind. This decrowding effect improves the fluorescent signal and label density (Gambarotto et al., 2019), and reveals hidden nanostructures inaccessible to prior imaging techniques (Sarkar et al., 2020), though further experiments are needed to validate the newly discovered nanostructures.
The resolution offered by ExM has yet to reach its theoretical limit. While increasing the expansion factor by improving the gel chemistry can lead to higher resolution, reducing the size of labels may also be helpful, as small labels have reduced biomolecule localization error: the farther away a fluorophore is from the biomolecule, the less precisely its location can be determined (Gao et al., 2019a; Shi et al., 2019; Zwettler et al., 2020). Multiple groups have been exploring small labels with size much smaller than antibody, for example, nanobodies (Sograte-Idrissi et al., 2019) and small genetically encoded tags (Shi et al., 2019). Commercially available antibody fragments may be another excellent option. Interestingly, post-expansion application of regular antibodies may also improve attainable resolution since the effective size of the labels relative to the tissue is decreased due to the expansion (Sarkar et al., 2020). Beyond label size, another potential resolution-limiting factor is the spacing between polymer chains of the gel. As biomolecules are linked to the polymers, the frequency of chains dictates how frequently the position of biomolecules is “sampled.” This means that beyond a certain point, further expansion of a sample will not produce a corresponding increase in spatial information, and therefore gel mesh size determines the ultimate attainable resolution by expansion. Previous work has shown that uncharged polyacrylamide gels have a polymer spacing of 1–2 nm (Cohen et al., 1992) and macromolecular ferritin crystals integrated with water-swellable poly (acrylamide-co-acrylate) hydrogel can isotropically expand to 180% of their original dimensions and more than 500% of their original volume while retaining periodic order and faceted Wulff morphologies (Zhang et al., 2018), leading to estimates that the linkage error in ExM could be on the order of the size of a biomolecule (Wassie et al., 2019). A recent preprint has shown promise in further reducing this linkage error to boost resolution by using tetrahedral gel monomers to produce a more uniform gel that is free of heterogeneities such as loose ends or loops (Gao et al., 2019b). While it is unlikely that ExM could reveal hierarchical organizations of small protein complexes, it remains to be seen if the stoichiometry of supercomplexes (e.g. heteromeric PSD95 postsynaptic supercomplexes or viral capsids) could be deduced using confocal microscopy if samples were sufficiently expanded and densely labeled.
Currently, it remains a challenge to objectively estimate isotropy of ExM methods in different expanded biological samples. Previous studies have quantified distortion by comparing super-resolution images of unexpanded tissue (e.g. with STORM, STED or SIM) to the same region of tissue after expansion and calculating the root mean square error over various length scales (Chang et al., 2017; Chen et al., 2015; Tillberg et al., 2016; Truckenbrodt et al., 2018). However, such measurements are only quantified in two-dimensional space. Due to the confined optical sectioning and the specimen expansion along axial dimension. It is not always possible to acquire the exact same features in both the pre- and post-expansion images. With further development of image registration algorithms, quantification in three-dimension may provide more accurate evaluation of expansion-induced distortion. An alternative strategy to determining isotropy, is to utilize well-characterized structures within expanded samples. For example, DNA nanorulers have been explored to evaluate the expansion factor and isotrpy on both the nanoscale and microscale (Scheible and Tinnefeld, 2018). Another example is nuclear pore complex. With a diameter of 100 nm and composed of eight evenly spaced subunits and previously characterized by EM and super-resolution optical microscopy, the nuclear pore complex has been shown to be an effective intrinsic reporter of nanoscopic isotropy (Pesce et al., 2019). In addition, one may consider generating an intrinsic 3D ruler by photobleaching (Vanheusden et al., 2020). A final caveat one must keep in mind is that as with any post-fixation microscopy the spatial relationship between biomolecules revealed by ExM is not necessarily a reflection of their original positions in vivo, such that error may arise not only from expansion but from the fixation process itself.
Beyond resolution improvement, recent advances in biomolecule anchoring may further extend the type of experiment that can be performed in expanded samples. For example, the Boyden lab has described an expansion-compatible lipophilic stain and demonstrated its utility in visualizing cellular membranes in neural tissue (Karagiannis et al., 2019). Click chemistry has also been used as a universal biomolecule anchoring method for ExM imaging of a wide range of molecules including lipids and small molecule drugs (Sun et al., 2020). The incorporation of small molecules into the gel is particularly enticing as a method for determining their nanoscale distribution in the system and may provide mechanistic insights on the action of novel small molecule therapeutics in the brain.
While ExM offers greatly improved image resolution for colocalization analysis, most multiplex ExM imaging are limited to the 4–5 colors due to spectral overlap of fluorophores. It is desirable to increase the number of labels that can be imaged within a single sample as the colocalization information one can obtain increases combinatorically. Since the development of direct protein anchoring expansion microscopy, highly multiplexed images within expanded samples have been demonstrated using variations on a serial labeling strategy in which labels are successively applied and removed before the next round of staining. This has been accomplished both by the complete removal of antibodies in each cycle (Ku et al., 2016) or the use of DNA-barcoded antibodies and the successive application and removal of complementary fluorescent primers (Saka et al., 2019). Currently, it remains challenging for inexperienced practitioners to apply these serial labeling strategies in expanded tissue-gel hybrid because multiple treatment and imaging steps inevitably introduce subtle distortions at both micro and macro scales that require careful structural alignment. Development of robust computational tools for non-rigid image registration and downstream processing as well as automation of the iterative steps may facilitate broader uses in the community. Other opportunities exist to achieve multiplex ExM imaging by imaging expanded specimens with other imaging modalities. For example, the Min lab has recently developed sets of dyes with non-overlapping emission in stimulated Raman scattering (SRS). Once conjugated with affinity tags, such as antibodies and streptavidin, these new dyes enable multiplexed SRS imaging of a dozen or more targets at a time, and thus in principle could be applied for simultaneous imaging of many types of biomolecules within expanded specimens without the need of serial imaging (Hu et al., 2018; Wei et al., 2017). Another interesting possibility is to use Imaging Mass Cytometry (IMC) (Giese et al., 2014) and Multiplexed Ion Beam Imaging (MIBI) (Angelo et al., 2014) to image antibodies that are tagged with isotopically pure elemental metal reporters on expanded specimens. Both techniques offer imaging resolution below 1 μm and use a high-resolution mass spectrometry detector to resolve the mass difference between isotopically pure elemental metal ions, thus enabling imaging up to 100 targets per sample. Because IMC and MIBI require specimens in a low-pressure environment where water will evaporate, further method development should be considered to preserve the expanded state of specimen after dehydration.
Finally, it is within the category of synaptic qualification experiments that expansion microscopy may find itself having the greatest impact. While changes in the function, quantity, and molecular composition of synapses have been implicated in learning and early stages of neurological diseases (Glausier and Lewis, 2013; Taoufik et al., 2018), these are still systems-level processes, the complete understanding of which requires studies of the brain across physical scales. Large scale studies of synaptic structure and components across entire systems is simply not yet practical with other super-resolution methods or electron microscopy. In this context, ExM may offer meaningful biological insights. In addition, the optical transparency of expanded tissue and the ability to image samples rapidly on diffraction-limited microscopes places expansion microscopy in a unique position to be used to study cellular and synaptic changes throughout the brain during aging, learning, and disease. Currently, such large-scale studies still face practical challenges in biomolecular labeling, imaging depth and speed, and the generation of large datasets. Stochastic electrotransport can reduce labeling times in large organs (Kim et al., 2015) and light sheet microscopy can improve imaging time by orders of magnitude over confocal microscopy (Chang et al., 2017; Gradinaru et al., 2018), yet increased expansion factor and label multiplicity have significant impacts on image acquisition time and final dataset size. Automated image analysis software may help with the processing of such large datasets (Gradinaru et al., 2018) and concerns over data storage and computation burden may be alleviated by distributed computing strategies. Physical limitations of imaging objectives limit the imaging of tissue after 4.5-fold expansion to ~1–2 mm at the biological scale (Chang et al., 2017; Ku et al., 2016). This issue can be partially addressed by using long-working-distance and high-resolution objectives for whole cleared tissue imaging (Tomer et al., 2014). As the need for imaging whole cleared/expanded brains continue growing, we expect further development of optical objectives specifically for these large samples in the near future. Coupled with recent advances in ExM that improve resolution and increase the variety of biomolecules that can be linked to the gel, we envision researchers will be able to routinely generate highly multiplexed nanoscale images in large volumes of neural tissue. Disease-associated changes in synaptic components and their spatial arrangements could then be quantified across a large volume in the brain specimens, potentially providing new insights into the molecular mechanisms of neural function and disease.
Acknowledgment
Y.Z. thanks the support from the Carnegie Mellon University and NIH Director’s New Innovator Award (DP2 OD025926-01).
Footnotes
Declaration of Competing Interest
The authors declare the following competing financial interest(s): Y. Z. is an inventor on several inventions related to ExM.
References
- Acciai L, Soda P, Iannello G, 2016. Automated neuron tracing methods: an updated account. Neuroinformatics 14, 353–367. [DOI] [PubMed] [Google Scholar]
- Akins MR, Berk-Rauch HE, Fallon JR, 2009. Presynaptic translation: stepping out of the postsynaptic shadow. Front. Neural Circuits 3, 1–7. [DOI] [PMC free article] [PubMed] [Google Scholar]
- Alon S, Goodwin D, Sinha A, Wassie A, Chen F, Daugharthy E, Bando Y, Kajita A, Xue A, Marrett K, Prior R, Cui Y, Payne A, Yao C-C, Suk H-J, Wang R, Yu C-C, Tillberg P, Reginato P, Pak N, Liu S, Punthambaker S, Iyer E, Kohman R, Miller J, Lein E, Lako A, Cullen N, Rodig S, Helvie K, Abravanel D, Wagle N, Johnson B, Klughammer J, Slyper M, Waldman J, Jané-Valbuena J, Rozenblatt-Rosen O, Regev A, Church G, Marblestone A, Boyden E, 2020. Expansion sequencing: spatially precise in situ transcriptomics in intact biological systems. bioRxiv [DOI] [PMC free article] [PubMed] [Google Scholar]
- Angelo M, Bendall SC, Finck R, Hale MB, Hitzman C, Borowsky AD, Levenson RM, Lowe JB, Liu SD, Zhao S, Natkunam Y, Nolan GP, 2014. Multiplexed ion beam imaging of human breast tumors. Nat. Med 20, 436–442. [DOI] [PMC free article] [PubMed] [Google Scholar]
- Betzig E, Patterson GH, Sougrat R, Lindwasser OW, Olenych S, Bonifacino JS, Davidson MW, Lippincott-Schwartz J, Hess HF, 2006. Imaging intracellular fluorescent proteins at nanometer resolution. Science 313, 1642–1645. [DOI] [PubMed] [Google Scholar]
- Bucur O, Fu F, Calderon M, Mylvaganam GH, Ly NL, Day J, Watkin S, Walker BD, Boyden ES, Zhao Y, 2020. Nanoscale imaging of clinical specimens using conventional and rapid-expansion pathology. Nat. Protoc 15, 1649–1672. [DOI] [PMC free article] [PubMed] [Google Scholar]
- Bürgers J, Pavlova I, Rodriguez-Gatica JE, Henneberger C, Oeller M, Ruland JA, Siebrasse JP, Kubitscheck U, Schwarz MK, 2019. Light-sheet fluorescence expansion microscopy: fast mapping of neural circuits at super resolution. Neurophotonics 6, 1. [DOI] [PMC free article] [PubMed] [Google Scholar]
- Chang J-B, Chen F, Yoon Y-G, Jung EE, Babcock H, Kang JS, Asano S, Suk H-J, Pak N, Tillberg PW, Wassie AT, Cai D, Boyden ES, 2017. Iterative expansion microscopy. Nat. Methods 14. [DOI] [PMC free article] [PubMed] [Google Scholar]
- Chen F, Tillberg PW, Boyden ES, 2015. Expansion microscopy. Science 347, 543–548. [DOI] [PMC free article] [PubMed] [Google Scholar]
- Chen F, Wassie AT, Cote AJ, Sinha A, Alon S, Asano S, Daugharthy ER, Chang J-B, Marblestone A, Church GM, Raj A, Boyden ES, 2016. Nanoscale imaging of RNA with expansion microscopy. Nat. Methods 13, 679–684. [DOI] [PMC free article] [PubMed] [Google Scholar]
- Cho Y, Seo J, Sim Y, Chung J, Park CE, Park CG, Kim D, Chang J-B, 2020. FRACTAL: signal amplification of immunofluorescence via cyclic staining of target molecules. Nanoscale 12, 23506–23513. [DOI] [PubMed] [Google Scholar]
- Chozinski TJ, Halpern AR, Okawa H, Kim H-J, Tremel GJ, Wong ROL, Vaughan JC, 2016. Expansion microscopy with conventional antibodies and fluorescent proteins. Nat. Methods 13, 1–7. [DOI] [PMC free article] [PubMed] [Google Scholar]
- Cia D, Cohen KB, Luo T, Lichtman JW, Sanes JR, 2013. New tools for the brainbow toolbox. Nat. Methods 10, 540–547. [PubMed] [Google Scholar]
- Cipriano BH, Banik SJ, Sharma R, Rumore D, Hwang W, Briber RM, Raghavan SR, 2014. Superabsorbent hydrogels that are robust and highly stretchable. Macromolecules 47, 4445–4452. [Google Scholar]
- Cohen Y, Ramon O, Kopelman IJ, Mizrahi S, 1992. Characterization of inhomogeneous polyacrylamide hydrogels. J. Polym. Sci. Part B Polym. Phys 30, 1055–1067. [Google Scholar]
- Comer AL, Jinadasa T, Sriram B, Phadke RA, Kretsge LN, Nguyen TPH, Antognetti G, Gilbert JP, Lee J, Newmark ER, Hausmann FS, Rosenthal S, Liu Kot K, Liu Y, Yen WW, Dejanovic B, Cruz-Martín A, 2020. Increased expression of schizophrenia-associated gene C4 leads to hypoconnectivity of prefrontal cortex and reduced social interaction. PLoS Biol 18, e3000604. [DOI] [PMC free article] [PubMed] [Google Scholar]
- Crittenden JR, Graybiel AM, 2016. Disease-associated changes in the striosome and matrix compartments of the dorsal striatum. In: Handbook of Behavioral Neuroscience Elsevier B.V. [Google Scholar]
- Crittenden JR, Tillberg PW, Riad MH, Shima Y, Gerfen CR, Curry J, Housman DE, Nelson SB, Boyden ES, Graybiel AM, 2016. Striosome–dendron bouquets highlight a unique striatonigral circuit targeting dopamine-containing neurons. Proc. Natl. Acad. Sci 113, 11318–11323. [DOI] [PMC free article] [PubMed] [Google Scholar]
- Crosetto N, Bienko M, Van Oudenaarden A, Van Oudenaarden A, 2015. Spatially resolved transcriptomics and beyond. Nat. Rev. Genet 16, 57–66. [DOI] [PubMed] [Google Scholar]
- Dani A, Huang B, Bergan J, Dulac C, Zhuang X, 2010. Superresolution imaging of chemical synapses in the brain. Neuron 68, 843–856. [DOI] [PMC free article] [PubMed] [Google Scholar]
- Deshpande T, Li T, Herde MK, Becker A, Vatter H, Schwarz MK, Henneberger C, Steinhäuser C, Bedner P, 2017. Subcellular reorganization and altered phosphorylation of the astrocytic gap junction protein connexin43 in human and experimental temporal lobe epilepsy. Glia 1–12. [DOI] [PubMed] [Google Scholar]
- Eichler K, Li F, Litwin-Kumar A, Park Y, Andrade I, Schneider-Mizell CM, Saumweber T, Huser A, Eschbach C, Gerber B, Fetter RD, Truman JW, Priebe CE, Abbott LF, Thum AS, Zlatic M, Cardona A, 2017. The complete connectome of a learning and memory Centre in an insect brain. Nature 548, 175–182. [DOI] [PMC free article] [PubMed] [Google Scholar]
- Freifeld L, Odstrcil I, Förster D, Ramirez A, Gagnon JA, Randlett O, Costa EK, Asano S, Celiker OT, Gao R, Martin-Alarcon DA, Reginato P, Dick C, Chen L, Schoppik D, Engert F, Boyden ES, 2017. Expansion microscopy of Zebrafish for neuroscience and developmental biology studies. Proc. Natl. Acad. Sci 114 (50), E10799–E10808. [DOI] [PMC free article] [PubMed] [Google Scholar]
- Fujiyama F, Sohn J, Nakano T, Furuta T, Nakamura KC, Matsuda W, Kaneko T, 2011. Exclusive and common targets of neostriatofugal projections of rat striosome neurons: A single neuron-tracing study using a viral vector. Eur. J. Neurosci 33, 668–677. [DOI] [PubMed] [Google Scholar]
- Gambarotto D, Zwettler FU, Le Guennec M, Schmidt-Cernohorska M, Fortun D, Borgers S, Heine J, Schloetel JG, Reuss M, Unser M, Boyden ES, Sauer M, Hamel V, Guichard P, 2019. Imaging cellular ultrastructures using expansion microscopy (U-ExM). Nat. Methods 16, 71–74. [DOI] [PMC free article] [PubMed] [Google Scholar]
- Gao R, Asano SM, Boyden ES, 2017. Q & A: expansion microscopy. BMC Biol 15 [DOI] [PMC free article] [PubMed] [Google Scholar]
- Gao M, Maraspini R, Beutel O, Zehtabian A, Eickholt B, Honigmann A, Ewers H, 2018. Expansion stimulated emission depletion microscopy (ExSTED). ACS Nano 12, 4178–4185. [DOI] [PubMed] [Google Scholar]
- Gao R, Asano SM, Upadhyayula S, Pisarev I, Milkie DE, Liu T-LL, Singh V, Graves A, Huynh GH, Zhao Y, Bogovic J, Colonell J, Ott CM, Zugates C, Tappan S, Rodriguez A, Mosaliganti KR, Sheu S-HH, Pasolli HA, Pang S, Xu CS, Megason SG, Hess H, Lippincott-Schwartz J, Hantman A, Rubin GM, Kirchhausen T, Saalfeld S, Aso Y, Boyden ES, Betzig E, 2019a. Cortical column and whole-brain imaging with molecular contrast and nanoscale resolution. Science 363. [DOI] [PMC free article] [PubMed] [Google Scholar]
- Gao R, Yu CC, Gao L, Piatkevich KD, Neve RL, Upadhyayula S, Boyden ES, 2019b. A highly homogeneous expansion microscopy polymer composed of tetrahedron-like monomers. bioRxiv 1, 814111. [DOI] [PMC free article] [PubMed] [Google Scholar]
- Giese C, Wang HAO, Schapiro D, Zivanovic N, Jacobs A, Hattendorf B, Schüffler PJ, Grolimund D, Buhmann JM, Brandt S, Varga Z, Wild PJ, Günther D, Bodenmiller B, 2014. Highly multiplexed imaging of tumor tissues with subcellular resolution by mass cytometry. Nat. Methods 11, 417–422. [DOI] [PubMed] [Google Scholar]
- Glausier JR, Lewis DA, 2013. Dendritic spine pathology in schizophrenia. Neuroscience 251, 90–107. [DOI] [PMC free article] [PubMed] [Google Scholar]
- Gradinaru V, Treweek J, Overton K, Deisseroth K, 2018. Hydrogel-tissue chemistry: principles and applications. Annu. Rev. Biophys 47, 355–376. [DOI] [PMC free article] [PubMed] [Google Scholar]
- Gustafsson MGL, 2000. Surpassing the lateral resolution limit by a factor of two using structured illumination microscopy. J. Microsc 198 [DOI] [PubMed] [Google Scholar]
- Hafner AS, Donlin-Asp PG, Leitch B, Herzog E, Schuman EM, 2019. Local protein synthesis is a ubiquitous feature of neuronal pre- and postsynaptic compartments. Science 364. [DOI] [PubMed] [Google Scholar]
- Halpern AR, Alas GCM, Chozinski TJ, Paredez AR, Vaughan JC, 2017. Hybrid structured illumination expansion microscopy reveals microbial cytoskeleton organization. ACS Nano 11, 12677–12686. [DOI] [PMC free article] [PubMed] [Google Scholar]
- Hell SW, 2007. Far-field optical nanoscopy. Science 316, 1153–1158. [DOI] [PubMed] [Google Scholar]
- Hell SW, Wichmann J, 1994. Breaking the diffraction resolution limit by stimulated emission: stimulated-emission-depletion fluorescence microscopy. Opt. Lett 19, 780–782. [DOI] [PubMed] [Google Scholar]
- Holt CE, Martin KC, Schuman EM, 2019. Local translation in neurons: visualization and function. Nat. Struct. Mol. Biol 26, 557–566. [DOI] [PubMed] [Google Scholar]
- Hu F, Zeng C, Long R, Miao Y, Wei L, Xu Q, Min W, 2018. Supermultiplexed optical imaging and barcoding with engineered polyynes. Nat. Methods 15, 194–200. [DOI] [PMC free article] [PubMed] [Google Scholar]
- Jiang N, Kim H-J, Chozinski TJ, Azpurua JE, Eaton BA, Vaughan JC, Parrish JZ, 2018. Superresolution imaging of Drosophila tissues using expansion microscopy. Mol. Biol. Cell 29, 1413–1421. [DOI] [PMC free article] [PubMed] [Google Scholar]
- Karagiannis ED, Kang JS, Shin TW, Emanari A, Asano SM, Lin L, Costa EK, IMAXT, Marblestone A, Kasthuri N, Boyden ES, 2019. Expansion microscopy of lipid membranes. bioRxiv 829903 [Google Scholar]
- Kasthuri N, Hayworth KJ, Berger DR, Schalek RL, Conchello JAJA, Knowles-Barley S, Lee D, Vzquez-Reina A, Kaynig V, Jones TR, Roberts M, Morgan JL, Tapia JC, Seung HS, Roncal WG, Vogelstein JT, Burns R, Sussman DL, Priebe CE, Pfister H, Lichtman JW, Vázquez-Reina A, Kaynig V, Jones TR, Roberts M, Morgan JL, Tapia JC, Seung HS, Roncal WG, Vogelstein JT, Burns R, Sussman DL, Priebe CE, Pfister H, Lichtman JW, 2015. Saturated reconstruction of a volume of Neocortex. Cell 162, 648–661. [DOI] [PubMed] [Google Scholar]
- Kim S-Y, Cho JH, Murray E, Bakh N, Choi H, Ohn K, Ruelas L, Hubbert A, McCue M, Vassallo SL, Keller PJ, Chung K, 2015. Stochastic electrotransport selectively enhances the transport of highly electromobile molecules. Proc. Natl. Acad. Sci. U. S. A 112, E6274–E6283. [DOI] [PMC free article] [PubMed] [Google Scholar]
- Kittel RJ, Wichmann C, Rasse TM, Fouquet W, Schmidt M, Schmid A, Wagh DA, Pawlu C, Kellner RR, Willig KI, Hell SW, Buchner E, Heckmann M, Sigrist SJ, 2006. Bruchpilot promotes active zone assembly, Ca2 channel clustering, and vesicle release. Science 312, 1051–1054. [DOI] [PubMed] [Google Scholar]
- Klimas Aleksandra, Gallagher Brendan, Zhao Yongxin, 2019. Basics of Expansion Microscopy. Current Protocols in Cytometry 91 (1), 1–11. [DOI] [PMC free article] [PubMed] [Google Scholar]
- Klimas A, Zhao Y, 2020. Expansion Microscopy : Toward Nanoscale [DOI] [PMC free article] [PubMed] [Google Scholar]
- Klimas A, Bucur O, Njeri B, Zhao Y, 2019. Nanoscopic imaging of human tissue sections via physical and isotropic expansion. J. Vis. Exp [DOI] [PubMed] [Google Scholar]
- Ku T, Swaney J, Park J-YY, Albanese A, Murray E, Hun Cho J, Park Y-GG, Mangena V, Chen J, Chung K, Cho JH, Park Y-GG, Mangena V, Chen J, Chung K, 2016. Multiplexed and scalable super-resolution imaging of three-dimensional protein localization in size-adjustable tissues. Nat. Biotechnol 34, 973–981. [DOI] [PMC free article] [PubMed] [Google Scholar]
- Lee KS, Vandemark K, Mezey D, Shultz N, Fitzpatrick D, 2019. Functional synaptic architecture of Callosal inputs in mouse primary visual cortex. Neuron 101, 421–428 e5. [DOI] [PMC free article] [PubMed] [Google Scholar]
- Lein E, Borm LE, Linnarsson S, 2017. The promise of spatial transcriptomics for neuroscience in the era of molecular cell typing. Science (80-) 358, 64–69. [DOI] [PubMed] [Google Scholar]
- Lin R, Feng Q, Li P, Zhou P, Wang R, Liu Z, Wang Z, Qi X, Tang N, Shao F, Luo M, 2018. A hybridization-chain-reaction-based method for amplifying immunosignals. Nat. Methods 15, 275–278. [DOI] [PubMed] [Google Scholar]
- Meijering E, 2010. Neuron tracing in perspective. Cytom. Part A 77, 693–704. [DOI] [PubMed] [Google Scholar]
- Midgett CR, Gill A, Madden DR, 2012. Domain architecture of a calcium-permeable AMPA receptor in a ligand-free conformation. Front. Mol. Neurosci 4, 1–15. [DOI] [PMC free article] [PubMed] [Google Scholar]
- Min K, Cho I, Choi M, Chang JB, 2019. Multiplexed expansion microscopy of the brain through fluorophore screening. Methods [DOI] [PubMed] [Google Scholar]
- Mosca TJ, Luginbuhl DJ, Wang IE, Luo L, 2017. Presynaptic LRP4 promotes synapse number and function of excitatory CNS neurons. Elife 6, 1–29. [DOI] [PMC free article] [PubMed] [Google Scholar]
- M’Saad O, Bewersdorf J, 2020. Light microscopy of proteins in their ultrastructural context. Nat. Commun 11, 1–15. [DOI] [PMC free article] [PubMed] [Google Scholar]
- Ortega JAA, Daley ELL, Kour S, Samani M, Tellez L, Smith HSS, Hall EAA, Esengul YTT, Tsai YHH, Gendron TFF, Donnelly CJJ, Siddique T, Savas JNN, Pandey UBB, Kiskinis E, 2020. Nucleocytoplasmic proteomic analysis uncovers eRF1 and nonsense-mediated decay as modifiers of ALS/FTD C9orf72 toxicity. Neuron 106, 90–107 e13. [DOI] [PMC free article] [PubMed] [Google Scholar]
- Park CE, Cho Y, Cho I, Jung H, Kim B, Shin JH, Choi S, Kwon S-K, Hahn YK, Chang J-B, 2020. Super-resolution three-dimensional imaging of actin filaments in cultured cells and the brain via expansion microscopy. ACS Nano [DOI] [PubMed] [Google Scholar]
- Pesce L, Cozzolino M, Lanzanò L, Diaspro A, Bianchini P, 2019. Measuring expansion from macro- to nanoscale using NPC as intrinsic reporter. J. Biophotonics 12, e201900018. [DOI] [PMC free article] [PubMed] [Google Scholar]
- Richardson DS, Lichtman JW, 2015. Clarifying tissue clearing. Cell 162, 246–257. [DOI] [PMC free article] [PubMed] [Google Scholar]
- Rodriguez AJ, Czaplinski K, Condeelis JS, Singer RH, 2008. Mechanisms and cellular roles of local protein synthesis in mammalian cells. Curr. Opin. Cell Biol [DOI] [PMC free article] [PubMed] [Google Scholar]
- Rust MJ, Bates M, Zhuang XW, 2006. Sub-diffraction-limit imaging by stochastic optical reconstruction microscopy (STORM). Nat. Methods 3, 793–795. [DOI] [PMC free article] [PubMed] [Google Scholar]
- Saka SK, Wang Y, Kishi JY, Zhu A, Zeng Y, Xie W, Kirli K, Yapp C, Cicconet M, Beliveau BJ, Lapan SW, Yin S, Lin M, Boyden ES, Kaeser PS, Pihan G, Church GM, Yin P, 2019. Immuno-SABER enables highly multiplexed and amplified protein imaging in tissues. Nat. Biotechnol 37, 1080–1090. [DOI] [PMC free article] [PubMed] [Google Scholar]
- Sarkar D, Kang J, Wassie AT, Schroeder ME, Peng Z, Tarr TB, Tang A-H, Niederst E, Young JZ, Tsai L-H, Blanpied TA, Boyden ES, 2020. Expansion revealing: decrowding Proteins to unmask invisible brain nanostructures. bioRxiv [Google Scholar]
- Scarnati MS, Kataria R, Biswas M, Paradiso KG, 2018. Active presynaptic ribosomes in mammalian brain nerve terminals, and increased transmitter release after protein synthesis inhibition. bioRxiv 1–28. [DOI] [PMC free article] [PubMed] [Google Scholar]
- Scheible MB, Tinnefeld P, 2018. Quantifying expansion microscopy with DNA origami expansion Nanorulers. bioRxiv [Google Scholar]
- Schuman EM, 1999. mRNA trafficking and local protein synthesis at the synapse. Neuron [DOI] [PubMed] [Google Scholar]
- Sekar A, Bialas AR, De Rivera H, Davis A, Hammond TR, Kamitaki N, Tooley K, Presumey J, Baum M, Van Doren V, Genovese G, Rose SA, Handsaker RE, Daly MJ, Carroll MC, Stevens B, McCarroll SA, 2016. Schizophrenia risk from complex variation of complement component 4. Nature 530, 177–183. [DOI] [PMC free article] [PubMed] [Google Scholar]
- Shi X, Li Q, Dai Z, Tran A, Feng S, Ramirez AD, Lin Z, Wang X, Chow TT, Seiple IB, Huang B, 2019. Label-retention expansion microscopy. bioRxiv 687954 [DOI] [PMC free article] [PubMed] [Google Scholar]
- Shigeoka T, Jung H, Jung J, Turner-Bridger B, Ohk J, Lin JQ, Amieux PS, Holt CE, 2016. Dynamic axonal translation in developing and mature visual circuits. Cell 166, 181–192. [DOI] [PMC free article] [PubMed] [Google Scholar]
- Sograte-Idrissi S, Schlichthaerle T, Duque-Afonso CJ, Alevra M, Strauss S, Moser T, Jungmann R, Rizzoli S, Opazo F, 2019. Circumvention of common labeling artifacts using secondary nanobodies. bioRxiv 818351 [DOI] [PubMed] [Google Scholar]
- Suárez LM, Solís O, Caramés JM, Taravini IR, Solís JM, Murer MG, Moratalla R, 2014. L-DOPA treatment selectively restores spine density in dopamine receptor d2-expressing projection neurons in dyskinetic mice. Biol. Psychiatry 75, 711–722. [DOI] [PubMed] [Google Scholar]
- Sun D, Fan X, Zhang H, Huang Z, Tang Q, Li W, Bai J, Lei X, Chen X, 2020. Click-ExM enables expansion microscopy for all biomolecules. bioRxiv [DOI] [PubMed] [Google Scholar]
- Taoufik E, Kouroupi G, Zygogianni O, Matsas R, 2018. Synaptic dysfunction in neurodegenerative and neurodevelopmental diseases: An overview of induced pluripotent stem-cell-based disease models. Open Biol 8. [DOI] [PMC free article] [PubMed] [Google Scholar]
- Tillberg PW, Chen F, Piatkevich KD, Zhao Y, Yu C-C, English B, Gao L, Martorell A, Suk H-JJ, Yoshida F, DeGennaro EMEM, Roossien DH, Gong G, Seneviratne U, Tannenbaum SR, Desimone R, Cai D, Boyden ESES, 2016. Protein-retention expansion microscopy of cells and tissues labeled using standard fluorescent proteins and antibodies. Nat. Biotechnol 34, 987–992. [DOI] [PMC free article] [PubMed] [Google Scholar]
- Tomer R, Ye L, Hsueh B, Deisseroth K, 2014. Advanced CLARITY for rapid and high-resolution imaging of intact tissues. Nat. Protoc 9, 1682–1697. [DOI] [PMC free article] [PubMed] [Google Scholar]
- Tønnesen J, Nägerl UV, 2013. Superresolution imaging for neuroscience. Exp. Neurol 242, 33–40. [DOI] [PubMed] [Google Scholar]
- Truckenbrodt S, Maidorn M, Crzan D, Wildhagen H, Kabatas S, Rizzoli SO, 2018. X10 expansion microscopy enables 25-nm resolution on conventional microscopes. EMBO Rep 19 [DOI] [PMC free article] [PubMed] [Google Scholar]
- Truckenbrodt S, Sommer C, Rizzoli SO, Danzl JG, 2019. A practical guide to optimization in X10 expansion microscopy. Nat. Protoc 14, 832–863. [DOI] [PubMed] [Google Scholar]
- Tsanov N, Samacoits A, Chouaib R, Traboulsi A-M, Gostan T, Weber C, Zimmer C, Zibara K, Walter T, Peter M, Bertrand E, Mueller F, 2016. smiFISH and FISH-quant - a flexible single RNA detection approach with super-resolution capability. Nucleic Acids Res [DOI] [PMC free article] [PubMed] [Google Scholar]
- Vanheusden M, Vitale R, Camacho R, Janssen KPF, Acke A, Rocha S, Hofkens J, 2020. Fluorescence Photobleaching as an intrinsic tool to quantify the 3D expansion factor of biological samples in expansion microscopy. ACS Omega 5, 6792–6799. [DOI] [PMC free article] [PubMed] [Google Scholar]
- Wang IE, Lapan SW, Scimone ML, Clandinin TR, Reddien PW, 2016. Hedgehog signaling regulates gene expression in planarian glia. Elife 5. [DOI] [PMC free article] [PubMed] [Google Scholar]
- Wassie AT, Zhao Y, Boyden ES, 2019. Expansion microscopy: principles and uses in biological research. Nat. Methods 16, 33–41. [DOI] [PMC free article] [PubMed] [Google Scholar]
- Watabe-Uchida M, Zhu L, Ogawa SK, Vamanrao A, Uchida N, 2012. Whole-brain mapping of direct inputs to midbrain dopamine neurons. Neuron 74, 858–873. [DOI] [PubMed] [Google Scholar]
- Wei L, Chen Z, Shi L, Long R, Anzalone AV, Zhang L, Hu F, Yuste R, Cornish VW, Min W, 2017. Super-multiplex vibrational imaging. Nature 544, 465–470. [DOI] [PMC free article] [PubMed] [Google Scholar]
- Wickersham IR, Lyon DC, Barnard RJO, Mori T, Finke S, Conzelmann KK, Young JAT, Callaway EM, 2007. Monosynaptic restriction of Transsynaptic tracing from single, genetically targeted neurons. Neuron 53, 639–647. [DOI] [PMC free article] [PubMed] [Google Scholar]
- Willig KI, Rizzoli SO, Westphal V, Jahn R, Hell SW, 2006. STED microscopy reveals that synaptotagmin remains clustered after synaptic vesicle exocytosis. Nature 440, 935–939. [DOI] [PubMed] [Google Scholar]
- Xu H, Tong Z, Ye Q, Sun T, Hong Z, Zhang L, Bortnick A, Cho S, Beuzer P, Axelrod J, Hu Q, Wang M, Evans SM, Murre C, Lu LF, Sun S, Corbett KD, Cang H, 2019. Molecular organization of mammalian meiotic chromosome axis revealed by expansion STORM microscopy. Proc. Natl. Acad. Sci. U. S. A 116, 18423–18428. [DOI] [PMC free article] [PubMed] [Google Scholar]
- Younts TJ, Monday HR, Dudok B, Klein ME, Jordan BA, Katona I, Castillo PE, 2016. Presynaptic protein synthesis is required for Long-term plasticity of GABA release. Neuron 92, 479–492. [DOI] [PMC free article] [PubMed] [Google Scholar]
- Yu CCJ, Barry NC, Wassie AT, Sinha A, Bhattacharya A, Asano S, Zhang C, Chen F, Hobert O, Goodman MB, Haspel G, Boyden ES, 2020. Expansion microscopy of C. elegans. Elife 9, 1–78. [DOI] [PMC free article] [PubMed] [Google Scholar]
- Zhang L, Bailey JB, Subramanian RH, Tezcan FA, 2018. Hyperexpandable, self-healing macromolecular crystals with integrated polymer networks. Nature 557, 86–91. [DOI] [PMC free article] [PubMed] [Google Scholar]
- Zhao Y, Bucur O, Irshad H, Chen F, Weins A, Stancu AL, Oh E-YY, Distasio M, Torous V, Glass B, Stillman IE, Schnitt SJ, Beck AH, Boyden ES, 2017. Nanoscale imaging of clinical specimens using pathology-optimized expansion microscopy. Nat. Biotechnol 35, 757–764. [DOI] [PMC free article] [PubMed] [Google Scholar]
- Zwettler FU, Reinhard S, Gambarotto D, Bell TDM, Hamel V, Guichard P, Sauer M, 2020. Molecular resolution imaging by post-labeling expansion single-molecule localization microscopy (Ex-SMLM). Nat. Commun 11, 3388. [DOI] [PMC free article] [PubMed] [Google Scholar]