Abstract
Clinical evidence suggests the central nervous system is frequently impacted by SARS-CoV-2 infection, either directly or indirectly, although the mechanisms are unclear. Pericytes are perivascular cells within the brain that are proposed as SARS-CoV-2 infection points. Here we show that pericyte-like cells (PLCs), when integrated into a cortical organoid, are capable of infection with authentic SARS-CoV-2. Before infection, PLCs elicited astrocytic maturation and production of basement membrane components, features attributed to pericyte functions in vivo. While traditional cortical organoids showed little evidence of infection, PLCs within cortical organoids served as viral ‘replication hubs’, with virus spreading to astrocytes and mediating inflammatory type I interferon transcriptional responses. Therefore, PLC-containing cortical organoids (PCCOs) represent a new ‘assembloid’ model that supports astrocytic maturation as well as SARS-CoV-2 entry and replication in neural tissue; thus, PCCOs serve as an experimental model for neural infection.
Initially thought of as primarily a respiratory infection, SARS-CoV-2 is now implicated in substantial central nervous system (CNS) pathology1-3. CNS symptoms include ischemic strokes, hemorrhages, seizures, encephalopathy, encephalitis/meningitis, anosmia, postinfectious syndromes and neurovasculopathy, collectively described in up to 85% of intensive care unit patients4-7. Several reports appear to meet established criteria for infectious encephalitis8.
SARS-CoV-2 can utilize angiotensin-converting enzyme 2 (ACE2) as a receptor, although other receptors have been proposed9,10. Recent studies on single-cell RNA sequencing (scRNA-seq) datasets indicated low levels of ACE2 expression in brain cells; however, expression is relatively high in some neurovascular unit (NVU) components, particularly in brain pericytes11-14. Autopsy series have suggested the potential for SARS-CoV-2 to spread throughout the brain, especially within vascular and immune cells. They note ischemic brain lesions accompanied by widespread activation of astrocytes and cell death1,15. The potential for a SARS-CoV-2 elicited neurovasculopathy supports the development of new models to study tropism and pathology.
Brain pericytes are derived from neural crest stem cells (NCSCs) and are uniquely positioned in the NVU, physically linking endothelial and astrocytic cells16. Embedded within the basement membrane, pericytes connect, coordinate and regulate signals from neighboring cells to generate responses critical for CNS function in both healthy and disease states, including blood–brain barrier permeability, neuroinflammation, neuronal differentiation and neurogenesis in the adult brain17-19.
Results
SARS-CoV-2 productively infects PLCs.
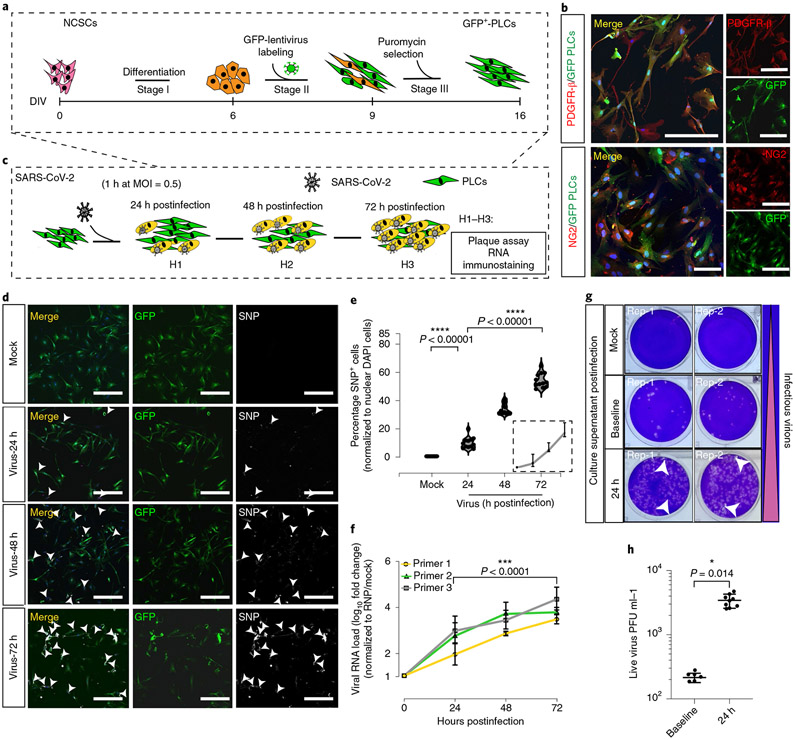
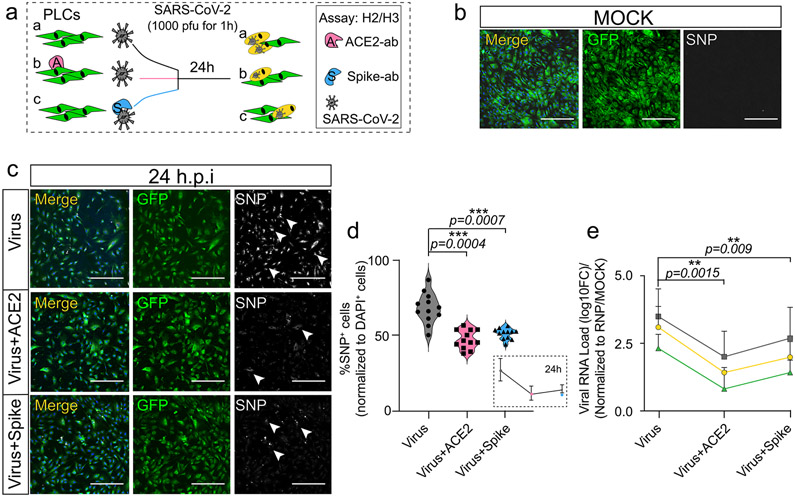
We found that green fluorescent protein (GFP)+ PLCs generated in vitro from human pluripotent stem cell (hPSC)-derived NCSCs expressed the standard pericyte markers NG2 and PDGFR-β (Fig. 1a,b)20. We detected appreciable ACE2 messenger RNA and protein in PLCs cultured two-dimensionally compared with cultured human neural precursors (Extended Data Fig. 1a-d)14,21. To assess SARS-CoV-2 PLC tropism, we exposed PLCs to authentic SARS-CoV-2 at a multiplicity of infection (MOI) of 0.5, then collected the supernatant and cells daily (Fig. 1c). We found that the percentage of SARS-CoV-2 nucleocapsid protein+ cells and viral RNA as measured by quantitative PCR with reverse transcription (RT–qPCR) increased daily up to 72 h postinfection, from 0 to 65% SARS-CoV-2 nucleocapsid protein+, with viral RNA load increasing up to approximately 1,000-fold (Fig. 1d,e). Plaque assay from the PLC supernatants on Vero E6 cells showed approximately 100-fold increased infectious virus production at 24 h postinfection with increased viral RNA as well as viral titers compared to baseline, suggesting viral production by PLCs (Fig. 1f-h)22. Furthermore, we found that ACE2 receptor-blocking antibody partially prevented SARS-CoV-2 infection of PLCs (Extended Data Fig. 2a-e)23.
Fig. 1 ∣. SARS-CoV-2 productively infects PLCs.
a, GFP+ PLC generation protocol. b, Immunostaining of GFP+ PLCs shows expression of the pericyte markers PDGFR-β and NG2. GFP+ PLCs cultured on coverslips were fixed and immunostained (DAPI, blue). Scale bar, 100 μm. n = 12 includes 3 biological replicates (3 independent PLC cultures) and 4 technical replicates (4 different image regions). c, SARS-CoV-2 infection of PLC protocol. At each time point, RNA was isolated; in parallel, cells were fixed and immunostained. d, SARS-CoV-2-nucleocapsid protein covisualized with GFP. Nuclei stained with DAPI. Scale bar, 400 μm. GFP, PLCs. Arrowheads, SARS-CoV-2 nucleocapsid protein+ cells. n = 12 includes 3 biological replicates (3 independent PLC cultures) and 4 technical replicates (4 different image regions). e, Quantification of SARS-CoV-2 nucleocapsid protein expression from d. SARS-CoV-2 nucleocapsid protein+ cells were counted in ImageJ. Nuclear DAPI was used as reference. n = 12 includes 3 PLC coverslips from 3 individual biological cultures and 4 image regions from each coverslip. Two-tailed t-test with Šidák multiple comparisons correction was used to determine significance. ****p < 0.00001, P = 0.00000684 for 24 h versus mock and P = 0.00000193 for 72 h versus 24 h postinfection. f. RT-qPCR for SARS-CoV-2 shows increasing viral RNA load over time. RNP was used as reference. n = 12 includes PLCs from 3 individual cultures and 4 technical replicates for each biological replicate. Two-tailed t-test with Šidák multiple comparisons test correction was used to calculate significance. ***P < 0.0001, P = 0.0000749. g, Plaque assay showing increased infectious virions in culture supernatant 24 h postinfection compared to baseline. Mock was used as negative control. Two replicates (rep-1, rep-2) from each condition are shown. h, Plaque assay indicating secretion of live virus into culture supernatant at 24 h postinfection; n = 9 includes 3 replicates generated from 3 different biological replicates (3 individual PLC cultures) and 3 technical replicates for 24 h; n = 6 for baseline infection includes 2 biological replicates (2 different cultures) and 3 technical replicates, P = 0.014, *P < 0.1. Two-way ANOVA with Šidák multiple comparisons test was used for statistics. PLCs were derived from NCSCs generated with H9 cells. e,f,h, The error bars represent the mean ± 1 s.d.
PCCO generation and characterization.
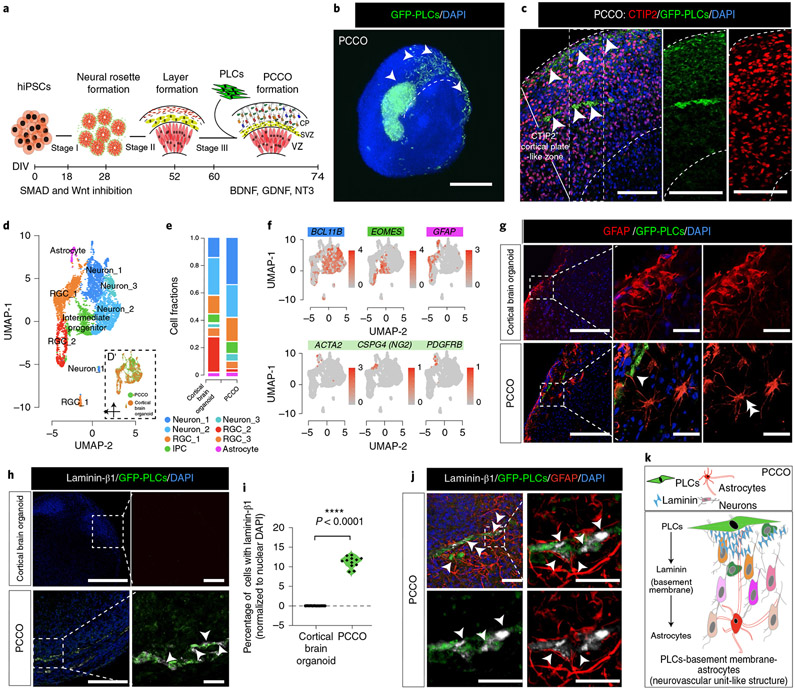
Demonstrating the infectability of PLCs led us to explore their effects on SARS-CoV-2 tropism in a more physiologically relevant environment. Thus, we employed cortical brain organoids; to this end, we developed an ‘assembloid’24 where GFP+ PLCs are integrated into cortical brain organoids at the corticogenesis stage (60–74 d in vitro). We generated PCCOs by seeding 2 × 10⁵ GFP+ PLCs into wells containing cortical brain organoids at 60 d in vitro (Fig. 2a, Supplementary Fig. 1a-d and Supplementary Dataset 1; see Methods for the detailed culture conditions). By 74 d in vitro, using tissue clearing and light sheet fluorescence microscopy, we observed GFP+ cells integrating into cortical brain organoids as cell clusters, subsequently spreading across the surface and penetrating the CTIP2+ cortical plate-like zone in cortical brain organoids (Fig. 2b,c).
Fig. 2 ∣. PCCOs incorporate PLCs into cortical brain organoids.
a, PCCO generation protocol. b, Light sheet fluorescence microscopy image of GFP+ PLCs invading cortical organoids. Bar, 800 μm; arrowheads, PLCs. c, GFP+ PLC penetration into the CTIP2+ cortical plate-like zone. Nuclei were stained with DAPI. Bars, 400 μm; arrowheads, PLCs. d, Merged UMAP shows PCCO cellular compositions; eight cell clusters are annotated according to standard marker gene expression. Split UMAP shows the contribution of cortical brain organoids and PCCOs. RGC, radial glia cell. e. Cell fraction plot for proportionate cell clusters in cortical brain organoids and PCCOs. IPC, intermediate progenitor cell. f, Feature plots for cortical brain organoids and PCCOs. BCL11B, deep-layer neurons; EOMES, intermediate progenitors; GFAP, astrocytes; ATCA2, CSPG4 (NG2) and PDGFRB, PLCs. g, Star-shaped astrocytic morphology seen in PCCOs but not cortical brain organoids. GFP, PLCs. Scale bar, 400 μm; enlargement bar, 100 μm. The double arrowhead indicates the astrocytic end feet connection. The single arrowhead indicates star-shaped astrocytes. h, Laminin-β1 expression and colocalization adjacent to GFP+ PLCs, evident only in PCCOs. Bar, 400 μm; enlargement bar, 100 μm. The single arrowheads indicate laminin (in gray). i, Quantification of h. Cells with adjacent laminin-β1 were counted in ImageJ. DAPI+ nuclei were used as reference; n = 12 includes 3 PCCOs derived from 2 healthy individuals in unrelated families and H1 cells and 4 image regions from each section. A two-tailed t-test with Šidák multiple comparisons test correction was used to determine significance ****P < 0.0001, P = 0000147. j, Immunostaining for anti-laminin-β1 and anti-GFAP colocalized with GFP+ PLCs in PCCOs. Right: zoom-in of small region. The bottom row shows two-color staining. Scale bar, 40 μm. The single arrowheads indicate laminin-β1 (gray). The double arrowheads indicate the astrocytic end feet connection. DAPI (blue) was used to stain nuclei. PLCs were derived from NCSCs generated with H9 cells. k, Model of pericyte basement membrane-astrocyte structure in PCCOs. PLCs express laminin and promote astrocytic maturation and end feet attachment to PLCs. b, n = 8 includes 4 biological replicates (PCCOs generated from H1, iPSC-Line1, iPSC-Line2 and iPSC-Line3) and 2 technical replicates (two PCCOs for each of the biological replicates). c,g–i, n = 12 includes 4 biological replicates (PCCOs generated from H1, iPSC-Line1, iPSC-Line2 and iPSC-Line3) and 3 technical replicates (3 PCCOs for each of the biological replicates). See replications in Extended Data Figs. 9 and 10.
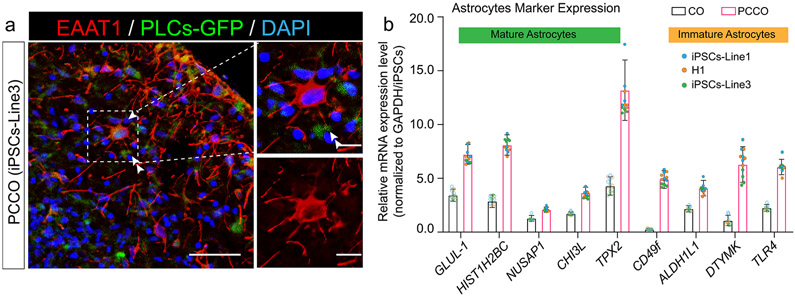
We found that PCCOs maintained similar structural architecture and cellular compositions as traditional cortical brain organoids (Fig. 2d-f and Supplementary Figs. 2a-c, 3a,b and 4a,b). The GFP+ PLCs within PCCOs showed GFP mRNA expression and retained standard pericyte marker expression (Supplementary Fig. 5a,b). However, we found that within PCCOs, PLCs attuned GFAP+ and EAAT1+ (encoded by SLC1A3) astrocyte expression and morphology, which more closely resembled a classically described star shape with end feet-like structures seen in mature astrocytes that were adjacent to PLCs (Fig. 2g and Extended Data Fig. 3a,b)25-27. These results evidenced features of astrocytic maturation compared to traditional cortical brain organoids28. Moreover, we detected laminin-β1 protein adjacent to PLCs, suggesting accumulation of basement membrane, which is normally absent from traditional cortical brain organoids (Fig. 2h,i). Confocal imaging confirmed localization of astrocytes and PLCs with laminin (Fig. 2j). To evaluate if the effect of PLCS in PCCOs was robust, we generated PCCOs using several different induced pluripotent stem cell (iPSC) line-derived cortical brain organoids and found nearly identical results (Extended Data Figs. 3-5). Together, these results suggest that PCCOs recapitulate the structural architecture of PLC–basement membrane–astrocyte interaction described within the vertebrate neurovascular unit (Fig. 2k)16.
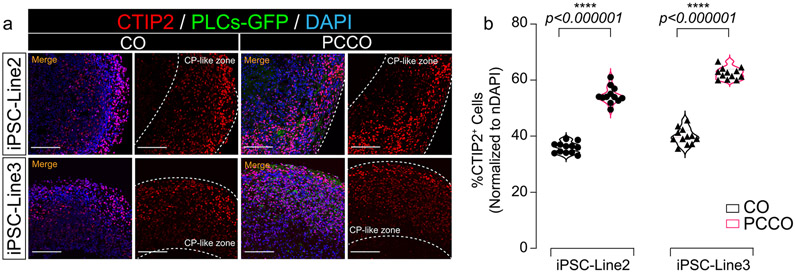
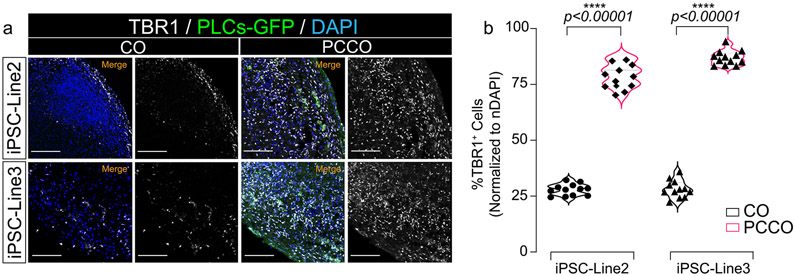
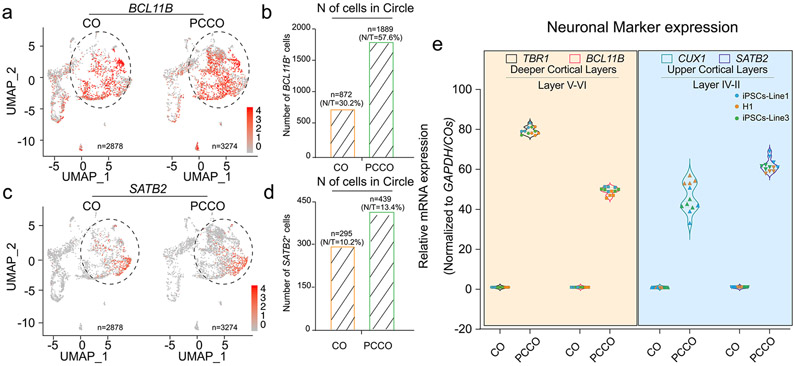
We additionally characterized PCCOs by scRNA-seq. Compared to cortical brain organoids, PCCOs showed an approximately 23% shift from progenitor to deeper cortical layer neuronal populations, which was validated with RT–qPCR and CTIP2/TBR1 immunostaining (Fig. 2e, Extended Data Figs. 4a,c, 5a,b and 6a-e and Supplementary Datasets 2 and 3)29-31. Tandem mass spectrometry using isobaric labeling of PCCOs compared with cortical brain organoids supported these results, revealing that GFAP, TBR1, DCX and STMN2 formed an upregulated protein module, suggesting an effect of PLCs on neuronal differentiation in PCCOs (Extended Data Fig. 7a,b and Supplementary Dataset 2).
SARS-CoV-2 productively infects PCCOs.
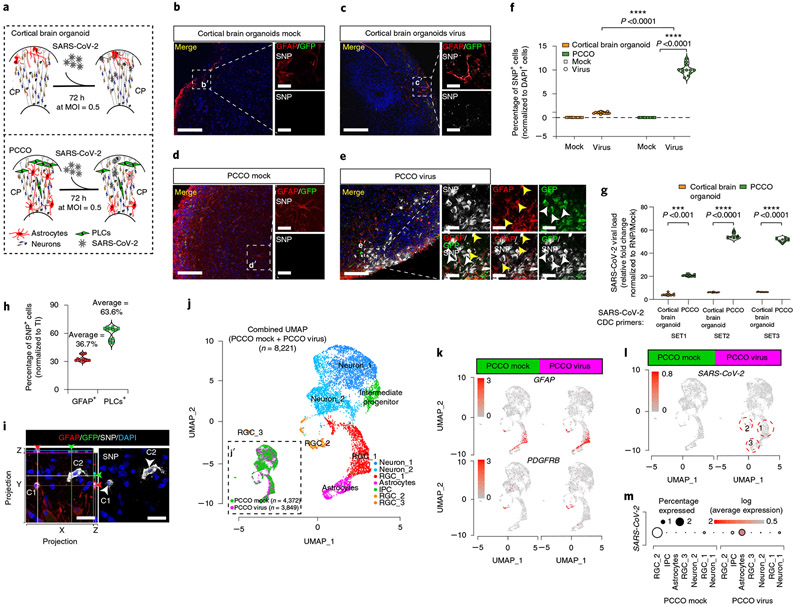
We next exposed PCCOs to SARS-CoV-2 at an MOI of 0.5 for 72 h (Fig. 3a). Compared with traditional cortical brain organoids, which showed scant neuroglial cells positive for the established viral SARS-CoV-2 nucleocapsid protein as reported32-34, PCCOs showed a significantly higher proportion of SARS-CoV-2 nucleocapsid protein+ cells (10 versus 1% in PCCOs versus cortical brain organoids, P < 0.0001, t-test; Fig. 3b-f, Extended Data Figs. 8a,b and 9 and Supplementary Dataset 3). RT–qPCR showed a corresponding approximately 50-fold increase in viral RNA in exposed PCCOs over cortical brain organoids (Fig. 3g and Supplementary Dataset 3).
Fig. 3 ∣. SARS-CoV-2 productively infects PCCOs but not cortical brain organoids.
a, Protocol for SARS-CoV-2 infection in cortical brain organoids and PCCOs. b, GFAP and SARS-CoV-2 nucleocapsid protein staining under mock infection in COs. c, GFAP and SARS-CoV-2 nucleocapsid protein staining with virus in COs. d, GFAP and SARS-CoV-2 nucleocapsid protein staining under mock infection in PCCOs. e, GFAP and SARS-CoV-2 nucleocapsid protein staining with virus in PCCOs. GFP, PLCs; DAPI, nuclei; GFAP, astrocytes. A dramatic increase in SARS-CoV-2 nucleocapsid protein signal was seen in PCCOs compared with cortical brain organoids. Scale bar, 400 μm. b′–e′, zoom-in of b–e. The yellow arrowheads indicate GFAP+/SARS-CoV-2 nucleocapsid protein+ double-positive, that is, infected astrocytes. The white arrowheads indicate SARS-CoV-2 nucleocapsid protein+/GFP+ double-positive, that is, infected PLCs. Scale bar, 20 μm. f, Quantification of the SARS-CoV-2 nucleocapsid protein+ cells shown in b–e. The numbers of nuclear DAPI were used as reference. g, RT-qPCR using SARS-CoV-2 primers. Increased viral RNA load in PCCOs 72 h postinfection. Mock infection was used as negative control. h, Quantification of SARS-CoV-2 nucleocapsid protein+ cells in e′; nuclear DAPI was used as reference. All ratios were normalized to total number of infected cells. Approximately two-thirds of infected cells were PLCs and one-third were astrocytes. i, SARS-CoV-2 (gray) can infect both astrocytes (GFAP+, C1) and PLCs (GFP+, C2) in PCCOs. Side bars: XZ and YZ maximum projections demonstrating that these are distinct cells. Scale bar, 20 μm. j,j′, Merged UMAP shows cellular compositions in PCCOs. Seven cell clusters were annotated according to standard marker gene expression. The split UMAP shows the contribution of PCCO mock and PCCO virus in j′. k, Feature plots show the expression of GFAP and PDGFRB in PCCO mock and PCCO virus. GFAP, astrocytes; PDGFRB, PLCs. l, Feature plots show SARS-CoV-2 (that is, any transcript of SARS-CoV-2) expression in PCCOs virus. m, Dot plots showing that approximately 2% of astrocytes display evidence of SARS-CoV-2 infection. f, n = 12 includes 3 PCCOs derived from iPSC lines from 2 healthy individuals from unrelated families and H1 cells and 4 image regions from each section. g, n = 12 includes 3 PCCOs derived from iPSC lines from 2 healthy individuals from unrelated families and H1 cells and 4 technical replicates for each biological replicate. GAPDH was used as reference. f,g, A two-tailed t-test with Šidák multiple comparisons correction was used to determine significance. ***P < 0.001, ****P < 0.0001. f, P = 0.0000654 for PCCO virus versus cortical brain organoid virus, P = 0.0000433 for PCCO virus versus PCCO mock. g, P = 0.00076 for SET1, P = 0.0000353 for SET2 and P = 0.0000433 for SET3. PLCs were derived from NCSCs generated with H9 cells. b–e,i, n = 12 includes 3 biological replicates and 4 technical replicates. See the replicates in Extended Data Fig. 9 and Supplementary Figs. 6 and 7.
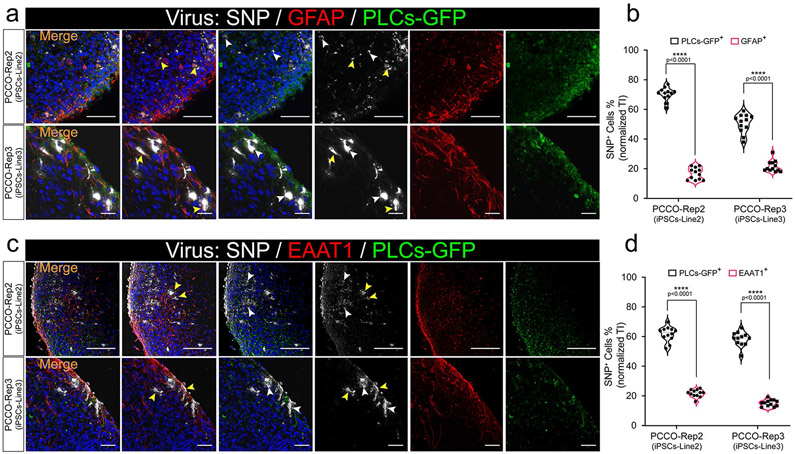
We then compared the cellular infection vulnerability to SARS-CoV-2 in cortical brain organoids versus PCCOs. In cortical brain organoids, we found <1% NeuN+/SARS-CoV-2 nucleocapsid protein+ cells or GFAP+/SARS-CoV-2 nucleocapsid protein+ cells and no discernible effect of viral exposure on cortical brain organoid characteristics (Supplementary Figs. 6 and 7a,b). In contrast, in virus-exposed PCCOs we found the majority of SARS-CoV-2 nucleocapsid protein+ cells colocalized with GFP+ PLCs and surrounding GFAP+ astrocytes (Fig. 3e,e′,h and Extended Data Fig. 10a-d). Confocal imaging demonstrated that astrocytes were not only adjacent to the infected PLCs but were themselves SARS-CoV-2 nucleocapsid protein+ (Fig. 3i). To transcriptionally profile cellular constituents, we performed scRNA-seq at 72 h postinfection. We detected SARS-CoV-2 reads in approximately 2% of cells in PCCOs, overwhelmingly confined to astrocytes, but not neurons (Fig. 3j-m). There were no detectable SARS-CoV-2 reads in infected cortical brain organoids (Supplementary Figure 7c-e and Supplementary Dataset 3). These data suggest that infection of astrocytes is mediated by the presence of the PLCs population.
PCCO SARS-CoV-2 infection elicits a type I interferon astrocytic response.
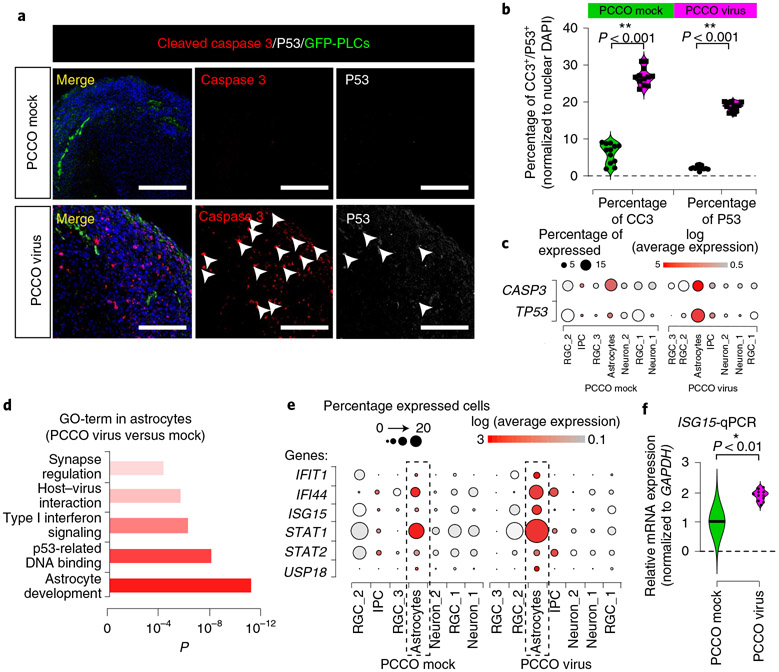
Finally, to explore the pathogenesis of SARS-CoV-2 in PCCOs, we performed immunostaining and observed a substantial increase (approximately 20%) in the percentage of cells evidencing programmed cell death (cleaved caspase 3 and p53+) in infected PCCOs (Fig. 4a,b and Supplementary Dataset 3). scRNA-seq indicated that the source of cell death was largely confined to astrocytes, which is consistent with the described selective vulnerability (Fig. 4c)35. Gene ontology (GO) term analysis of differentially expressed genes specific to astrocytes highlighted inflammatory and genotoxic stress activation (Fig. 4d). This correlated with activation of the type I interferon transcriptional response and upregulation of IFIT1, IFI44 and ISG15 in virus-exposed compared to mock-infected PCCOs (Fig. 4e and Supplementary Dataset 4)36. Several type I interferons signaling cascade genes (STAT1, STAT2) and an ISG15 effector gene (USP18) were also upregulated (Fig. 4f and Supplementary Dataset 3)37. Increased expression of ISG15 was confirmed by RT–qPCR in infected PCCOs (Fig. 4g). These results implicate astrocytic pathology in SARS-CoV-2 inflammatory brain pathology, mediated through the type I interferon pathway.
Fig. 4 ∣. PCCO SARS-CoV-2 infection elicits type I interferon astrocytic response.
a, Cleaved caspase 3 (CC3) and p53 staining is positive in PCCOs after infection. CC3, red; DAPI, nuclei; GFP, PLCs; P53, gray. Scale bar: 400 μm. Arrowheads, CC3+ or p53+ cells. b, Quantification of a. Nuclear DAPI was used as reference. c, Dot plots showing the expression of CASP3 and TP53 in PCCO mock and virus groups. d, GO term with significance for functional analysis in astrocytes. e, Dot plots showing the expression of type I interferon-related genes. f, qPCR for ISG15 mRNA expression; GAPDH, reference. Mock infection was used as negative control. a,b,f, n = 12 includes 3 biological replicates (3 PCCOs derived from 2 healthy individuals in unrelated families and H1 cells) and 4 technical replicates for each biological replicate. b,f, GAPDH was used as reference. A two-tailed t-test with Šidák multiple comparisons correction was used to determine significance. b, **P < 0.001, P = 0.000493 for percentage of CC3 and P = 0.000733 for percentage of P53. f, *P < 0.01, P = 0.00636. In the dot plots, dot size indicates the percentage of cells demonstrating gene expression. Dot plot shading: average expression in log fold scale.
Discussion
In this study, we demonstrated that PLCs can be productively infected by SARS-CoV-2; through the integration of PLCs into cortical brain organoids, we established a new PCCO ‘assembloid’. Within PCCOs, we found that PLCs establish the characteristics of the PLC–basement membrane–astrocytes structure and increase the cellular proportion of the neuronal population, mimicking reported functions of human brain pericytes in vivo. On exposure to SARS-CoV-2, we observed robust infection within PCCOs and consequent induction of astrocyte death and type I interferon responses. Furthermore, we demonstrated that PLCs can serve as viral ‘replication hubs’, supporting viral invasion and spread to other cell types, including astrocytes.
Although SARS-CoV-2 invasion into the human CNS has been modeled in three-dimensional brain organoids, choroid plexus organoids and K18-hACE2 transgenic mice, evidence suggests that most neural cells have little to no capacity for SARS-CoV-2 infection. On the other hand, the presence of any cells expressing ACE2 or other receptors may be sufficient to initiate infection32-34,38,39, motivating further work to understand the receptor expression profile and impact on infection at the human neurovascular unit in vivo. Drawing on clinical and experimental data supporting potential vascular entry and ACE2 expression in pericytes, our PCCO SARS-CoV-2 infection model presents an alternative route to infection. The PCCO model could be further improved by incorporating other neurovascular unit component cell types, which might lend itself to other uses40. Our work provides a powerful model to study SARS-CoV-2 and may be useful to model other infectious diseases.
Methods
hIPSCs, NCSC culture and constructs.
HEK293T, Hela (sex typed as female) and H1-hESC (sex typed as male) cells were obtained from ATCC (CRL-11268 and CCL-2) and WiCell (WAe001-A), respectively and were not authenticated further. Human iPSCs from healthy donors were obtained from CIRM (CIRM-IT1-06611). The recruitment and sourcing of fibroblast cells were conducted according to a standard guideline under institution review board approval (no. 140028XF) to J. Gleeson. Generation of NCSCs was described previously20. All cells were regularly Mycoplasma-negative. The lentiviral packaging plasmids pMD2.G and pPAX2 were obtained from Addgene.
Human cortical brain organoid and PCCO culture.
H1 and hiPSCs reprogrammed at Cellular Dynamics (see Extended Data Fig. 3 for details) were maintained in mTeSR medium and passaged according to the manufacturer’s recommendations. Cortical brain organoids were generated as described previously41,42. For PCCO generation, at cortical brain organoid 60 d in vitro, 2 × 10⁵ GFP+ PLCs were integrated into each cortical brain organoid in a low-attachment 96-well plate. PLC-integrated cortical brain organoids were maintained in PCCO medium for 14 d. PCCO were maintained in the maturation medium of cortical brain organoids (10% FCS) for 14 d in the presence of brain-derived neurotrophic factor, glial cell line-derived neurotrophic factor and neurotrophin-3. At day 74, PCCOs were changed into long-term maintenance medium (20% FCS) for long-term culture.
SARS-CoV-2 infection of PLCs, cortical brain organoids and PCCOs and plaque assay.
All work with SARS-CoV-2 was conducted in biosafety level 3 conditions at the University of California San Diego (UCSD) according to the guidelines approved by the Institutional Biosafety Committee. The SARS-CoV-2 isolate USA-WA1/2020 (BEI Resources) was propagated and infectious units were quantified by plaque assay using Vero E6 (ATCC) cells. The infection details are shown in the Supplementary Note.
ACE2 antibody in SARS-CoV-2 PLC infection.
PLCs were preincubated with 20 μg ml−1 ACE2 antibody for 30 min at 37 °C in a final volume of 200 μl per well of PLC medium, as described above. PLCs were then infected with 103 plaque-forming units (PFUs) of SARS-CoV-2 virus for 1 h at 37 °C and washed 3 times with PBS; 200 μl per well of new medium was added. After 24 h of infection, PLCs were fixed using 4% paraformaldehyde (PFA) or collected in TRIzol for analysis. Anti-SARS-CoV-2 spike antibody (1:100 dilution, antibody ID AB_2827980; Sino Biological) preincubated with virus for 30 min at 37 °C was used as control.
Detection of viral mRNA and replication using RT–qPCR.
For viral RNA quantification, PLCs, cortical brain organoids or PCCOs were washed twice with PBS and lysed in TRIzol. RNA was extracted using the QIAGEN RNA extraction kit. Then, 2 μg of RNA was used to generate complementary DNA with the SuperScript III First Strand Synthesis Kit (Invitrogen); 20 ng of cDNA was used to perform RT–qPCR with the iTaq Universal SYBR Green Supermix and CDC-N1/N2/N3-SARS-CoV-2 primer mix (Integrated DNA Technologies) at a final concentration of 100 nM for each primer using a Bio-Rad Laboratories Real-Time PCR System. All the RT–qPCR primers are listed in Supplementary Table 1.
Immunostaining and light sheet fluorescence imaging of PCCOs and cortical brain organoids.
Cortical brain organoids and PCCOs were fixed in 4% PFA for 72 h before removal from biosafety level 3, then embedded in 15%/15% gelatin/sucrose solution and sectioned at 20 μm. The sections were then permeabilized in 0.5% Triton X-100, blocked with 5% BSA and incubated with primary antibodies: SOX2 (1:100 dilution, catalog no. AF2018-SP; R&D Systems); TUJ1 (1:1,000 dilution, catalog no. 801202; BioLegend); cleaved caspase 3 (1:500 dilution, catalog no. 9661S; Cell Signaling Technology); Ki67 (1:1,000 dilution, catalog no. 550609; BD Biosciences); CTIP2 (1:500 dilution, catalog no. ab28448; Abcam); TBR2 (1:250 dilution, catalog no. EPR19012; Abcam); GFAP (1:250 dilution, catalog no. ab4674; Abcam); TBR1 (1:250 dilution, catalog no. ab183032; Abcam); Laminin beta 1 (1:100 dilution, catalog no. ab44941; Abcam); SARS-CoV/SARS-CoV-2 Nucleocapsid (1:500 dilution, research resource identifier AB_2827977; SinoBiological); NeuN (1:100 dilution, catalog no. ab177487; Abcam), p53 (1:300 dilution, catalog no. ab90363; Abcam); PDGFR-β (1:100, catalog no. AF1042; R&D Systems); αSMA (1:200 dilution, catalog no. 14-9760-82; Invitrogen); NG2 (1:100 dilution, catalog no. PA5-92029; Thermo Fisher Scientific); and ACE2 (1:100 dilution, catalog no. AF933; R&D Systems) in 5% BSA/0.5% Triton X-100 in PBS at standard dilutions overnight at 4 °C. Next day, sections were incubated with secondary antibodies: Alexa Fluor 488 donkey anti-mouse lgG (H+L) (1:1,000 dilution, catalog no. 1915874); Alexa Fluor 594 donkey anti-rabbit lgG (H+L) (1:1,000, catalog no. 1890862); Alexa Fluor 594 donkey anti-chicken lgG (H+L) (1:1,000 dilution, catalog no. 703585155); Alexa Fluor 594 donkey anti-rat lgG (H+L) (1:1,000 dilution, catalog no. 712585153); Alexa Fluor 594 donkey anti-mouse lgG (H+L) (1:1,000 dilution; catalog no. 715585150); Alexa Fluor 647 donkey anti-mouse lgG (H+L), (1:1,000, catalog no. 715605151); Alexa Fluor 647 donkey anti-rabbit lgG (H+L) (1:1,000 dilution; catalog no. 711605152) together with 4,6-diamidino-2-phenylindole (DAPI) (1:10,000) and mounted with Fluoromount-G. All the images were taken with a ZEISS LSM880 Airyscan, with post-acquisition analysis done in ImageJ v.6 (National Institutes of Health). For light sheet fluorescence microscopy, PCCOs were collected for clearing in PBS with Tween 20 in a 1.5-ml tube (1 PCCO per tube). CUBIC Version Advanced (2019)43 was used for clearing, then embedded into 1% agarose solution for imaging. A 5× lens was used for imaging with a ZEISS Z1 light sheet microscope according to the manufacturer’s recommendations. The images were processed with Imaris (v.9.7, Oxford Instruments).
Cortical brain organoid/PCCO dissociation and single-cell library preparation and sequencing.
Cortical brain organoids and PCCOs were dissociated using AccuMax; dead cells were removed by Dead Removal cocktail (annexin V; STEMCELL Technologies). Live cells were then used for 10x Genomics Gel Bead-In Emulsion (GEM) generation. The 10x scRNA-seq 3′ v.3.1 kit was used to generate the GEM; the cDNA and library were generated according to the manufacturer’s instructions. Libraries were sequenced using the NovaSeq 6000 system, PE150 base pairs for 20 M reads for each sample. See the full experimental details in the Supplementary Note.
Cortical brain organoid/PCCO tandem mass tag 4 quantitative protein mass spectrometry.
Three cortical brain organoids and three PCCOs were collected into 1.5 ml of cold PBS, then centrifuged at 1,500 r.p.m. at 4 °C for 10 min. After centrifugation, all PBS was removed and the cortical brain organoid/PCCO samples were flash-frozen in liquid nitrogen. The frozen cell pellets were analyzed by tandem mass tag 4 quantitative mass spectrometry at the UCSD Proteomics Core.
Data processing of scRNA-seq and mass spectrometry.
FASTQ files were aligned using the CellRanger v.4.0 (10x Genomics) count function with default settings. GRCh38/hg38 v.12 was used as the reference genome. GRChg38-2020 10x was used as the genome reference. The count matrix was generated using the count function with default settings. The SARS-CoV-2 (USA-WA1/2020) genome and GFP coding sequence were written into the GRChg38-2020 human genome reference as a gene with the mkref function in Cell Ranger v.4.0. Data from all runs were aggregated with the aggre function to ensure comparable read depth across runs; the combined output file of all runs was loaded into R (v.3.5.3) as a Seurat object44, log-normalized and scaled with a scale factor of 10,000. Cells with 2,500 genes expressed (unique molecular identifier count >0) were removed according to the standard analysis principle of Seurat. The top 2,000 highly variable genes were identified with Seurat’s FindVariableGenes, using vst as the method. We used principal component analysis (PCA) and uniform manifold approximation and projection (UMAP) as our main dimension reduction approach. PCA was performed with the RunPCA function in Seurat (v.3.1.5) using highly variable genes. After PCA, we conducted a jackstraw analysis with 100 iterations to identify statistically significant (P < 0.01) principal components that were driving systematic variation. We used UMAP to present data in two-dimensional coordinates, generated by the RunUMAP function in Seurat. Significant principal components identified by jackstraw analysis (first 30 principal components) were used as input. Perplexity was set to 30 (default). UMAP plots were generated using the R package ggplot2 (v.3.2.1). Clustering was performed using shared nearest neighbor and the Louvain–Jaccard analysis FindClusters function in Seurat with default settings. DEX analyses were conducted using the Seurat function FindAllMarkers. Briefly, we took a group of cells and compared them with the resting groups using a Wilcoxon rank-sum test. For each comparison, we only considered genes that were expressed by at least 50% of cells in either population, with a log fold change >0.69 according to the standard protocol. Genes that exhibited P values <0.01 were considered statistically significant after multiple testing corrections. All violin plots were generated using ggplot2; for the y axis, we calculated the normalized expression levels of certain genes, by transforming the feature counts for each cell using the natural log and dividing it by the total counts for that cell, then multiply by the scale factor using log1p. UMAP plots were generated using the UMAP plot function in the R package Seurat. Unless otherwise noted, all heatmaps were generated with the R function heatmap.3. The sctransform function was used to wrap the technical variation; cells were considered infected if they carried the transcripts aligned to the SARS-CoV-2 viral genome. The DAVID GO term analysis of the representation tests for both upregulated and downregulated genes in each condition is shown in Fig. 2 and Supplementary Datasets 3 and 4.
The mass spectrometry data were generated and analyzed by the proteomic core at UCSD (Supplementary Dataset 2). Proteins with a quality score >15 were used for DAVID GO term and STRING analysis in g:GOSt (https://biit.cs.ut.ee/gprofiler/gost) and STRING (https://string-db.org/) (Supplementary Dataset 2).
Statistics.
Statistical analysis was performed with Prism 8 (GraphPad Software). We compared viral titer by two-way analysis of variance (ANOVA) followed by a Šidák multiple comparisons test, *P < 0.1. In relative mRNA expression level, cell numbers and all other statistics, n = 12 includes 3 from different biological replicates (see the figure legends for detailed information) and 4 technical replicates. A two-tailed t-test was used to determine significance. This was followed by a Šidák multiple comparisons test correction. ****P < 0.00001, ***P < 0.0001, **P < 0.001, *P < 0.01. For the plaque assay, a two-way ANOVA was used to determine significance (*P < 0.01).
Reporting Summary.
Further information on research design is available in the Nature Research Reporting Summary linked to this article.
Extended Data
Extended Data Fig. 1 ∣. PLCs show appreciable ACE2 expression level.
a, RT-qPCR shows elevated ACE2 mRNA expression in PLCs. GAPDH: reference control, Hela-ACE2 stable cell line used as positive control, Hela cells used as negative control. n = 12 includes 3 independent biological replicates and 4 technical replicates for each biological replicate. Two tailed t-test was used to calculate significance followed by a Sidak multiple-comparison test correction. **** p < 0.00001, p = 0.00000323 for Hela-ACE2 vs. Hela, p = 0.00000098 for PLCs vs. Hela, and p = 0.00000179 for PCCOs-div74 vs. Hela. Cortical organoids (COs) were harvested at days in vitro (DIV) 60 and 126, PCCOs were harvested at DIV 74 for RNA extraction and qPCR. b-c, Western Blot shows ACE2 expression level in PLCs. β-actin used as loading control. Overexpression of ACE2 in HEK293T cells was used for validation. c, Hela cells used as negative control. Arrows: ACE2 band. n = 6 includes three biological replicates (three different cell cultures) and two technical replicates. d, Immunostaining shows ACE2 expression in PLCs. PLCs immunostained for ACE2, shown in red. PLCs labeled with GFP in green, blue: DAPI, bar: 20 μm. Confocal xz/yz projections used to show colocalization. n = 9 includes three biological replicates (three independent PLCs cultures) and three technical replicates.
Extended Data Fig. 2 ∣. ACE2 antibody inhibits SARS-CoV-2 infection of PLCs.
a, Schematic of ACE2 and SARS-CoV-2 spike antibody blocking SARS-CoV-2 infection of PLCs protocol. PLCs were pre-incubated with 20μg/ml ACE2 antibody or lgG negative control 30 min before infection with 1000 pfu SARS-CoV-2. As a positive control, virus was pre-incubated with anti-SARS-CoV-2 spike antibody for 30 min at 37°C before infection of PLCs. and 100μg/ml SARS-CoV-2 spike protein antibody for 1 h before infection. RNA was isolated and in parallel cells were fixed and immunostained at 24 hours post infection (h.p.i). (H2: qPCR, H3: immunostaining). b-c, SARS-CoV-2-Nucleocapsid protein (SNP) co-visualized with GFP. DAPI: nuclei, Bar: 400 μm. GFP: PLCs, Arrows: SNP+ cells. MOCK infection shown in b. SARS-CoV-2 infection (virus), SARS-CoV-2 blocking with ACE2 antibody, and SARS-CoV-2 blocking with SARS-CoV-2 Spike antibody shown in c respectively. n = 12 includes three biological replicates (three independent PLCs cultures) and four technical replicates (Four different image regions). d, Quantification of SNP expression from c. SNP+ cells were counted in ImageJ, nDAPI used as reference. n = 12 includes 3 PLC cover slips from three different biological PLCs cultures and 4 image regions from each cover slip. Two tailed t-test with Sidak multiple-comparison correction was used to determine the significance. *** p < 0.001. e, qRT-PCR for SARS-CoV-2 shows reduction viral RNA load following pre-incubation with ACE2 and spike blocking antibodies. Gray, green, and yellow represent three separate CDC-designated primer sets used for RT-qPCR. RNP used as reference. n = 12 includes PLCs from 3 different wells and 4 technical replicates for each biological replicate. Two tailed t-test with Sidak multiple-comparison test correction was used to calculate significance ** p < 0.01, error bar represents mean±1 SD.
Extended Data Fig. 3 ∣. PCCOs exhibit astrocytic maturation.
a, PCCOs at div74 were harvested and fixed for immunostaining against anti-EAAT1 to reveal the astrocytes in PCCOs. Bar: 100 μm. Zoom-in bar: 40 μm. GFP in green labels PLCs. EAAT1 in red marks astrocytes. DAPI in blue represents nucleus. Arrow points the star-shape astrocyte. Double arrow: astrocytic end-feet (picture represents the results from three individual PCCOs generated from two unrelated iPSC lines and H1 cells). n = 12 includes four biological replicates (PCCOs generated from H1, iPSC-Line1, iPSC-Line2, iPSC-Line3) and three technical replicates (three PCCOs for each of the biological replicates). b, mRNA levels of astrocyte marker genes increased in PCCOs compared to COs. COs and PCCOs at div74 were harvested for RNA extraction followed by qPCR using reported mature and immature astrocytes markers. GLUL-1, HIST1H2BC, NUSAP1, CHI3L, and TPX2 represent mature astrocytes. ALDH1L1, DTYMK and TLR4 represent immature astrocytes. CD49f indicates functional astrocytes. GAPDH used as reference. n = 12 includes 3 independent biological replicates (three individual PCCOs generated from two unrelated iPSC lines and H1 cells, see color code shown in b) and 4 technical replicates for each biological replicate, error bar represents mean±1 SD.
Extended Data Fig. 4 ∣. PCCOs exhibit increase in CTIP2+ deeper cortical layer neurons.
a, Immunostaining shows CTIP2 expression in cortical organoids (COs) and PCCOs (div74). Organoids were harvested for immunostaining against anti-CTIP2, shown in red. PLCs labeled with GFP in green, blue: DAPI, bar: 400 μm. b, Quantification of CTIP2+ cells in a. n = 12 includes 3 independent biological replicates from different COs/PCCOs and 4 different image regions from at least 3 different section regions in a. Two tailed t-test was used to determine the significance followed by a Sidak multiple-comparison test correction. **** p < 0.0001, p = 0.00000031 for iPSC-Line2 and p = 0.00000069 for iPSC-Line3. In a, COs and PCCOs were generated from the iPSC-Line2 and iPSC-Line3 respectively, GFP-PLCs were derived from H9 cells for both panels.
Extended Data Fig. 5 ∣. PCCOs exhibit increase in TBR1+ deeper cortical layer neurons.
a. Immunostaining shows TBR1 expression in COs and PCCOs (div74). Organoids were harvested for immunostaining against anti-TBR1, shown in gray. PLCs labeled with GFP in green, blue: DAPI, bar: 400 μm. b, Quantification of TBR1+ cells in a. n = 12 includes 3 independent biological replicates from different COs/PCCOs and 4 different image regions from at least 3 different section regions in a. Two tailed t-test was used to determine the significance followed by a Sidak multiple-comparison test correction. **** p < 0.00001, p = 0.000000091 for iPSC-Line2 and p = 0.00000029 for iPSC-Line3. In a, COs and PCCOs were generated from the iPSC-Line2 and iPSC-Line3 respectively, GFP-PLCs were derived from H9 cells for both panels.
Extended Data Fig. 6 ∣. sc-RNA-seq shows increased neuronal population in PCCOs.
a, Split UMAPs show BCL11B (CTIP2) expression in COs and PCCOs. b, Number of the BCL11B+ cells increased in PCCO compared to CO. Number of cells in circle shown in a were counted. N/T represents the percentage of BCL11B+ cells (N) in total cells (T). c, Split UMAPs show SATB2 expression in COs and PCCOs. d, Number of the SATB2+ cells increased in PCCOs compared to COs. Number of cells in circle shown in c were counted. N/T represents the percentage of SATB2+ cells (N) in total cells (T). e, Both deeper cortical layers and upper cortical layers markers were increased in PCCOs compared to COs. TBR1 and BCL11B represent deeper cortical layers, and CUX1 and SATB2 label the upper cortical layers. COs and PCCOs from two independent hiPSC lines were harvested at div74 for RNA extraction followed qPCR. GAPDH used as reference. n = 12 includes 3 independent biological replicates (including COs and PCCOs from individual hPSC lines, replicates from different lines shown in different colors) and 4 technical replicates for each of the biological replicate.
Extended Data Fig. 7 ∣. PCCO show increased neuron-glial interaction.
a, PCCOs and COs were labeled with TMT4 isobaric tags then subjected to LC-MS, to identify differential protein abundance based upon differential peptides analysis. GFAP-DCX-TBR1-STMN2, and Laminin-complex interaction matrixes were highlighted in PCCOs compared to COs, based upon go-profile and string analysis to highlight the interaction modules. y-axis −log10 p-value. b, GO-Term analysis indicated enriched expression of Basement membrane and Astrocytes-Neuron interaction in the TMT4-LC-MS experiment. x-axis: p-value x10−3.
Extended Data Fig. 8 ∣. PCCOs show robust SARS-CoV-2 infection compared to COs.
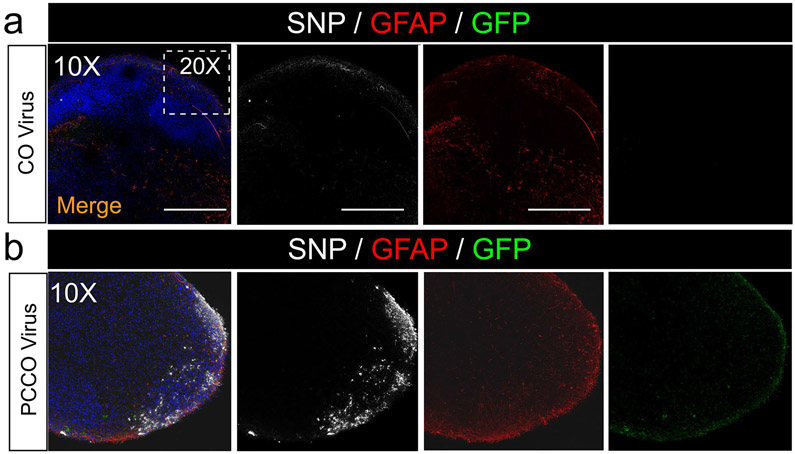
a-b, SNP and GFAP staining shows few SNP+ cells in COs (a) and robust SNP+ cells in PCCOs (b) 72 h after SARS-CoV-2 virus exposure. Bar: 400 μm. DAPI: blue, GFP: PLCs, GFAP: astrocytes, and SNP: SARS-CoV-2-NP. The dashed white boxes show the 20x region shown in Fig. 3b-e. Bar: 400 μm. In a-b, n = 9 includes three biological replicates (COs generated from H1, iPSC-Line2, iPSC-Line3) and three technical replicates (three COs for each of the biological replicates). Both COs and PCCOs shown were generated from H1 cells and GFP-PLCs were derived from H9 cells.
Extended Data Fig. 9 ∣. PCCOs show robust SARS-CoV-2 infection across different hPSC lines and batches.
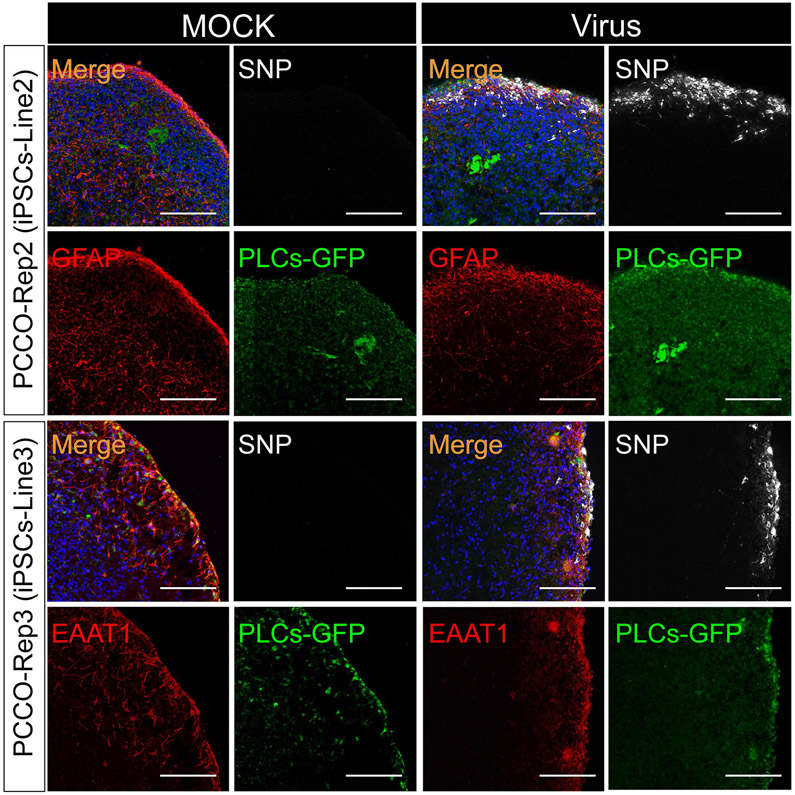
SNP and GFAP/EAAT1 staining shows robust SNP+ cells in PCCOs derived from different hiPSC lines (iPSC-Line2 and iPSC-Line3) 72 h after SARS-CoV-2 virus exposure. Bar: 400 μm. DAPI: blue, GFP: PLCs, GFAP/EAAT1: astrocytes, and SNP: SARS-CoV-2-NP. In this figure, PCCOs are derived from different iPSC lines accordingly (see detailed information in Extended Data Fig. 3), and GFP-PLCs were generated from H9 cells. n = 9 represents three biological replicates and three technical replicates.
Extended Data Fig. 10 ∣. Both astrocytes and PLCs show evidence of SARS-CoV-2 infection in PCCO.
a, SNP and GFAP staining shows infection of both PLCs and astrocytes within PCCOs derived from different hiPSC lines (iPSC-Line2 and iPSC-Line3) 72 h after SARS-CoV-2 virus exposure. GFAP in red, SNP in gray, yellow arrows: GFAP+/SNP+ cells, white arrows: GFP+/SNP+ cells, bar=400 μm, DAPI in blue. b, Quantification of SNP+/GFAP+ and SNP+/GFP+ cells shown in a. iPSC-Line2 and iPSC-Line3 are shown respectively. n = 12 includes 3 independent biological replicates from different COs/PCCOs and 4 different image regions from at least 3 different section regions in b. Two tailed t-test was used to determine the significance followed by a Sidak multiple-comparison test correction. **** p < 0.0001, p = 0.000067 for PCCO-Rep2 (iPSC-Line2) and p = 0.000097 for PCCO-Rep3 (iPSC-Line3). c, SNP and EAAT1 staining shows infection of both PLCs and astrocytes within PCCOs derived from different hiPSC lines (iPSC-Line2 and iPSC-Line3) 72 h after SARS-CoV-2 virus exposure, EAAT1 in red, SNP in gray, yellow arrows: EAAT1+/SNP+ cells, white arrows: GFP+/SNP+ cells, bar=400 μm, DAPI in blue. d, Quantification of SNP+/EAAT1+ and SNP+/GFP+ cells shown in c. iPSC-Line2 and iPSC-Line3 n = 12 includes 3 independent biological replicates from different COs/PCCOs and 4 different image regions from at least 3 different section regions in b. Two tailed t-test was used to determine the significance followed by a Sidak multiple-comparison test correction. **** p < 0.0001, p = 0.000047 for PCCO-Rep2 (iPSC-Line2) and p = 0.00027 for PCCO-Rep3 (iPSC-Line3). In this figure, PCCOs are derived from different iPSC lines accordingly (see detailed information in Extended Data Fig. 3), and GFP-PLCs are generated from H9 cells.
Supplementary Material
Acknowledgements
We thank R. Ellis, J. Esko, D. Chen and S. Shah for feedback and F. Gage and T. Rogers for the pLV-EGFP-puro and pcDNA3.1-hACE2 plasmids. We thank the UCSD Institute for Genomic Medicine (IGM) for sequencing support and the UCSD Proteomic Core for mass spectrometry support. The following reagent was deposited by the Centers for Disease Control and Prevention and obtained through the BEI Resources Repository, National Institute of Allergy and Infectious Disease, National Institutes of Health (NIH): SARS-Related Coronavirus 2, Isolate USA-WA1/2020, no. 52281. The work was supported by the Rady Children’s Hospital Neuroscience Endowment and grant no. R01NS106387 to J.G.G., a Career Award for Medical Scientists from the Burroughs Wellcome Fund and grant no. K08Al130381 to A.F.C., a Brain & Behavior Research Foundation NARSAD Young Investigator Grant to L.W., NIH NS103844 to E.V.S. and S.P.P., NIH Biotechnology Training Program grant T32GM008349 and National Science Foundation Graduate Research Fellowship Program grant no. 1747503 to B.D.G. and UCSD Neuroscience Microscopy Core Facility grant P30NS047101 and UCSD IGM Core Facility grant 1S10OD026929.
Footnotes
Online content
Any methods, additional references, Nature Research reporting summaries, source data, extended data, supplementary information, acknowledgements, peer review information; details of author contributions and competing interests; and statements of data and code availability are available at https://doi.org/10.1038/s41591-021-01443-1.
Code availability
CellRanger v.4.0 (10x Genomics) (https://support.10xgenomics.com) was used for the scRNA-seq FASTQ file alignment and reference assembly according to the instructions. Seurat v.3.1.5 (https://satijalab.org) in RStudio v.3.5.3 (https://www.rstudio.com) was used for the scRNA-seq analysis with the FindIntegrationAnchors, IntegrateData, Principal Component Analysis, PCEIbowPlot, runHeatmap, FindNeighbors and FindClusters functions according to the standard pipeline provided online. Differentially expressed genes were called with the FindMarkers function in Seurat v.3.1.5 and DAVID GO (v.6.8) term visualization software (https://david.ncifcrf.gov/). g:GOSt (v.3.13; https://biit.cs.ut.ee/gprofiler/gost) and STRING (v.11.0; https://string-db.org/) were used to analyze the mass spectrometry data based on the standard instruction.
Competing interests
The authors declare no competing interests.
Extended data is available for this paper at https://doi.org/10.1038/s41591-021-01443-1.
Supplementary information The online version contains supplementary material available at https://doi.org/10.1038/s41591-021-01443-1.
Data availability
The scRNA-seq data reported in this paper have been deposited with the Sequence Read Archive under accession no. PRJNA668200. The raw mass spectrometry data have been included as Supplementary Dataset 2. Further information and requests for resources and reagents should be directed to and will be fulfilled by the lead contact, J. Gleeson (jogleeson@health.ucsd.edu). Source data are provided with this paper.
References
- 1.Solomon T Neurological infection with SARS-CoV-2—the story so far. Nat. Rev. Neurol 17, 65–66 (2021). [DOI] [PMC free article] [PubMed] [Google Scholar]
- 2.Li H et al. SARS-CoV-2 and viral sepsis: observations and hypotheses. Lancet 395, 1517–1520 (2020). [DOI] [PMC free article] [PubMed] [Google Scholar]
- 3.Sarikaya B More on neurologic features in severe SARS-CoV-2 infection. N. Engl. J. Med 382, e110 (2020). [DOI] [PubMed] [Google Scholar]
- 4.Wu Y et al. Nervous system involvement after infection with COVID-19 and other coronaviruses. Brain Behav. Immun 87, 18–22 (2020). [DOI] [PMC free article] [PubMed] [Google Scholar]
- 5.Helms J et al. Neurologic features in severe SARS-CoV-2 infection. N. Engl. J. Med 382, 2268–2270 (2020). [DOI] [PMC free article] [PubMed] [Google Scholar]
- 6.Guilmot A et al. Immune-mediated neurological syndromes in SARS-CoV- 2-infected patients. J. Neurol 268, 751–757 (2021). [DOI] [PMC free article] [PubMed] [Google Scholar]
- 7.Perrin P et al. Cytokine release syndrome-associated encephalopathy in patients with COVID-19. Eur. J. Neurol 28, 248–258 (2021). [DOI] [PMC free article] [PubMed] [Google Scholar]
- 8.Ye M, Ren Y & Lv T Encephalitis as a clinical manifestation of COVID-19. Brain Behav. Immun 88, 945–946 (2020). [DOI] [PMC free article] [PubMed] [Google Scholar]
- 9.Wan Y, Shang J, Graham R, Baric RS & Li F Receptor recognition by the novel coronavirus from Wuhan: an analysis based on decade-long structural studies of SARS coronavirus. J. Virol 94, e00127–20 (2020). [DOI] [PMC free article] [PubMed] [Google Scholar]
- 10.Walls AC et al. Structure, function, and antigenicity of the SARS-CoV-2 spike glycoprotein. Cell 181, 281–292.e6 (2020). [DOI] [PMC free article] [PubMed] [Google Scholar]
- 11.He L et al. Pericyte-specific vascular expression of SARS-CoV-2 receptor ACE2—implications for microvascular inflammation and hypercoagulopathy in COVID-19. Preprint at bioRxiv 10.1101/2020.05.11.088500 (2020). [DOI] [Google Scholar]
- 12.Zlokovic BV Neurovascular pathways to neurodegeneration in Alzheimer’s disease and other disorders. Nat. Rev. Neurosci 12, 723–738 (2011). [DOI] [PMC free article] [PubMed] [Google Scholar]
- 13.Brann DH et al. Non-neuronal expression of SARS-CoV-2 entry genes in the olfactory system suggests mechanisms underlying COVID-19-associated anosmia. Sci. Adv 6, eabc5801 (2020). [DOI] [PMC free article] [PubMed] [Google Scholar]
- 14.Khaddaj-Mallat R et al. SARS-CoV-2 spike protein induces brain pericyte immunoreactivity in absence of productive viral infection. Preprint at bioRxiv 10.1101/2021.04.30.442194 (2021). [DOI] [Google Scholar]
- 15.Kantonen J et al. Neuropathologic features of four autopsied COVID-19 patients. Brain Pathol. 30, 1012–1016 (2020). [DOI] [PMC free article] [PubMed] [Google Scholar]
- 16.Sweeney MD, Ayyadurai S & Zlokovic BV Pericytes of the neurovascular unit: key functions and signaling pathways. Nat. Neurosci 19, 771–783 (2016). [DOI] [PMC free article] [PubMed] [Google Scholar]
- 17.Farahani RM, Rezaei-Lotfi S, Simonian M, Xaymardan M & Hunter N Neural microvascular pericytes contribute to human adult neurogenesis. J. Comp. Neurol 527, 780–796 (2019). [DOI] [PubMed] [Google Scholar]
- 18.Jia C et al. Vitronectin from brain pericytes promotes adult forebrain neurogenesis by stimulating CNTF. Exp. Neurol 312, 20–32 (2019). [DOI] [PMC free article] [PubMed] [Google Scholar]
- 19.Crouch EE, Liu C, Silva-Vargas V & Doetsch F Regional and stage-specific effects of prospectively purified vascular cells on the adult V-SVZ neural stem cell lineage. J. Neurosci 35, 4528–4539 (2015). [DOI] [PMC free article] [PubMed] [Google Scholar]
- 20.Stebbins MJ et al. Human pluripotent stem cell-derived brain pericyte-like cells induce blood-brain barrier properties. Sci. Adv 5, eaau7375 (2019). [DOI] [PMC free article] [PubMed] [Google Scholar]
- 21.Ghobrial M et al. The human brain vasculature shows a distinct expression pattern of SARS-CoV-2 entry factors. Preprint at bioRxiv 10.1101/2020.10.10.334664 (2020). [DOI] [Google Scholar]
- 22.Lamers MM et al. SARS-CoV-2 productively infects human gut enterocytes. Science 369, 50–54 (2020). [DOI] [PMC free article] [PubMed] [Google Scholar]
- 23.Monteil V et al. Inhibition of SARS-CoV-2 infections in engineered human tissues using clinical-grade soluble human ACE2. Cell 181, 905–913.e7 (2020). [DOI] [PMC free article] [PubMed] [Google Scholar]
- 24.Vogt N Assembloids. Nat. Methods 18, 27 (2021). [DOI] [PubMed] [Google Scholar]
- 25.Ozerdem U, Grako KA, Dahlin-Huppe K, Monosov E & Stallcup WB NG2 proteoglycan is expressed exclusively by mural cells during vascular morphogenesis. Dev. Dyn 222, 218–227 (2001). [DOI] [PubMed] [Google Scholar]
- 26.Armulik A et al. Pericytes regulate the blood-brain barrier. Nature 468, 557–561 (2010). [DOI] [PubMed] [Google Scholar]
- 27.Barbar L et al. CD49f is a novel marker of functional and reactive human iPSC-derived astrocytes. Neuron 107, 436–453.e12 (2020). [DOI] [PMC free article] [PubMed] [Google Scholar]
- 28.Sloan SA et al. Human astrocyte maturation captured in 3D cerebral cortical spheroids derived from pluripotent stem cells. Neuron 95, 779–790.e6 (2017). [DOI] [PMC free article] [PubMed] [Google Scholar]
- 29.Chavkin NW & Hirschi KK Single cell analysis in vascular biology. Front. Cardiovasc. Med 7, 42 (2020). [DOI] [PMC free article] [PubMed] [Google Scholar]
- 30.Yang AC et al. Dysregulation of brain and choroid plexus cell types in severe COVID-19. Nature 10.1038/s41586-021-03710-0 (2021). [DOI] [PMC free article] [PubMed] [Google Scholar]
- 31.Vanlandewijck M et al. A molecular atlas of cell types and zonation in the brain vasculature. Nature 554, 475–480 (2018). [DOI] [PubMed] [Google Scholar]
- 32.Song E et al. Neuroinvasion of SARS-CoV-2 in human and mouse brain. J. Exp. Med 218, e20202135 (2021). [DOI] [PMC free article] [PubMed] [Google Scholar]
- 33.Jacob F et al. Human pluripotent stem cell-derived neural cells and brain organoids reveal SARS-CoV-2 Neurotropism predominates in choroid plexus epithelium. Cell Stem Cell 27, 937–950.e9 (2020). [DOI] [PMC free article] [PubMed] [Google Scholar]
- 34.Zhang BZ et al. SARS-CoV-2 infects human neural progenitor cells and brain organoids. Cell Res. 30, 928–931 (2020). [DOI] [PMC free article] [PubMed] [Google Scholar]
- 35.Liddelow SA et al. Neurotoxic reactive astrocytes are induced by activated microglia. Nature 541, 481–487 (2017). [DOI] [PMC free article] [PubMed] [Google Scholar]
- 36.Müller U et al. Functional role of type I and type II interferons in antiviral defense. Science 264, 1918–1921 (1994). [DOI] [PubMed] [Google Scholar]
- 37.Perng Y-C & Lenschow DJ ISG15 in antiviral immunity and beyond. Nat. Rev. Microbiol 16, 423–439 (2018). [DOI] [PMC free article] [PubMed] [Google Scholar]
- 38.Ramani A et al. SARS-CoV-2 targets neurons of 3D human brain organoids. EMBO J. 39, e106230 (2020). [DOI] [PMC free article] [PubMed] [Google Scholar]
- 39.Pellegrini L et al. SARS-CoV-2 infects the brain choroid plexus and disrupts the blood-CSF barrier in human brain organoids. Cell Stem Cell 27, 951–961.e5 (2020). [DOI] [PMC free article] [PubMed] [Google Scholar]
- 40.Hall CN et al. Capillary pericytes regulate cerebral blood flow in health and disease. Nature 508, 55–60 (2014). [DOI] [PMC free article] [PubMed] [Google Scholar]
- 41.Wang L et al. Loss of NARS1 impairs progenitor proliferation in cortical brain organoids and leads to microcephaly. Nat. Commun 11, 4038 (2020). [DOI] [PMC free article] [PubMed] [Google Scholar]
- 42.Kadoshima T et al. Self-organization of axial polarity, inside-out layer pattern, and species-specific progenitor dynamics in human ES cell-derived neocortex. Proc. Natl Acad. Sci. USA 110, 20284–20289 (2013). [DOI] [PMC free article] [PubMed] [Google Scholar]
- 43.Susaki EA et al. Advanced CUBIC protocols for whole-brain and whole-body clearing and imaging. Nat. Protoc 10, 1709–1727 (2015). [DOI] [PubMed] [Google Scholar]
- 44.Butler A, Hoffman P, Smibert P, Papalexi E & Satija R Integrating single-cell transcriptomic data across different conditions, technologies, and species. Nat. Biotechnol 36, 411–420 (2018). [DOI] [PMC free article] [PubMed] [Google Scholar]
Associated Data
This section collects any data citations, data availability statements, or supplementary materials included in this article.
Supplementary Materials
Data Availability Statement
The scRNA-seq data reported in this paper have been deposited with the Sequence Read Archive under accession no. PRJNA668200. The raw mass spectrometry data have been included as Supplementary Dataset 2. Further information and requests for resources and reagents should be directed to and will be fulfilled by the lead contact, J. Gleeson (jogleeson@health.ucsd.edu). Source data are provided with this paper.


