

Abstract
Articular cartilage of the knee can be evaluated with high accuracy by magnetic resonance imaging (MRI) in preoperative patients with knee pain, but image quality and reporting are variable. This article discusses the normal MRI appearance of articular cartilage as well as the common MRI abnormalities of knee cartilage that may be considered for operative treatment. This article focuses on a practical approach to preoperative MRI of knee articular cartilage using routine MRI techniques. Current and future directions of knee MRI related to articular cartilage are also discussed.
Keywords: cartilage, knee, MRI
We have come a long way. From the time of Hippocrates until approximately 250 years ago, all forms of chronic arthritis were considered manifestations of gout.1
By the end of the 19th century, major developments related to diagnosis of cartilage derangements included the discovery of X-rays and the emergence of the term “osteoarthritis.”2
In the 20th century (in 1984), the first report on magnetic resonance imaging (MRI) of knee articular cartilage was published.3
By the year 2000, there were 38 publications per year with the keywords “articular cartilage” and “knee MRI.”4
In 2020, a PubMed search for publications with keywords “articular cartilage” and “knee MRI” yields a deluge of approximately 3,300 articles (approximately 200 publications annually) on MRI of articular cartilage in the knee.4
Given that “data overload” is a potential source of job stress and diagnostic error,5 the overall goal of this article is to distill current information on MRI of knee articular cartilage into pragmatic “high yield” essentials for clinical practice. We discuss and illustrate a practical approach to preoperative MRI of common disorders involving articular cartilage in the knee, including [I] the rationale for typical MRI techniques in clinical practice, [II] normal MRI anatomy of cartilage, [III] MRI findings of cartilage derangements, and [IV] the future directions in the exciting evolution of knee MRI.
MRI Techniques in Clinical Practice
The Set-up
The knee is typically scanned with the patient in a supine position. The patient should be scanned in a comfortable position to avoid motion artifact. Excellent images may be obtained with both 1.5- and 3.0-Tesla (T) MRI units. In a recent systematic review with meta-analysis of 16 studies,6 however, 3-T MRI had statistically greater diagnostic accuracy than 1.5-T MRI for articular cartilage lesions.
Prior to placing the patient in the knee coil on the MRI table, we ask the patient to point out any focal or maximal area of symptoms so that a skin marker can be placed. Then, the knee is placed in a “radiofrequency coil” on the MRI table. A high-quality radiofrequency coil is essential for obtaining reliable sharp images. Ongoing improvements in MRI coil design and newer pulse sequences have resulted in higher quality images that can be obtained more rapidly than in the past (as detailed in “Future Directions,” below).
At the MRI scanner, an MRI technologist scans the patient according to a predefined protocol. Images in the axial, coronal, and sagittal planes are performed to show knee anatomy consistently, despite differences in patient body habitus and positioning. The axial images of the knee typically extend from the distal femoral shaft to the proximal tibial shaft. The coronal and sagittal images of the knee are prescribed from the axial images and are oriented parallel and perpendicular to a line through the epicondyles of the distal femur. The field of view generally ranges between 14 and 18 cm and may be modified depending on the scan indication and patient body habitus.
Workhorse Pulse Sequences
A variety of pulse sequences can be used to evaluate the knee depending on the available software and the field strength of the particular MRI system. In choosing an MRI protocol, there are inherent tradeoffs that must be considered between the overall scan time, the spatial resolution (voxel size), and the overall image quality in terms of the signal-to-noise ratio (SNR).
Our preferred clinical knee MRI exam technique includes two sets or “series” of images, each of which are performed in the axial, coronal, and sagittal planes. In particular, we rely on (1) fast spin-echo (FSE) proton density (PD) and (2) fat-suppressed FSE T2-weighted two-dimensional (2D) images obtained in the exact same locations to facilitate analysis of the anatomy and any pathologic changes in the knee, including chondral derangements.
The importance of PD (rather than T1) imaging in the evaluation of internal derangement first became widely appreciated with the seminal work of Potter et al in JBJS 1998.7 In addition to recognizing the importance of spatial resolution, this work pointed out that internal derangements are best diagnosed by MRI when optimizing contrast resolution (e.g., the image contrast between high signal intensity joint fluid, intermediate signal articular cartilage, and the low signal subchondral bone plate).
T2-weighted images performed with fat suppression complement the PD images obtained at the same slice position. When the signal from fat is suppressed on images, the “dynamic range” of the image changes, such that fluid and edema associated with abnormalities become particularly conspicuous.
There are two common techniques for suppressing the signal from fat. The most common technique (frequency-selective fat suppression) is selected for 1.5- and 3-Tesla scanners when knees do not have artifact caused by metal. The frequency-selective fat suppression technique avoids chemical shift artifact and is generally preferred when evaluating cartilage. However, at lower field strengths or in knees with metal artifact, the fatty signal in tissues (e.g., cancellous bone) often is suppressed with an inversion recovery (e.g., STIR) technique.
In most postoperative patients, especially if there is fixation with plastic materials such as PEEK or bioabsorbable implants, we routinely scan the knee as well as the other joints with the combination of three FSE PD series (TR, 3,000; TE, 34) and 3 FSE fat-suppressed T2-weighted series (TR, 4,000; TE, 50). If there is titanium fixation, we typically will add or substitute a STIR sequence. If there is stainless steel hardware from a prior ORIF, or if there is a unicompartmental arthroplasty with cobalt chromium resulting in prominent artifact, then we will do STIR in all three planes and we will modify all three of the FSE PD sequences using a metal artifact reduction sequence (MARS technique). This metal suppression technique typically involves increasing the receiver bandwidth, increasing the echo train length (turbo factor), and increasing the frequency matrix. MRI manufacturers also sell propriety versions of software that minimize metallic artifact (e.g., MAVRIC, SEMAC).8,9
Each series of PD and fat-suppressed T2 images takes approximately 3 to 4 minutes to acquire. If there is any patient motion during that time, motion artifact occurs and can be a limiting factor. Within the past 10 years, MRI techniques to reduce motion artifacts have become widely used. These motion-reduction pulse sequences have various acronyms, depending on the MRI manufacturer (e.g., PRO-PELLER, BLADE).10 Disadvantages of these techniques can be longer scan times, image noise, and image blurring. Technical improvements continue to occur including with artifact reduction and improved scan times (e.g., with parallel imaging, artificial intelligence or AI).11,12
T1-Weighted Images
T1-weighted images are used routinely in some practices and can be helpful in characterizing neoplasms because of the characteristic appearance of adipose tissue and met-hemoglobin (subacute blood). While T1 images do show some abnormalities (such as fatty infiltration in muscle or some abnormalities in the bone marrow), these abnormalities are shown with comparable accuracy by using paired PD and fat-suppressed T2 imaging. Unfortunately, T1 images are particularly low yield in the evaluation of internal derangements. In fact, compared with PD and fat-suppressed T2 images, routinely acquired T1 images are poor at showing typical internal derangements, including ligament tears, meniscus tears, and articular cartilage derangements (►Fig. 1).
Fig. 1.

A 19-year-old patient with acute tears of the ACL and MCL with normal articular cartilage. T1-weighted (A), proton density (B), and fat-suppressed T2-weighted (C) coronal images reveal tears of the ACL (black arrows) and MCL (white arrows). The articular cartilage is well seen on both the proton density (B), and the fat-suppressed T2-weighted (C) images but is not well seen on the T1-weighted (A) image. The normal thin low signal intensity surface layer of articular cartilage including the lamina splendens can be seen on the proton density and fat-suppressed T2-weighted images.
With T1 images, the signal intensity of articular cartilage is typically very similar to synovial fluid, and therefore cartilage lesions are camouflaged. With T2 images, on the other hand, there is a contrast between the cartilage and joint fluid, and therefore morphologic derangements in articular cartilage generally are seen best. To maximize the diagnostic accuracy of images, it is also essential tovary the greyscale “window and level” used for image display on computer workstations to optimize the differentiation between joint fluid and any structure being evaluated in the knee.
3D MRI Techniques
Three-dimensional acquisitions that are isotropic (i.e., same resolution in all directions) can be reformatted in any plane. Although 2D images are generally faster and still the standard in the clinical environment, recent studies have evaluated 3D techniques that acquire images with thinner slices (thus minimizing partial-volume artifacts), higher SNRs, and possibly improved image contrast resolution.13 Thus far, however, systematic review and meta-analysis of 3D MRI studies show no improvement over 2D techniques, with pooled sensitivity and specificity of 75% and 93%, respectively, for knee cartilage defects.14
Normal MRI Anatomy of Articular Cartilage
Articular cartilage is devoid of blood vessels, lymphatics, and nerves. Water from within the cartilage is extruded into the joint space in response to compressive loads and reabsorbed along with nutrients from the synovial fluid. Articular cartilage is characterized by high water content due to a high composition of proteoglycans that are highly hydrophilic and imbibe water. Chondrocytes within the articular cartilage produce the proteoglycans and also produce collagen that is arranged in a highly ordered matrix. The matrix is arranged in sheets of collagenous tissue in the deep (radial) layer that are longitudinally oriented to respond to compressive load and help cushion the underlying bone. These sheets of tissue curve in the intermediate (transitional) layer toward a thin superficial (tangential) layer that has less friction than a sheet of ice. The cartilage is anchored to the subchondral bone plate in the calcified portion of the deep zone. The layered zonal anatomy of articular cartilage explains the MRI appearance of the normal tissue on high resolution FSE images.
Chemical shift artifact is important to consider when evaluating MR image quality. This phenomenon can result in spurious changes in articular cartilage thickness and is eliminated by incorporating fat suppression and high-resolution technique. When the very thin black line of the tangential superficial layer is visualized, the surface is intact and there is adequately high resolution in the image.
The parallel structural arrangement of the sheets of tissue in the deep and superficial layers gives rise to magic angle effects within normal cartilage that should not be mistaken for pathology. The structure of the matrix of the sheets of cartilage may also result in a normal variability of the signal intensity of the articular cartilage in the knee. For example, the cartilage in the periphery of the tibial plateau covered by the menisci is normally of higher signal intensity, when compared with the lower signal intensity of the articular cartilage in the central aspect of the tibial plateau that is not covered by the menisci, due to the arrangement of the matrix of the sheets of cartilage in the tibial plateau.
MRI Findings of Cartilage Derangements
Degeneration and loss of the articular cartilage can be graded with several different surgical and pathologic classification schemes based on visual inspection of the cartilage as well as probing for abnormal cartilage softness. There are also many classification schemes based on the MRI appearance that have been correlated with the surgical and pathologic classification schemes. Although we recognize the importance of these classification schemes for research, cartilage scoring systems remain variable in the preoperative and postoperative settings (e.g., Outerbridge, International Cartilage Repair Society, Cartilage Lesion Score, Whole-Organ Magnetic Resonance Imaging Score, Boston-Leeds Osteoarthritis Knee Score, MRI Osteoarthritis Knee Score, Knee Osteoarthritis Scoring System, Magnetic Resonance Observation of Cartilage Repair Tissue, Area Measurement And DEpth & Underlying Structures.15
Given that different surgeons have different preferences and there is variable reporting of cartilage lesions in the medical literature,16 our approach is to consistently apply a compartment-by-compartment approach to each chondral surface, describing three essential features: cartilage defect size, cartilage lesion depth, and subchondral bone status. In other words, we believe it is essential to: (1) report the location and size of all well-marginated acute-appearing chondral defects, (2) report the location and the degree of chronic-appearing cartilage loss/thinning, and (3) evaluate the subchondral bone for abnormalities. Of note, we describe low signal intensity chondral degeneration and low signal intensity chondral repair tissue that has lost the normal stratified MRI appearance.
Chondrocalcinosis has a characteristic appearance that is identified by recognizing multiple small foci of low signal intensity that is due to multiple small foci of calcification with the articular cartilage (►Fig. 2).
Fig. 2.

A 72-year-old man with chondrocalcinosis as well as a horizontal tear of the posterior horn of the lateral meniscus. A fat-suppressed T2-weighted sagittal image reveals multiple foci of low signal intensity calcification (white arrows) due to chondrocalcinosis within the articular cartilage of the lateral tibial plateau and lateral femoral condyle. The normal thin low signal intensity surface layer of articular cartilage including the lamina splendens can be seen in the posterior inferior aspect of the lateral femoral condyle (black arrows).
Early chondral degeneration appears on MRI as low signal intensity or high signal intensity chondral tissue that has lost the normal stratified and layered appearance. The low signal intensity chondral degeneration is typically softer than normal hyaline cartilage likely due to lower proteogycan concentration and lower water content. This low signal intensity chondral degeneration and softening is commonly seen in the central aspect of the trochlea (►Fig. 3).
Fig. 3.

A 55-year-old woman with a subacute ACL tear and low signal intensity chondral degeneration in the central trochlea. A fat-suppressed T2-weighted axial image reveals tearing of the ACL (black arrows) as well as a low signal intensity region of chondral degeneration in the central trochlea (white arrows). There was chondral softening in the central trochlea which was confirmed with arthroscopic probing.
Cracks or fissures are commonly seen in the surface of articular cartilage and may be well seen with MRI as well as arthroscopy. Small chondral fissures may be difficult to visualize without probing during routine arthroscopy.17 Deep chondral fissures that do not extend to the surface may result in basilar delamination that can be detected with MRI and cannot be seen with arthroscopy. Small amounts of high signal intensity fluid typically fill chondral fissures. A chondral fissure may occasionally appear as a thin linear focus of low signal intensity (►Fig. 4).
Fig. 4.

A 28-year-old woman with anterior knee pain. A fat-suppressed T2-weighted axial image reveals a linear focus of low signal intensity in the central trochlea (arrow) with a small focus of underlying low signal intensity sclerosis and mild surrounding marrow edema. A chondral fissure was found in this location at arthroscopy 2 months later.
Chondral fissures that extend deep can propagate perpendicular to the bone. These lesions can be associated with reactive bone marrow edema that calls attention to the lesion and aids in detection with MRI (►Fig. 5). Chondral fissures that do not extend deeply typically do not have underlying bone marrow edema on MRI (►Fig. 6).
Fig. 5.

A 34-year-old woman with lateral knee pain. Proton density (A) and fat-suppressed T2-weighted (B) coronal images reveal a deep full thickness high signal intensity chondral fissure in the medial aspect of the lateral tibial plateau (arrows) with underlying marrow edema.
Fig. 6.

A 35-year-old woman with anterior knee pain. A fat-suppressed T2-weighted axial image reveals a deep partial thickness high signal intensity chondral fissure in the medial patellar facet (arrow) without underlying marrow edema.
Chondral fissures may result in delamination of the cartilage and chondral flap lesions if there is extension of the fissure parallel to the surface of the bone (►Figs. 7–12).
Fig. 7.

A 45-year-old woman with anterior knee pain. A fat-suppressed T2-weighted axial image reveals a deep high signal intensity chondral fissure delineating a nondisplaced chondral flap in the central to medial aspect of the trochlea.
Fig. 12.

A 62-year-old woman with chronic anterior knee pain and new lateral knee pain. A fat-suppressed T2-weighted sagittal image reveals advanced cartilage loss with mild patchy underlying bone marrow edema in the lateral patellar facet and superior lateral aspect of the trochlea (white arrows) There is a deep chondral fissure delineating a flap in the inferior central aspect of the lateral femoral condyle (black arrows). There is also high-grade cartilage loss in the posterior superior aspect of the lateral femoral condyle (arrowheads).
Chondral defects may be due to acute trauma and are commonly seen in the knee joint. Chondral defects are recognized on MRI as fluid extending into and replacing the articular cartilage. In MRI reports, these lesions should be localized and measured, with an attempt made to describe the depth of the lesion. Chondral defects are sharply marginated and well shouldered, as opposed to chronic degenerative cartilage loss that has smoother, more ill-defined margins (►Figs. 13–15).
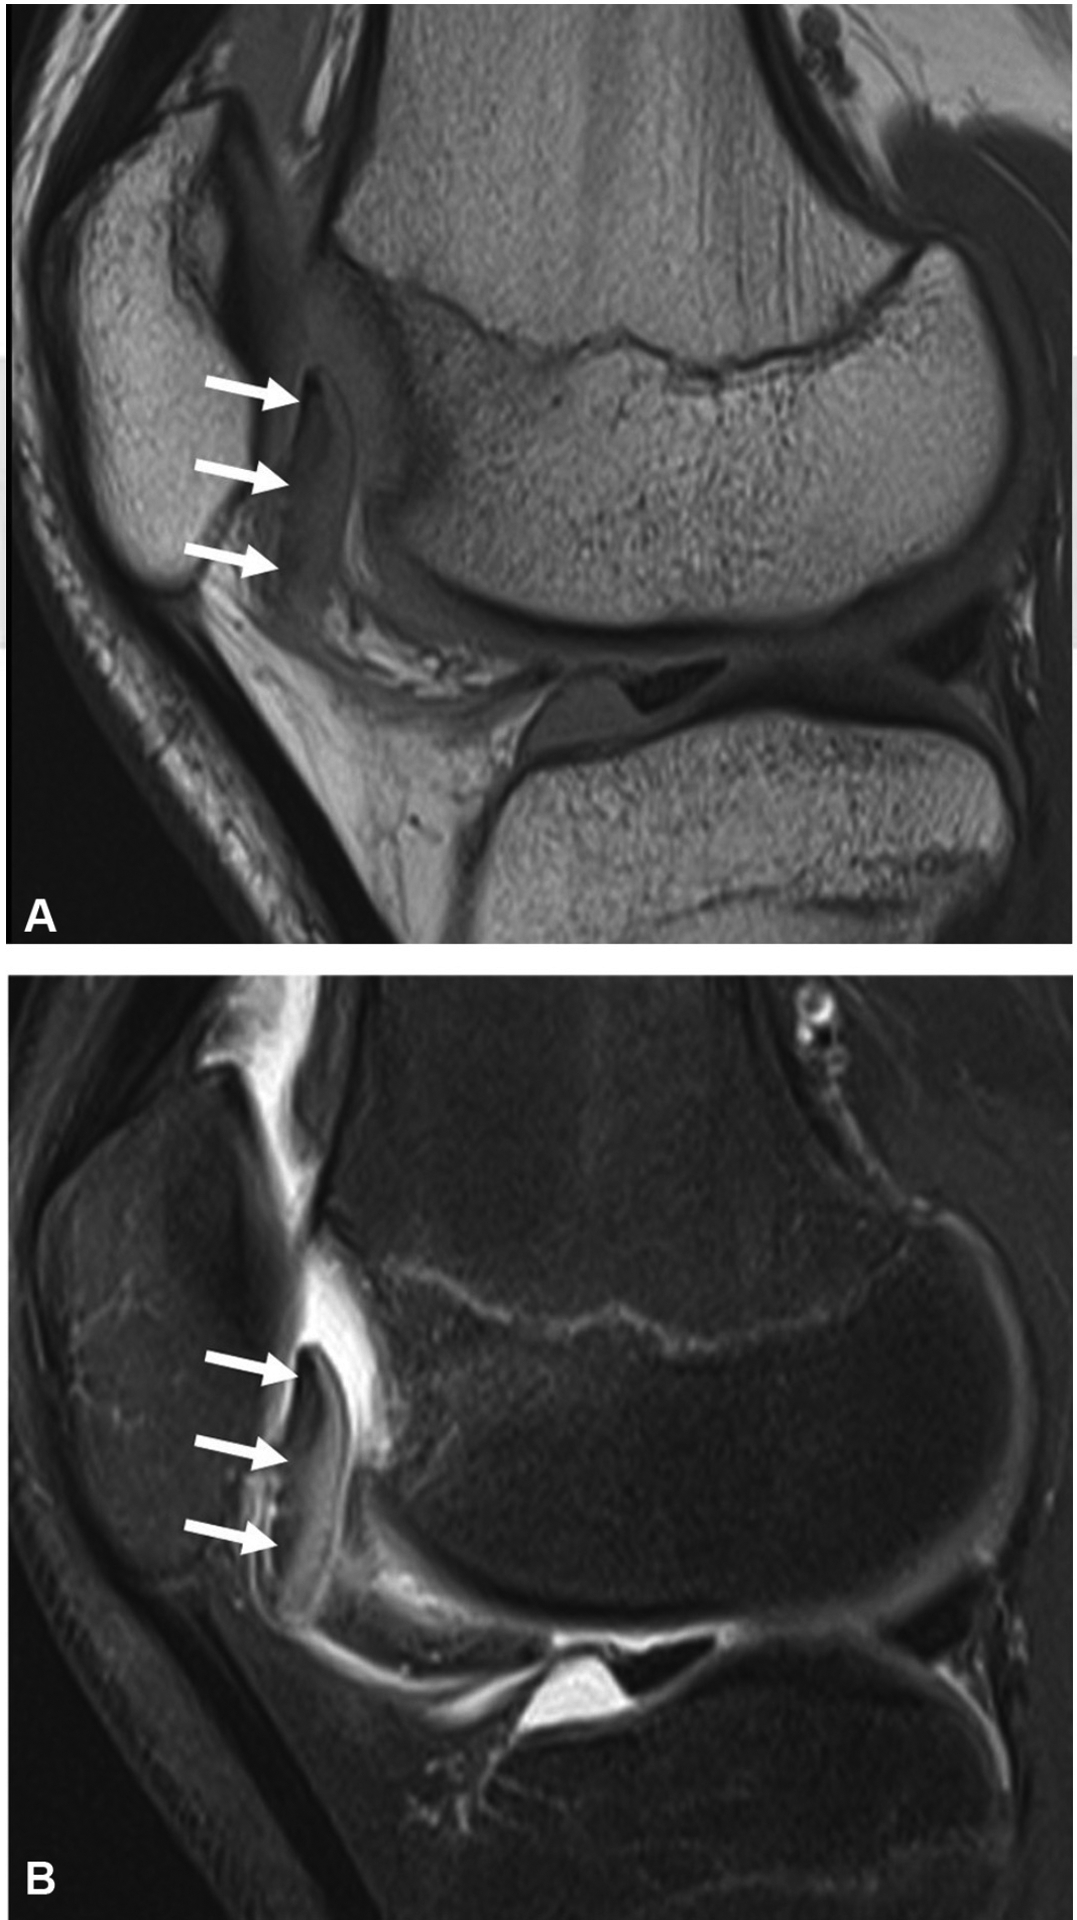
Fig. 13.

A 15-year-old girl with pain and swelling after an acute patellar dislocation. Proton density (A) and fat-suppressed T2-weighted (B) sagittal images reveal a chondral defect (white arrows) in the inferior anterolateral aspect of the lateral femoral condyle. There is an adjacent thin chondral loose body (black arrow) just proximal to the anterior margin of the lateral tibial plateau.
Fig. 15.

A 25-year-old man with lateral pain after a twisting injury while playing basketball. Fat-suppressed T2-weighted sagittal images (A, B) reveal a chondral defect (black arrows) in the posterior inferior aspect of the lateral femoral condyle. There is a superiorly displaced chondral loose body (white arrows) just posterior to the posterior superior aspect of the lateral femoral condyle.
Chondral defects are typically filled with small amounts of fluid but may occasionally be filled with gas or tissue. For example, tissue from Hoffa’s fat pad commonly fills chondral defects in the trochlea of the femur and may result in a less conspicuous appearance than a fluid-filled defect on the fat-suppressed images. Chondral defects are well seen on both the routine PD FSE (TR 3000/TE 30) and the routine fat-suppressed T2-weighted FSE (TR 4000/TE 50) images that we do in the axial, sagittal, and coronal planes to evaluate for internal derangement in all joints. We do not routinely use special “cartilage specific” sequences or MR arthrography for evaluating articular cartilage; most missed chondral defects on MRI are simply due to perceptual errors or poor image quality.
Diagnosis of a chondral defect with MRI should prompt a search for associated loose bodies. Acute loose bodies are differentiated from thickened synovium or other tissue by recognizing a thin black line along the surface of the loose body and by the geographic appearance of the loose body (►Fig. 16). Chondral defects may fill in with bone and repair tissue that contains a mixture of hyaline cartilage and fibrocartilage. The repair tissue is initially lower in signal intensity than normal cartilage and has different mechanical properties (e.g., softer) than normal hyaline cartilage due to lower proteogycan concentration and lower water content.
Fig. 16.

A 54-year-old man with new lateral knee pain and locking as well as chronic anterior knee pain. A fat-suppressed T2-weighted coronal image (A) reveals a chondral defect (arrows) in the posterior inferior aspect of the lateral femoral condyle. A fat-suppressed T2-weighted sagittal image (B) reveals a chondral defect (arrows) in the posterior inferior aspect of the lateral femoral condyle as well as high grade cartilage loss in the patellofemoral compartment (arrowheads). A fat-suppressed T2-weighted sagittal image (C) reveals a thin chondral loose body (arrows) just posterior to the posterior margin of the lateral tibial plateau as well as high grade cartilage loss in the patellofemoral compartment (arrowheads). There is also a deep chondral fissure (small arrows) delineating a small chondral flap in the inferior anterolateral aspect of the lateral femoral condyle. A fat-suppressed T2-weighted axial image (D) reveals a thin chondral loose body (arrows) just posterior to the posterior margin of the lateral tibial plateau.
Osteochondral lesions in the knee can be detected and well characterized with MRI without the need for special pulse sequences. Osteochondral lesions in the knee occur by far most commonly in the inferior lateral aspect of the medial femoral condyle (►Fig. 17) but may be found elsewhere, including in the trochlea (►Fig. 18).18 Unstable lesions are characterized by high signal intensity fluid at the base of the lesion (►Fig. 19).
Fig. 17.

A 14-year-old girl with medial knee pain and an unstable osteochondral lesion. A fat-suppressed T2-weighted coronal image reveals a nondisplaced osteochondral lesion (arrows) at the inferior-lateral aspect of the medial femoral condyle. A thin layer of high signal intensity fluid at the base of the lesion indicates instability that was proved with arthroscopic probing 1 month later.
Fig. 18.
A 15-year-old boy with anterior knee pain and locking. Proton density (A) and fat-suppressed T2-weighted (B) sagittal images reveal an inferiorly displaced osteochondral lesion of the trochlea. The osteochondral fragment is also flipped 180 degrees so that the articular cartilage is facing posteriorly rather than anteriorly.
Fig. 19.

A 16-year-old boy with medial knee pain and an unstable osteochondral lesion. A fat-suppressed T2-weighted coronal image (A) reveals a nondisplaced osteochondral lesion (arrows) at the inferior-lateral aspect of the medial femoral condyle. High signal intensity fluid at the base of the lesion indicates instability. A fat-suppressed T2-weighted coronal image (B) 3 weeks after the initial MRI reveals a fluid-filled defect (arrows) due to interval displacement of the unstable osteochondral lesion of the medial femoral condyle. A fat-suppressed T2-weighted axial image (C) 3 weeks after the initial MRI reveals the displaced osteochondral fragment (arrows) at the anterolateral margin of the superior aspect of the trochlea. The normal osteochondral layers of the displaced fragment are well seen on this image. MRI, magnetic resonance imaging.
New Frontiers: Rapid, Quantitative, Artificial Intelligence-Enhanced 3D MRI
Numerous “compositional” MRI techniques have been developed in the hopes of improving evaluation of early cartilage degeneration (before morphologic lesions occur), including T2 mapping, T1 rho, and dGEMRIC.19,20 These techniques have been used extensively in research settings, but have not been widely implemented into routine clinical MRI. New techniques continue to be developed with the goals of improved efficiency and widespread use. This section summarizes recent work related to T2 mapping and AI of articular cartilage.
T2 mapping has been explored as a sensitive biomarker for evaluating early chondral degeneration.21,22 Most MRI acquisition schemes for acquiring T2 relaxation time mapping measurements rely on multi-echo spin-echo MRI that requires long acquisition durations.23 This need for separate time-consuming sequences for anatomical and quantitative imaging of cartilage has precluded the use of quantitative MRI in a diagnostic clinical setting, despite promising results in studies evaluating osteoarthritis progression.
Recent advances in rapid MRI have enabled the use of a quantitative 3D double echo steady state (qDESS) sequence that simultaneously produces two separate contrasts suitable for morphological evaluation of cartilage as well as accurate T2 relaxation maps.24,25 The quantitative T2 measurements and morphological details depicted through qDESS have been utilized to differentiate between subjects with varying grades of osteoarthritis and in a diagnostic imaging setting.26,27 Clinically, the morphological qDESS images can depict regions of degeneration with similar conspicuity as routine clinical MRI, but the addition of T2 maps may depict regions of early chondral degeneration, even prior to morphological changes (►Fig. 20). qDESS also enables simultaneous bilateral imaging of both knees without a loss in diagnostic image quality and quantitative T2 accuracy.28 Overall, a 5-minute 3D qDESS sequence provides a bilateral, distortion-free, high-resolution, multicontrast, and quantitative acquisition and has the potential to increase the value of MRI for orthopaedic patients (►Fig. 21).
Fig. 20.

Sample images of a subject with a chondral fissure in the patella with subchondral cystic change (solid arrow) depicted with conventional MRI sequences (a) and the two types of image contrast generated with qDESS (b, c). The qDESS T2 map (d) depicts a region of hyperintense T2 values in the lateral femoral condyle (dashed arrow), which may be indicative of very early chondral degeneration. MRI, magnetic resonance imaging; qDESS, quantitative 3D double echo steady state.
Fig. 21.

qDESS can be used to scan both knees simultaneously. Sagittal images with two types of image contrast are labeled “qDESS + ” (first echo, with high signal-to-noise ratio) and “qDESS−” (second echo, with high T2 weighting). Images are acquired with 0.4-mm resolutionfiin-plane and 1.4-mm slice thickness in 5 minutes, allowing coronal and axial reformatted images, without additional time, loss in image quality, or loss in quantitative T2 parameter maps accuracy. qDESS, quantitative 3D double echo steady state.
Driven further by the need for accelerated MRI, AI has also been used to accelerate MRI acquisition. AI-based super-resolution provides an opportunity to acquire low-resolution MRI scans and retrospectively enhance the resolution of the scans.29,30 These super-resolution networks have been incorporated with qDESS and have been shown to be robust enough to generate minimally biased cartilage morphometry and T2 relaxation time measurements.31,32 Furthermore, similar advances in AI can couple quantitative MRI acquisitions to automatically segment articular cartilage with high-accuracy, which may enable the use of quantitative MRI in a direct clinical manner.33,34
Conclusion
MRI with routine PD and fat-suppressed T2-weighted images is useful for practical detection and characterization of chondral pathology that may benefit from surgical intervention. Knowledge of the MRI appearance of common abnormalities of the articular cartilage enables highly accurate noninvasive diagnosis, thereby enabling preoperative planning as well as helping with making informed decisions regarding nonoperative and operative treatments.
Fig. 8.

A 27-year-old man with anterior knee pain. Proton density (A) and fat-suppressed T2-weighted (B) axial images reveal a posteriorly displaced chondral flap in the midportion of the medial patellar facet.
Fig. 9.

A 22-year-old man with anterior knee pain. Axial (A) and sagittal (B) fat-suppressed T2-weighted images reveal an anteriorly displaced chondral flap (arrows) in the central aspect of the trochlea.
Fig. 10.

A 52-year-old man with medial knee pain. A fat-suppressed T2-weighted coronal image reveals a nondisplaced chondral flap (white arrows) with mild underlying bone marrow edema in the inferior lateral aspect of the medial femoral condyle. There is a small amount of high signal intensity “uid separating the thin low signal intensity deep calcified cartilage layer of the articular cartilage from the adjacent thin low signal intensity articular cortex. There is also a horizontal tear that extends to the free edge of the body segment of the medial meniscus seen on this image (black arrow).
Fig. 11.

A 18-year-old man with congenital insensitivity to pain that presented with locking and swelling of the left knee. A proton density sagittal image reveals a large displaced bucket handle tear of the lateral meniscus with a displaced bucket fragment posterior to the anterior horn (black arrows) as well as two large chondral flaps of the mid to posterior aspect of the lateral femoral condyle (white arrows). The thin low signal intensity deep calcified cartilage layer is well seen at the base of these large chondral flaps.
Fig. 14.

A 27-year-old man with lateral knee pain after a twisting injury. Proton density (A) and fat-suppressed T2-weighted (B) sagittal images reveal a chondral defect (arrows) in the inferior central aspect of the lateral femoral condyle.
Footnotes
Disclosures
A.C. has provided consulting services to SkopeMR, Inc., Subtle Medical, Chondrometrics GmbH, Image Analysis Group, Edge Analytics, and Culvert Engineering; and is a shareholder of Subtle Medical, LVIS Corporation, and Brain Key.
Conflict of Interest
A.C. reports personal fees from SkopeMR, Inc., Subtle Medical, Chondrometrics GmbH, Image Analysis Group, Edge Analytics, and Culvert Engineering, other from Subtle Medical, LVIS Corporation, and Brain Key, outside the submitted work.
References
- 1.Reginster JY. Introduction: historical and current perspectives on osteoarthritis. In: Arden N, Blanco FJ, Bruyère A, et al. Atlas of Osteoarthritis. 2nd ed. London: Springer Healthcare; 2018: 11–17 [Google Scholar]
- 2.Dequeker J, Luyten FP. The history of osteoarthritis-osteoarthrosis. Ann Rheum Dis 2008;67(01):5–10 [DOI] [PubMed] [Google Scholar]
- 3.Li KC, Henkelman RM, Poon PY, Rubenstein J. MR imaging of the normal knee. J Comput Assist Tomogr 1984;8(06):1147–1154 [DOI] [PubMed] [Google Scholar]
- 4.PubMed. Bethesda, MDU.S. National Library of Medicine, National Institutes of Health, Health & Human Services. Available at: https://www.ncbi.nlm.nih.gov/pubmed. Accessed May 1, 2020 [Google Scholar]
- 5.Zwaan L, Schiff GD, Singh H. Advancing the research agenda for diagnostic error reduction. BMJ Qual Saf 2013;22(Suppl 2):ii52–ii57 [DOI] [PMC free article] [PubMed] [Google Scholar]
- 6.Cheng Q, Zhao FC. Comparison of 1.5- and 3.0-T magnetic resonance imaging for evaluating lesions of the knee: a systematic review and meta-analysis (PRISMA-compliant article). Medicine (Baltimore) 2018;97(38):e12401. [DOI] [PMC free article] [PubMed] [Google Scholar]
- 7.Potter HG, Linklater JM, Allen AA, Hannafin JA, Haas SB. Magnetic resonance imaging of articular cartilage in the knee. An evaluation with use of fast-spin-echo imaging. J Bone Joint Surg Am 1998;80(09):1276–1284 [DOI] [PubMed] [Google Scholar]
- 8.Jungmann PM, Agten CA, Pfirrmann CW, Sutter R. Advances in MRI around metal. J Magn Reson Imaging 2017;46(04):972–991 [DOI] [PubMed] [Google Scholar]
- 9.Kim HT, Lim JN, Chon KS. Reduction of metal artifact by using VAT-SEMAC in MRI. J Korean Soc Radiol 2019;13(02):227–232 [Google Scholar]
- 10.Runge VM, Richter JK, Heverhagen JT. Motion in magnetic resonance: new paradigms for improved clinical diagnosis. Invest Radiol 2019;54(07):383–395 [DOI] [PubMed] [Google Scholar]
- 11.Johnson PM, Recht MP, Knoll F. Improving the speed of MRI with artificial intelligence. Semin Musculoskeletal Radiol 2020;24(01): 012–020 [DOI] [PMC free article] [PubMed] [Google Scholar]
- 12.Liu F, Zhou Z, Samsonov A, et al. Deep learning approach for evaluating knee MR images: achieving high diagnostic performance for cartilage lesion detection. Radiology 2018;289(01):160–169 [DOI] [PMC free article] [PubMed] [Google Scholar]
- 13.Eagle S, Potter HG, Koff MF. Morphologic and quantitative magnetic resonance imaging of knee articular cartilage for the assessment of post-traumatic osteoarthritis. J Orthop Res 2017;35(03):412–423 [DOI] [PubMed] [Google Scholar]
- 14.Shakoor D, Guermazi A, Kijowski R, et al. Diagnostic performance of three-dimensional MRI for depicting cartilage defects in the knee: a meta-analysis. Radiology 2018;289(01):71–82 [DOI] [PubMed] [Google Scholar]
- 15.Jungmann PM, Welsch GH, Brittberg M, et al. Magnetic resonance imaging score and classification system (AMADEUS) for assessment of preoperative cartilage defect severity. Cartilage 2017;8(03):272–282 [DOI] [PMC free article] [PubMed] [Google Scholar]
- 16.Jones KJ, Sheppard WL, Arshi A, Hinckel BB, Sherman SL. Articular cartilage lesion characteristic reporting is highly variable in clinical outcomes studies of the knee. Cartilage 2019;10(03):299–304 [DOI] [PMC free article] [PubMed] [Google Scholar]
- 17.Nomura E, Inoue M, Kurimura M. Chondral and osteochondral injuries associated with acute patellar dislocation. Arthroscopy 2003;19(07):717–721 [DOI] [PubMed] [Google Scholar]
- 18.Boutin RD, Januario JA, Newberg AH, Gundry CR, Newman JS. MR imaging features of osteochondritis dissecans of the femoral sulcus. AJR Am J Roentgenol 2003;180(03):641–645 [DOI] [PubMed] [Google Scholar]
- 19.Guermazi A, Alizai H, Crema MD, Trattnig S, Regatte RR, Roemer FW. Compositional MRI techniques for evaluation of cartilage degeneration in osteoarthritis. Osteoarthritis Cartilage 2015;23 (10):1639–1653 [DOI] [PubMed] [Google Scholar]
- 20.Bashir A, Gray ML, Boutin RD, Burstein D. Glycosaminoglycan in articular cartilage: in vivo assessment with delayed Gd(DTPA)(2-)-enhanced MR imaging. Radiology 1997;205(02):551–558 [DOI] [PubMed] [Google Scholar]
- 21.Baum T, Joseph GB, Karampinos DC, Jungmann PM, Link TM, Bauer JS. Cartilage and meniscal T2 relaxation time as non-invasive biomarker for knee osteoarthritis and cartilage repair procedures. Osteoarthritis Cartilage 2013;21(10):1474–1484 [DOI] [PMC free article] [PubMed] [Google Scholar]
- 22.Chaudhari AS, Kogan F, Pedoia V, Majumdar S, Gold GE, Hargreaves BA. Rapid knee MRI acquisition and analysis techniques for imaging osteoarthritis. J Magn Reson Imaging 2019 [DOI] [PMC free article] [PubMed] [Google Scholar]
- 23.Mosher TJ, Dardzinski BJ. Cartilage MRI T2 relaxation time mapping: overview and applications. Semin Musculoskelet Radiol 2004;8(04):355–368 [DOI] [PubMed] [Google Scholar]
- 24.Chaudhari AS, Black MS, Eijgenraam S, et al. Five-minute knee MRI for simultaneous morphometry and T2 relaxometry of cartilage and meniscus and for semiquantitative radiological assessment using double-echo in steady-state at 3T. J Magn Reson Imaging 2018;47(05):1328–1341 [DOI] [PMC free article] [PubMed] [Google Scholar]
- 25.Sveinsson B, Chaudhari AS, Gold GE, Hargreaves BA. A simple analytic method for estimating T2 in the knee from DESS. Magn Reson Imaging 2017;38:63–70 [DOI] [PMC free article] [PubMed] [Google Scholar]
- 26.Eijgenraam SM, Chaudhari AS, Reijman M, et al. Time-saving opportunities in knee osteoarthritis: T2 mapping and structural imaging of the knee using a single 5-min MRI scan. Eur Radiol 2020;30(04):2231–2240 [DOI] [PMC free article] [PubMed] [Google Scholar]
- 27.Chaudhari AS, Stevens KJ, Sveinsson B, et al. Combined 5-minute double-echo in steady-state with separated echoes and 2-minute proton-density-weighted 2D FSE sequence for comprehensive whole-joint knee MRI assessment. J Magn Reson Imaging 2019; 49(07):e183–e194 [DOI] [PMC free article] [PubMed] [Google Scholar]
- 28.Kogan F, Levine E, Chaudhari AS, et al. Simultaneous bilateral-knee MR imaging. Magn Reson Med 2018;80(02):529–537 [DOI] [PMC free article] [PubMed] [Google Scholar]
- 29.Kim J, Kwon Lee J, Mu Lee K, Lee JK, Lee KM. Accurate image super-resolution using very deep convolutional networks. Paper presented at: 2016 IEEE Conference on Computer Vision and Pattern Recognition (CVPR). Las Vegas, NVIEEE2016:1646–1654 [Google Scholar]
- 30.Chaudhari AS, Fang Z, Kogan F, et al. Super-resolution musculoskeletal MRI using deep learning. Magn Reson Med 2018;80(05): 2139–2154 [DOI] [PMC free article] [PubMed] [Google Scholar]
- 31.Chaudhari AS, Stevens KJ, Wood JP, et al. Utility of deep learning super-resolution in the context of osteoarthritis MRI biomarkers. J Magn Reson Imaging 2020;51(03):768–779 [DOI] [PMC free article] [PubMed] [Google Scholar]
- 32.Chaudhari A, Fang Z, Lee JH, Gold G, Hargreaves B. Deep learning super-resolution enables rapid simultaneous morphological and quantitative magnetic resonance imaging. Int Workshop Mach Learn Med Image Reconstr 2018:3–11 [Google Scholar]
- 33.Norman B, Pedoia V, Majumdar S. Use of 2D U-Net convolutional neural networks for automated cartilage and meniscus segmentation of knee MR imaging data to determine relaxometry and morphometry. Radiology 2018;288(01):177–185 [DOI] [PMC free article] [PubMed] [Google Scholar]
- 34.Desai AAD, Gold GE, Hargreaves BA, Chaudhari AS. Technical considerations for semantic segmentation in MRI using convolutional neural networks. arXiv Prepr arXiv1902 01977 20191–24 [Google Scholar]