

Abstract
Traditional medicinal plants are rich reservoirs of antimicrobial agents, including antimicrobial peptides (AMPs). Advances in genomic sequencing, in silico AMP predictions, and mass spectrometry-based peptidomics facilitate increasingly high-throughput bioactive peptide discovery. Herein, Amaranthus tricolor aerial tissue was profiled via MS-based proteomics/peptidomics identifying AMPs predicted in silico. Bottom-up proteomics identified seven novel peptides spanning three AMP classes including lipid transfer proteins, snakins and a defensin. Characterization via top-down peptidomic analysis of Atr-SN1, Atr-DEF1, and Atr-LTP1 revealed unexpected proteolytic processing and enumerated disulfide bonds. Bioactivity screening of isolated Atr-LTP1 showed activity against the high risk ESKAPE bacterial pathogens (Enterococcus faecium, Staphylococcus aureus, Klebsiella pneumoniae, Acinetobacter baumannii, and Enterobacter cloacae). These results highlight the potential for integrating AMP prediction algorithms with complementary -omics approaches to accelerate characterization of biologically relevant AMP peptidoforms.
Graphical abstract

Botanical species are important sources of natural products, but exploration of non-model plants has been hindered by the lack of requisite databases for high-throughput -omics bioinformatics. However, decreasing sequencing costs are enabling large-scale studies to sequence botanical biodiversity, e.g., the 1000 Plant Project,1 the Medicinal Plant Genomic Database (medicinalplantgenomics.msu.edu), the 10,000 Plant Genomes Project,2 and Phytozome.3 As a result, non-model plant species are increasingly accessible to multi-omics studies, especially in the context of antimicrobial peptide (AMP) discovery. Conservative estimates suggest ~50 AMPs per plant species,4–6 many of which could be rapidly predicted in silico from genomes/transcriptomes and characterized using mass spectrometry-based approaches.
In silico prediction algorithms, such as the Small Peptide Alignment Discovery Application (SPADA) and Cysmotif Searcher, predict AMPs from genomes/transcriptomes based on conserved features (e.g., cysteine pattern, N-terminal signal peptide, molecular weight).4,7 SPADA uses a sequence homology-based approach to identify AMPs that are similar to predefined classes.7 Cysmotif Searcher focuses on highly conserved cysteine motifs that form AMP class-specific disulfide bonds.4 These algorithms can be applied readily to publicly available botanical genomic/transcriptomic data. For example, in silico prediction of AMPs within 1267 plant transcriptomes using Cysmotif Searcher and SPADA revealed between 50 – 150 AMPs per species.5 While in silico prediction provides peptide leads, accurate prediction of fully processed plant AMPs is particularly challenging. Lack of peptide production, knowledge of potential processing/post-translational modifications (PTMs), and direct physical evidence of bioactivity all hinder the utility of AMP prediction used alone.8
Mass spectrometry-based strategies complement in silico predictions, providing direct evidence of protein translation and revealing PTMs. Complementary MS-based approaches to characterize novel AMPs include bottom-up proteomics and top-down peptidomics (Figure 1).9,10 The former utilizes enzymatic digestion to produce smaller peptides more amenable to MS/MS fragmentation and identification, but results in information losses regarding full characterization of the intact molecular species. Termini and post-translational processing can be difficult to predict, thus limiting characterization results. Top-down peptidomics analyzes the intact full-length molecular species and can reveal accurate proteolytic processing and variable PTMs. Combined, these MS-based studies may be leveraged to detect actively translated AMPs and assist in defining biologically relevant peptidoforms.
Figure 1.
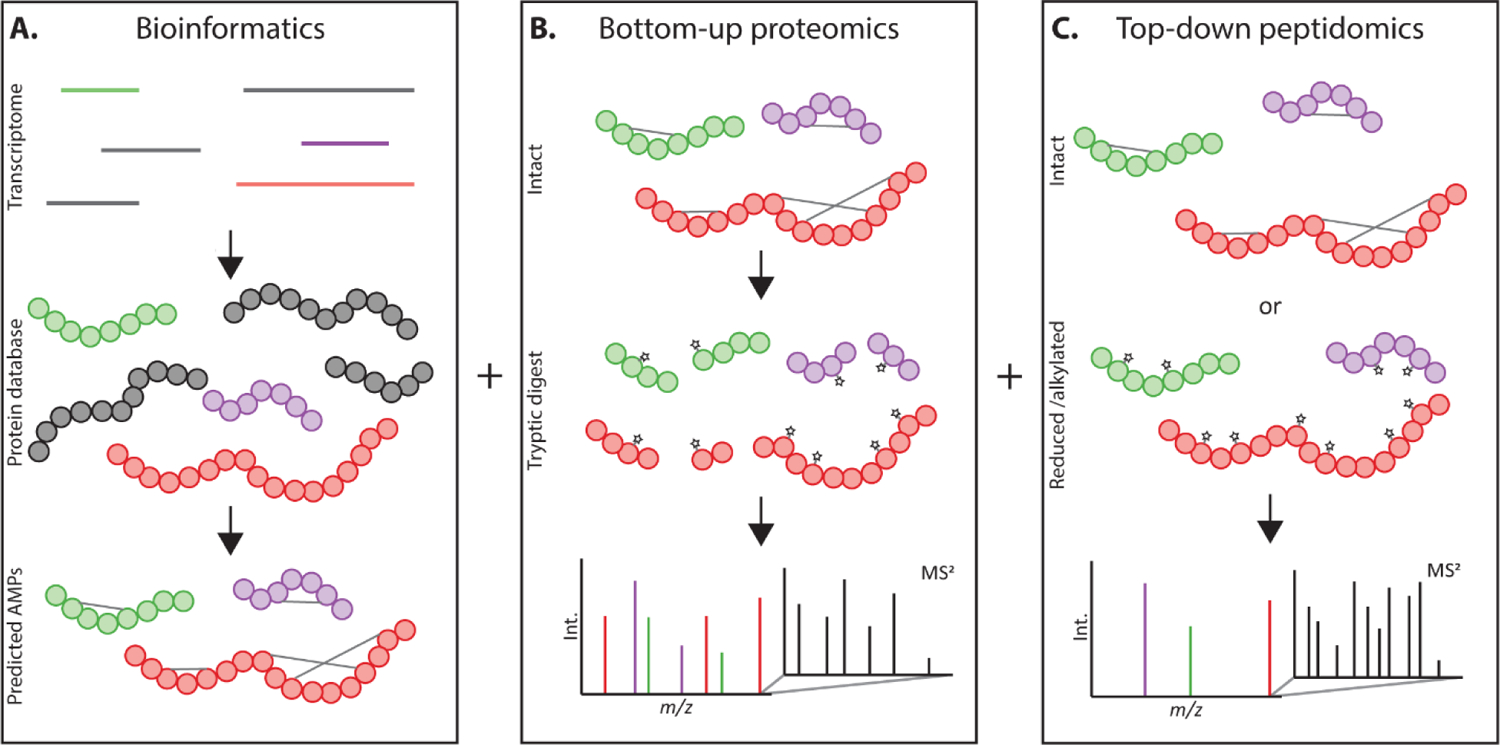
Bioinformatics and mass spectrometry were used to profile AMPs from A. tricolor. (A) A publicly available transcriptome from the aerial tissue of A. tricolor laid the foundation for in silico translation of a protein database and prior literature predictions of AMPs using SPADA and Cysmotif Searcher. MS-based techniques were leveraged to identify predicted AMPs within A. tricolor fractions. (B) A bottom-up proteomics workflow was used to broadly profile AMPs. Fractions were reduced, alkylated and trypsin digested to produce smaller peptides that were more amenable to MS/MS fragmentation and identification via Mascot database search. (C) Top-down peptidomics was used to detect full-length AMPs and enumerate their disulfide bonds. Although full-length AMPs fragment less efficiently, they provide direct evidence of proteolytic processing and variable PTMs included in mature peptidoforms.
The genus Amaranthus has been used in ethnobotanical remedies worldwide.11 Amaranthus tricolor L. (Amaranthaceae) (red spinach) has been used to treat dysentery and control hemorrhaging,12,13 and systematic studies confirmed antimicrobial, hepatoprotective, gastroprotective, neuroprotective, and anti-inflammatory activities of leaf extracts.14–19 While small molecules have been a major focus of bioactive characterization, two AMPs (AC-AMP2 and Atr-AMP1) are known in this species.20,21 AC-AMP2 is an antifungal hevein-like peptide identified in Amaranthus caudatus L. (Amaranthaceae)22 and detected via PCR in the seeds of A. tricolor.22 Atr-AMP1 is a short-chain proline-rich antibacterial peptide discovered in aerial tissue via PepSAVI-MS and active against Escherichia coli and Staphylococcus aureus.14 Interestingly, recent in silico efforts have predicted 181 AMPs from A. tricolor aerial tissue suggesting that many bioactive peptides remain to be discovered.5
Herein, proteomic profiling revealed the production of predicted AMPs from A. tricolor (Figure 1). Bottom-up proteomics has provided peptide-level evidence for seven novel AMPs including two snakins, a defensin, and three lipid transfer proteins. In turn, top-down peptidomics analysis of intact Atr-SN1, Atr-DEF1, and Atr-LTP1 identified cleavage events not predicted in silico and enumerates disulfide bonds. Isolated Atr-LTP1 has demonstrated activity against Enterococcus faecium, Staphylococcus aureus, Klebsiella pneumoniae, Acinetobacter baumannii, and Enterobacter cloacae. This work has identified novel antimicrobial peptides from A. tricolor in a high-throughput manner and has demonstrated that leveraging sequencing, AMP prediction and proteomics/peptidomics is a powerful approach for AMP discovery/characterization in important ethnobotanical species.
RESULTS AND DISCUSSION
AMP Profiling via Bottom-up Proteomics.
A. tricolor aerial tissue fractions were reduced, alkylated, trypsin digested, and analyzed via LC-MS/MS resulting in 127 A. tricolor identifications via Mascot (Table S1, Supporting Information). These results were parsed for AMPs predicted from the A. tricolor transcriptome.5 In total, seven of 181 predicted AMPs were identified (Table 1), including two snakins (Atr-SN1 and Atr-SN2), one defensin (Atr-DEF1), three lipid transfer proteins (Atr-LTP1, Atr-LTP2, Atr-LTP3), and one unclassified putative AMP (Atr-AMP2). While these results provide the first untargeted profiling of A. tricolor AMPs, additional top-down experiments are necessary to fully characterize peptidoforms including PTMs and additional proteolytic cleavages required for the mature form.
Table 1.
Predicted antimicrobial peptides identified in A. tricolor fractions.a
| name | transcript ID | protein score | class | predicted mature sequence |
|---|---|---|---|---|
| Atr-DEF1 | 2005035 | 395 | Defensin | TEMGPKVAEARTCTTPSQKFRGLCVSKRNCEGVCNTEGFPSGSCDGFRRRCMCGRPCPAA |
| Atr-LTP1 | 2078054 | 316 | Lipid tranfer protein | AISCGKVATSVAPCIPYITGKGPGPTAGCCNGIKALNAAASTPADRKTACNCLKSAAGSIAGLNYGTAAGLPGKCGVRIPYAISPNTNCNAVN |
| Atr-SN1 | 2076920 | 104 | Snakin | IQPQTTSNQVGSNTGNVSESKIDCGAACAVRCSATKRPNLCKRACGSCCNRCNCVPPGTSGNYEACPCYAGLTTHGTRKKCP |
| Atr-LTP2 | 2015804 | 42 | Lipid transfer protein | AINCGLVSQSLAPCLAFLENGNGPSAACCKGVKTLQSLANTVQDKRTACRCMKSAAAAIPGINHKNTAALPSKCGVRIGTVAGPQTDCNKIN |
| Atr-LTP3 | 2078609 | 38 | Lipid transfer protein | GVTCGQVTSSLAPCMSALTGGGSPSPACCGGIRSLNSMASTPADRKAACSCLKSAASSVKGINLSAASGLPGKCGVHIPYPISTSVDCSKVN |
| Atr-AMP2 | 2074890 | 18 | Unknown - SPADA ID | SASNVRATYNNYNPQNIGWNYYTASVYCATWDGNQPLSWRKQYGWTAFCGPVGPRGQASCGKCLLVTNMATGAQTTVRIVDQCSNGGLDLDVNVFNQIDTNGQGYQQGHLQVNYQFVNC |
| Atr-SN2 | 2012137 | 15 | Snakin | HQMIESSGPKRSLLGAINCGAACVARCRLSSRPNLCHRACGTCCARCQCVPPGTSGNQELCPCYYNQRTHGGKRKCP |
Red text indicates tryptic peptides identified in the bottom-up proteomics experiment.
Snakin Characterization.
Snakins are approximately 60 residues in length and contain six disulfide bonds.23 Translated as precursor peptides with an N-terminal signal peptide followed by a leader peptide, both regions must be cleaved from the core peptide to produce the mature AMP.24 However, in silico prediction algorithms do not account for leader peptide cleavage,4,7,25 and, as a result, predicted sequences are not mature snakins. Therefore, top-down peptidomics was used to identify mature snakins within intact A. tricolor fractions. Possible mature sequences of Atr-SN1 and Atr-SN2 were predicted in silico by varying leader peptide cleavage sites. Then, the theoretical monoisotopic mass of each possible peptidoform was calculated assuming that the snakins would form six disulfide bonds. Top-down peptidomic data from intact A. tricolor fractions was interrogated to identify any of these possible mature sequences. Atr-SN1 was detected intact in fraction five with six disulfide bonds and leader peptide cleavage between residues Lys21 and Ile22 of the predicted peptide sequence (theoretical mass 6328.73 Da, Figure 2A and B). Subsequent reduction and alkylation produced a mass shift of 696.35 Da and confirmed the presence of six disulfide bonds (theoretical mass 7025.08 Da) (Figure S1, Supporting Information). Top-down and bottom-up MS/MS sequencing confirmed the sequence (Figure 2C) (Figure S2 and Tables S2–S4, Supporting Information). Sequence comparison of Atr-SN1 with the Antimicrobial Peptide Database (APD)26 revealed homology with five snakins: (StSN1, MsSN1, StSN2, tomato snakin-2, and PaSN) and confirmed that the snakin cysteine motif was maintained within Atr-SN1 (Figure 2D).27
Figure 2.
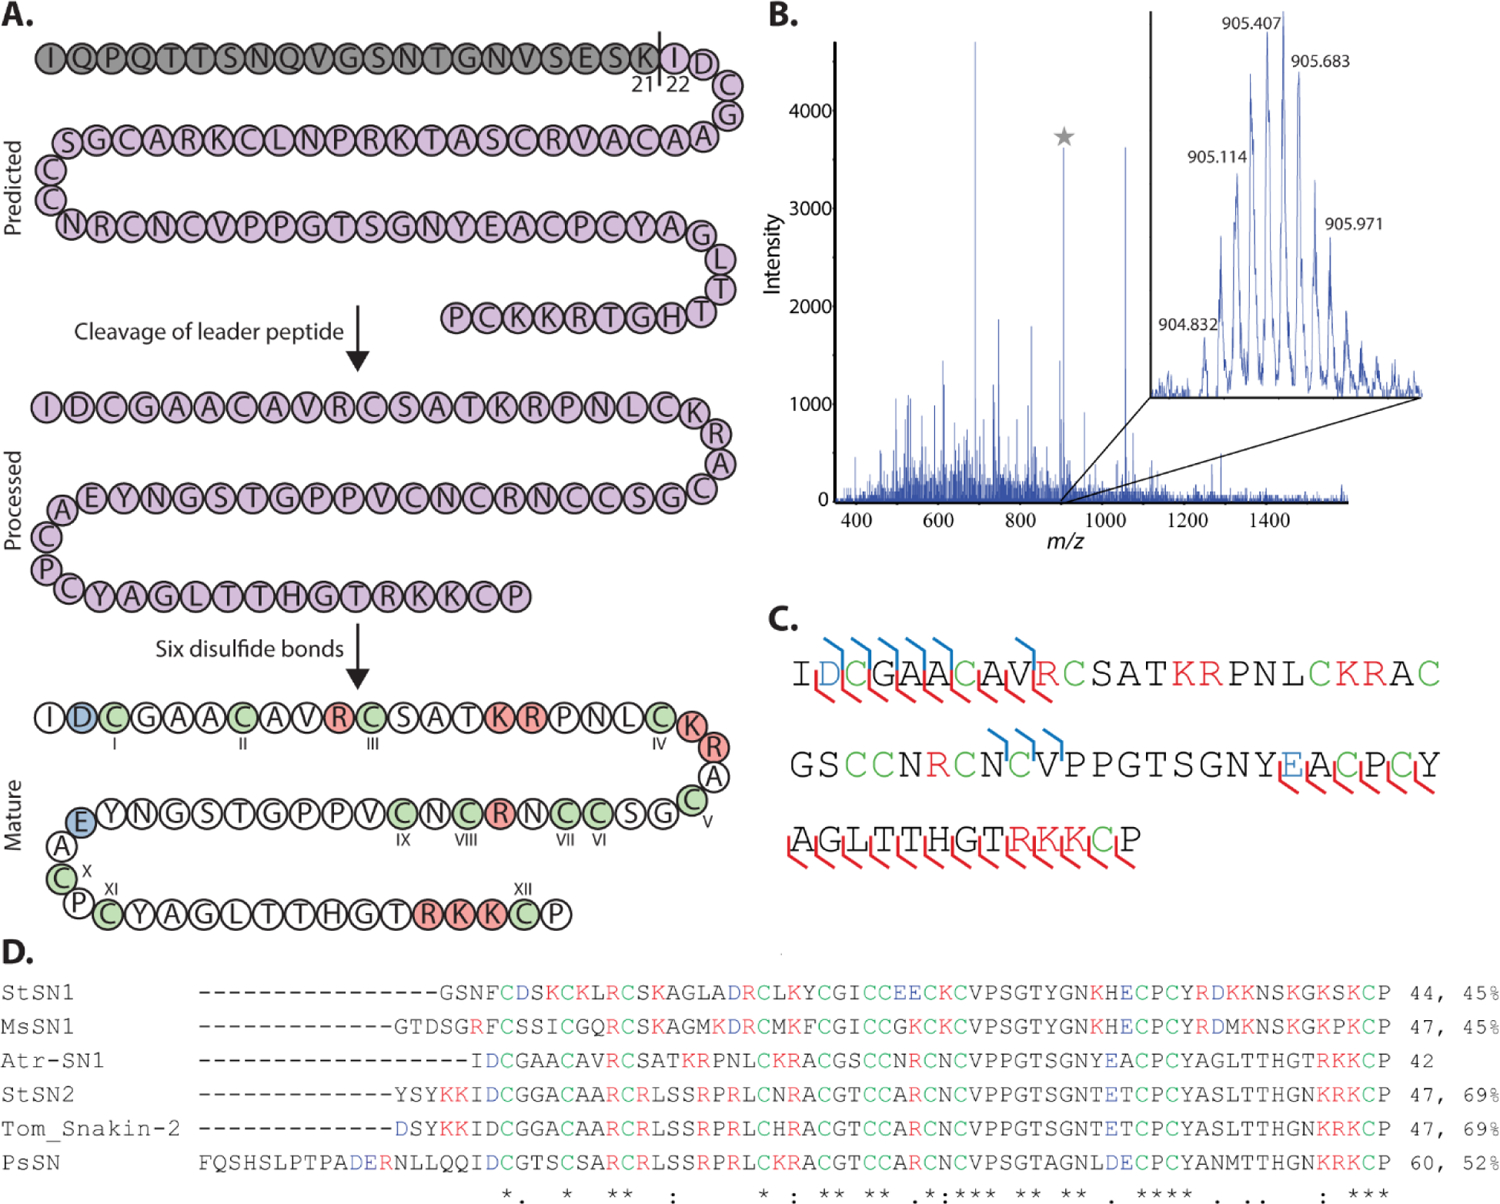
(A) Atr-SN1 was predicted by Cysmotif Searcher as an 82-residue peptide. The predicted peptide encompasses a leader peptide (grey) and the core peptide (purple). The leader peptide must be cleaved to yield mature Atr-SN1 that forms six disulfide bonds with unknown connectivity. (B) Mature Atr-SN1 produced by leader peptide cleavage between Lys21 and Ile22 and the formation six disulfide bonds (6326.77 Da, m/z 904.832 (+7), 9 ppm error) was detected during top-down peptidomic analysis of fraction five. (C) Fragmentation map summarizing coverage produced via fragmentation of reduced and alkylated Atr-SN1 and its tryptic peptides. Together, these experiments resulted in 52 percent sequence coverage (31/60 bonds). (D) Sequence alignment of Atr-SN1 with similar snakins from the APD including percent sequence similarity with Atr-SN1. Cysteines forming disulfide bonds are green, basic residues are red, and acidic residues are blue. Asterisks note fully conserved residues, two dots note positions with highly similar residues, and single dots note positions with weakly similar residues.
Defensin Characterization:
Atr-DEF1
Defensins are widespread and among the most well-studied classes of plant AMPs. Their mature forms are typically cationic 45–54 residue peptides with four disulfide bonds.28–30 They are generally expressed as a precursor peptide with an N-terminal signal peptide and, in rare cases, a C-terminal acidic prodomain that are both cleaved from the mature peptide.28–30 As previously noted, methods used to predict AMPs do not fully account for proteolytic processing and would not identify C-terminal cleavage. To characterize mature Atr-DEF1, A. tricolor fractions were examined for predicted masses corresponding to Atr-DEF1 with different C-terminal cleavage sites and four disulfide bonds. No masses were detected corresponding to predicted Atr-DEF1 with C-terminal cleavages only. Additional calculations of theoretical monoisotopic masses of Atr-DEF1 with extended N-terminal signal peptides, C-terminal truncations, and four disulfide bonds led to the discovery of mature Atr-DEF1 resulting from cleavage events between Ala10|Arg11 and Cys57|Pro58 (theoretical mass 5181.25 Da, Figures 3A and B) in fraction five. Subsequent reduction / alkylation produced a mass shift of 464.23 Da (theoretical mass 5645.48 Da) (Figure S3, Supporting Information) confirming the presence of four disulfide bonds. MS/MS fragmentation of reduced and alkylated Atr-DEF1 and its tryptic peptides confirmed the sequence (Figure 3C) (Figure S4 and Tables S5–S7, Supporting Information).
Figure 3.

The predicted sequence of Atr-DEF1 differs from the fully proteolytically processed peptide (purple) by the cleavage additional N-terminal (Ala10|Arg11, grey) and C-terminal (Cys57|Pro58, white) peptides. (B) The mature defensin contains four disulfide bonds and was detected (5181.25 Da, m/z 864.550 (+6), 2 ppm error) in fraction five. (C) Fragmentation of reduced and alkylated Atr-DEF1 and its tryptic peptides resulted in 89 percent sequence coverage (41/46 peptide bonds). (D) Sequence alignment of Atr-DEF1 with similar defensins from the APD shows that Atr-DEF1 shares conserved cysteine residues and a γ-core motif, shaded in grey. Sequence similarity of Atr-DEF1 with APD defensins ranged from 56–60 percent. Plant defensins form highly conserved disulfide bonds allowing the disulfide bonding pattern of Atr-DEF1 to be predicted. Cysteines forming disulfide bonds are green, basic residues are red, and acidic residues are blue. Asterisks note fully conserved residues, two dots note positions with highly similar residues, and single dots note positions with weakly similar residues.
Sequence alignment of Atr-DEF1 revealed greater than fifty percent sequence similarity with five plant defensins in the APD (OsDEF8, ZmD32, AtPDF2.3, PsDef1, and MtDef4) (Figure 3D).26 As expected, Atr-DEF1 was found to contain the defensin cysteine motif that forms four highly conserved disulfide bonds (CysI–CysVIII, CysII–CysV, CysIII–CysVI, and CysIV–CysVII) and the defensin γ-core motif.31,32
Lipid Transfer Protein Characterization.
Lipid transfer proteins are a class of highly stable plant AMPs that contain four disulfide bonds and are expressed with an N-terminal signal peptide. Three A. tricolor lipid transfer proteins were identified via bottom-up proteomics profiling. Unlike snakins and defensins, lipid transfer proteins are not expected to undergo additional proteolytic processing that is not predicted in silico. Top-down analysis of fraction three revealed a peptide corresponding to the theoretical mass of Atr-LTP1 with four disulfide bonds (Figure 4A and B, theoretical mass 8969.39 Da). A 464.23 Da mass shift (theoretical mass 9433.77 Da) (Figure S5, Supporting Information) from reduction/alkylation confirmed the presence of four disulfide bonds. The sequence of Atr-LTP1 was confirmed using the MS/MS fragmentation pattern of reduced and alkylated Atr-LTP and its tryptic peptides (Figure 4C) (Figure S6 and Tables S8–S12, Supporting Information).
Figure 4.

(A) The predicted sequence of Atr-LTP1 (purple) matches the experimentally determined mature peptide that forms four disulfide bonds. (B) A peptide for which the mass corresponded to Atr-LTP1 with four disulfide bonds (8969.371 Da, m/z 1282.346, +7, 2 ppm error) was detected during top-down analysis of fraction three. (C) Fragmentation map summarizing sequence coverage produced by collision-induced dissociation of reduced and alkylated Atr-LTP1 and its tryptic peptides. MS/MS experiments resulted in 72 percent coverage of Atr-LTP1 (66/92 peptide bonds). (D) Sequence alignment of Atr-LTP1 with similar lipid transfer proteins from the APD including percent sequence similarity. Cysteine connectivity is predicted based on highly conserved lipid transfer protein disulfide bonding patterns. Cysteines forming disulfide bonds are green, basic residues are red, and acidic residues are blue. Asterisks note fully conserved residues, two dots note positions with highly similar residues, and single dots note positions with weakly similar residues.
APD sequence alignment revealed similarities with two lipid transfer proteins: Cy-AMP3 and LTP110 identified in Cycas revoluta and Oryza sativa, respectively (Figure 4D).26 Lipid transfer proteins can be subdivided into several families based on exons, cysteine motifs, and post-translational modifications.33 Atr-LTP1, Cy-AMP3,34 and LTP11035 are class 1 lipid transfer proteins containing the cysteine motif CX8,9CX13–17CCX18–20CXCX19–24CX7–14C where Xn is the number of nonspecific residues between cysteines. These cysteines are connected in a highly conserved disulfide bonding pattern (CysI–CysVI, CysII–CysIII, CysIV–CysVII, and CysV–CysVIII), which can be used to infer the disulfide connectivity of Atr-LTP1.36
Atr-LTP1 Bioactivity.
Atr-LTP1 was prioritized for purification and bioactivity screening because it was estimated crudely to be ten times more concentrated in A. tricolor fractions than Atr-SN1 and Atr-DEF1. Atr-LTP1 was partially purified via reversed-phase chromatography and assayed against the ESKAPE pathogens (Enterococcus faecium, Staphylococcus aureus, Klebsiella pneumoniae, Acinetobacter baumannii, Pseudomonas aeruginosa and Enterobacter cloacae). The partial purified peptide demonstrated statistically significant activity against all bacterial species screened except P. aeruginosa, with the highest being ~40 percent activity against K. pneumoniae (Figure S7A, Supporting Information). After purification, the minimum inhibitory concentration of Atr-LTP1 against K. pneumoniae was found to be greater than 50 μM suggesting that Atr-LTP1 is weakly antibacterial (Figure S7B, Supporting Information), a trend found in many lipid transfer proteins, including Cy-AMP3 and LTP110.34–36
Evaluation of approach.
Increased accessibility of transcriptomic data for non-model plant species, such as A. tricolor, has the potential to greatly accelerate AMP discovery. However, this study has illustrated several key considerations for success: differential AMP expression, reliance on prediction algorithms, and bioactivity confirmation. AMPs can be both constitutively or differentially expressed based on environmental stimuli.37 As such peptide extracts may contain a different set of AMPs than publicly available transcriptomes because each was produced under unique growth conditions (e.g. temperature, soil salinity, pathogen exposure). Increased sample diversity from variable growth conditions, maturity, tissue type, or genome based predictions would enhance peptide discovery.
High-throughput studies to identify AMPs are reliant on imperfect AMP prediction algorithms that are under continuous refinement. Cysmotif Searcher-based AMP predictions from 1267 botanical transcriptomes revealed > 40,000 putative AMPs5, dwarfing the number of known AMPs compiled in the plant AMP database PlantPepDB38 (< 4000). This highlights that most predicted AMPs have not been observed in vivo, thus limiting scientific understanding of processing and mature, bioactive peptidoforms. Proteomic/peptidomic studies, such as the one presented here, enable characterization of predicted AMPs and provide evidence of mature peptidoforms which can be used to refine and enhance predictive algorithms.
Putative AMP activity can be predicted using rapidly evolving machine learning algorithms (e.g. CS-AMPPred, PredSTP, and CSPred) but is ultimately unconfirmed until assay against pathogens.37,39–41 AMP expression levels may prohibit isolation for activity screening and mature peptidoforms may vary from in silico predictions. In these cases, AMPs characterized via top-down MS provide excellent starting points for heterologous expression or peptide synthesis when sufficient material is required for thorough biological characterization.
In conclusion, AMPs from the aerial tissue of A. tricolor were identified using proteomics/peptidomics guided by in silico AMP predictions. Bottom-up analysis revealed evidence for the translation of seven antimicrobial peptides. Top-down analysis of intact peptide fractions confirmed the mature sequences of Atr-SN1, Atr-DEF1, and Atr-LTP1, including enumerating disulfide bonds and identifying additional unpredicted proteolytic processing. These results highlight that publicly available transcriptomic data can be leveraged with proteomics to rapidly identify AMPs within underexplored plant species, revealing biologically relevant AMP peptidoforms and guiding best strategies for activity assessment.
EXPERIMENTAL SECTION
General Experimental Procedures.
Off-line separations were performed with a Shimadzu Prominence HPLC equipped with a UV–vis detector (220 nm) (Shimadzu, Kyoto, Japan). LC-MS/MS data was collected using a nano-LC-ESI-MS/MS platform composed of a nanoAcquity UPLC (Waters, Milford, MA) coupled to a TripleTOF 5600 mass spectrometer (AB Sciex, Framingham, MA). The mass spectrometry proteomics data have been deposited at the ProteomeXchange Consortium (http://proteomecentral.proteomexchange.org) via the PRIDE partner repository42 with the data set identifier PXD022242 (Reviewer account details: Username: reviewer_pxd022242@ebi.ac.uk, Password: ECtJlYQH).
The ESKAPE pathogen strains are clinical isolates stored within the Shaw Laboratory collection. Enterococcus faecalis (E:1450), Klebsiella pneumoniae (K: 1433), Pseudomonas aeruginosa (P: 1423), and Enterobacter cloacae (E: 1454) were obtained by the Shaw Lab from Moffitt Cancer Center (Tampa, FL).43 Staphylococcus aureus (S: 635) was obtained from Tampa General Hospital (Tampa, FL).43 Acinetobacter baumannii (A: 5075) was obtained via a colleague at the Walter Reed Army Institute of Research (Silver Spring, MD).44
Plant Material.
Amaranthus tricolor seeds (Strictly Medicinal Seeds, Williams, OR) were planted in nutrient rich soil and grown under controlled temperature (17.5–20.3 °C) and light cycle (14-h light) conditions as previously described.20 Aerial tissue was harvested in November 2018, flash frozen in liquid nitrogen and stored at −80 °C until extraction. A specimen was deposited in the Herbarium of the University of North Carolina at Chapel Hill (NCU, accession number 666014).
Peptide Extraction and Fractionation.
The A. tricolor aerial tissue peptide extract was produced as previously described14 with modifications noted herein. Briefly, aerial tissue was extracted in an acetic acid solution with size-exclusion steps to remove large proteins (>30 kDa) and small molecules (<1 kDa). The crude extract was concentrated to 1 mL/500 g starting material and fractionated via strong cation-exchange chromatography (SCX) to remove neutral and negatively charged molecules and reduce sample complexity. Fractionation was performed by injecting 0.5 mL aliquots on a PolySulfethyl A column (100 mm × 4.6 mm, 3 μm particles, PolyLC, Columbia, MD). A 30 min gradient (0.5 mL/min) was used starting from 100% mobile phase A (5 mM ammonium formate, 20% acetonitrile, pH 2.7) with the following steps: 0–5 min: 0% B (500 mM ammonium formate, 20% acetonitrile, pH 3.0); 5–17 min: 0–100% B; 17–30 min: 100% B. Three 5-min fractions were collected from 10 – 25 min. SCX fractions were desalted using a SepPak C18 column (Waters, 500 mg) sequentially eluting in 80/20/0.1 water/acetonitrile/formic acid and 60/40/0.1 water/acetonitrile/formic acid. Sep-Pack eluate was collected producing a total of six fractions (Figure S8, Supporting Information) and concentrated to dryness in a vacuum centrifuge. Fractions were resuspended in 20 μL LC-MS grade water for further analysis.
Reduction, Alkylation, and Digestion.
Peptide fractions were reduced with 10 mM dithiothreitol (Millipore-Sigma) at 45 °C, 850 rpm, 30 min, and alkylated with 100 mM iodoacetamide (Millipore-Sigma) at 25 °C, 850 rpm, 15 min. For enzymatic digestion, a reduced and alkylated sample was incubated with an enzyme/protein ratio of 1:50 (w/w) with the endoproteinase trypsin (sequencing grade, Millipore-Sigma) overnight (37 °C, 850 rpm, Thermal Sake Touch, VWR). All samples were desalted with C18 ZipTips (Millipore-Sigma) prior to LC-MS/MS analysis.
MS Data Acquisition and Processing.
Peptide fractions were analyzed using a nanoAcquity UPLC (Waters) coupled to a TripleToF 5600 (Sciex), as previously described, but with the following specifications: 0.1% formic acid in all mobile phases and a trapping mobile phase composition of 1% acetonitrile/0.1% formic acid.45 The MS was operated in positive-ion, high-sensitivity mode with the MS survey spectrum using a mass range of m/z 350–1600 in 250 ms and information-dependent acquisition (IDA) of MS/MS data using an eight second dynamic exclusion window. Collected raw MS data (*.wiff) were converted to Mascot Generic Files (*.mgf) using the Sciex Data Converter.
Database Searching and Peptide Identification.
The assembled Amaranthus tricolor transcriptome (1000 Plant Project sample ID: XSSD)1,46 was downloaded from Cyverse Data Commons (https://datacommons.cyverse.org/; accessed July 2020) and subjected to 3-frame forward translation using EMBOSS Transeq27 via Galaxy47 (usegalaxy.org) with a standard codon table to generate a theoretical A. tricolor protein database. Sequences for common laboratory contaminants (www.thegpm.org/cRAP; 116 entries) were appended to the database prior to Mascot searching (Matrix Science, version 2.5.1). Digests were searched against the aforementioned database and a decoy database using peptide/fragment mass tolerances 15 ppm/0.5 Da, trypsin specificity, three possible missed cleavages, and a fixed modification of cysteine carbamidomethylation. Peptides false discovery rates (FDR) were adjusted to ≤1% using the Mascot Percolator algorithm.48 Peptides with a Mascot score less than 13, matching to contaminant proteins, or identifications with only non-unique peptides were eliminated from further analysis. Identified proteins were parsed manually for AMPs previously predicted (https://github.com/fallandar/cysmotifsearcher)4,5 from the 1000 Plant Project A. tricolor transcriptome.
Spectral Annotations.
Fragmentation spectra were annotated using peak lists exported from PeakView (Sciex) and imported into the Interactive Peptide Spectral Annotator (Coon Group, University of Wisconsin Madison, http://www.interactivepeptidespectralannotator.com/PeptideAnnotator.html).49 Annotated spectra were generated using appropriate peptide sequences, charges, and 25 ppm error. Fragment assignments were validated manually.
Sequence Alignments.
Sequences of Atr-SN1, Atr-DEF1, and Atr-LTP1 were submitted to the Antimicrobial Peptide Database APD3: Calculator and Predictor Tool (http://aps.unmc.edu/AP/main.php)26 for alignment with AMPs with validated activity. Sequence alignment figures were prepared using the ClustalW Multiple Sequence Alignment tool to identify highly conserved residues.27
Purification of Atr-LTP1.
A preliminary simplified fraction containing partially purified Atr-LTP1 was prepared from 100 g of aerial tissue using fractionation methods previously described.14 Briefly, small molecules were removed from the crude extract using SCX group fractionation. The single SCX fraction was desalted using a C18 SepPak (Waters) and further fractionated via reversed-phase chromatography using a Jupiter C18 column (150 × 4.6 mm, 5 μm, 300 Å, Phenomenex). Fractionation was performed using a 42 min two-step gradient (1 mL/min, 40 °C) starting from 100% mobile phase A (94.9/5/0.1 water/acetonitrile/trifluoracetic acid) with the following steps: 0–4 min: 0% B (99.9/0.1 acetonitrile/trifluoracetic acid); 4–25 min: 0–45% B; 25–36 min: 45–100% B; 36–40 min: 100% B; 40–42 min: 100–0% B. The simplified fraction containing Atr-LTP1 was collected between 25–28 min, concentrated to dryness, and resuspended 380 μL of LC-MS water for bioassay.
In order to isolate Atr-LTP1, peptide fractions were prepared as described above in “Peptide Extraction and Fractionation” starting with 250 g of aerial tissue reserving fraction 3 for Atr-LTP1 isolation. A 200 μL injection of this fraction was separated on an Agilent 300 Extend C18 column (4.6 × 250 mm, 5 μm) using a 23 min gradient (1.25 mL/min, 40 °C) starting from 90% mobile phase A (5% acetonitrile/0.1% formic acid) with the following steps: 0–15 min: 10–20% B (100% acetonitrile/0.1% formic acid); 15–20 min: 20–10% B; 20–23 min: 10% B. An eluate containing Atr-LTP1 was collected from 8–12 min, concentrated to dryness via vacuum centrifugation, resuspended in 6 mL LC-MS water. Then, 300 μL aliquots were separated on a Jupiter C18 column (150 × 4.6 mm, 5 μm, 300 Å, Phenomenex) using an 11 min gradient (1.25 mL/min, 40 °C) starting from 22% mobile phase A (0.1% formic acid) with the following steps: 0–10 min: 22–23.5% B (99.9% acetonitrile/0.1% formic acid); 10–11 min: 23.5% B. Purified Atr-LTP1 was collected from 2.5–3.5 min. Purified peptide was concentrated to dryness in a vacuum centrifuge and resuspended in LC-MS water. Atr-LTP1 concentration was estimated using a Thermo Scientific Nanodrop 100.
Bioassay Atr-LTP1.
All bacterial cultures were synchronized to mid-exponential phase by inoculating 50 μL of overnight culture into 5 mL of tryptic soy broth (TSB) and incubating with shaking (275 rpm) at 37 °C for 3 h. All assays were performed in 96-well flat-bottomed polypropylene plates (Plate One). Each well of the assay plate contained 20 μL 2x Mueller Hinton Broth (MHBI, 42 g/L), 40 μL 1x MHBI (21 g/L), 20 μL test sample, and 20 μL bacterial culture such that bacteria were seeded in each well at a final concentration of 1×10⁷ CFU/mL. The addition of 2x MHBI broth was used to ensure sufficient nutrients since the fractions themselves accounted for 1/5 of the final volume. Tryptic spy broth (TSB, 30 g/L) was substituted for MHBI for E. faecium and S. aureus due to their suboptimal growth in MBHI. Each organism was tested in biological triplicate and each assay included medium only controls, solvent only controls, and commercial antibiotic controls. Tetracycline at 50 μg/mL was used as the control for E. faecalis, A. baumannii, and P. aeruginosa, while gentamicin at 50 μg/mL was used against S. aureus, K. pneumoniae, and E. cloacae. The prepared plates were incubated at 37 °C, 275 rpm shaking for 47 h depending on the organism’s growth characteristics. Specifically, final reads were taken after 4 h for S. aureus, K. pneumoniae, and E. cloacae. E. faecalis and A. baumannii had final reads taken after 5 h and P. aeruginosa was grown with compound for 7 h. Optical density reads were taken using a Citation 5 plate reader (BioTek, Winooski, VT) at 600 nm. Percent activity was calculated for each well using the following formula: % activity = ((1 − ((OD600 of fraction − OD600 of positive control)/(OD600 of negative control − OD600 of positive control)) × 100. A standard two-way t-test was performed to determine significance of each set of samples as compared to the no-treatment control.
Supplementary Material
AtrProfile_SupportingInfo_2.xls: Table S1. A. tricolor database identifications
AtrProfile_SupportingInfo_1.pdf: Supporting mass spectra, Atr-LTP1 bioassays, and sample fractionation scheme.
ACKNOWLEDGMENTS
This work was supported by NIH-NIGMS under award number 1R01GM125814 to L.M.H. and L.N.S. T.B.M. acknowledges support from the NSF Graduate Research Fellowship program (DGE-1650016) and American Chemical Society Division of Analytical Chemistry Graduate Fellowship.
REFERENCES
- (1).Leebens-Mack JH; Barker MS; Carpenter EJ; Deyholos MK; Gitzendanner MA; Graham SW; Grosse I; Li Z; Melkonian M; Mirarab S; Porsch M; Quint M; Rensing SA; Soltis DE; Soltis PS; Stevenson DW; Ullrich KK; Wickett NJ; DeGironimo L; Edger PP; Jordon-Thaden IE; Joya S; Liu T; Melkonian B; Miles NW; Pokorny L; Quigley C; Thomas P; Villarreal JC; Augustin MM; Barrett MD; Baucom RS; Beerling DJ; Benstein RM; Biffin E; Brockington SF; Burge DO; Burris JN; Burris KP; Burtet-Sarramegna V; Caicedo AL; Cannon SB; Çebi Z; Chang Y; Chater C; Cheeseman JM; Chen T; Clarke ND; Clayton H; Covshoff S; Crandall-Stotler BJ; Cross H; DePamphilis CW; Der JP; Determann R; Dickson RC; Di Stilio VS; Ellis S; Fast E; Feja N; Field KJ; Filatov DA; Finnegan PM; Floyd SK; Fogliani B; García N; Gâteblé G; Godden GT; Goh FQY; Greiner S; Harkess A; Heaney JM; Helliwell KE; Heyduk K; Hibberd JM; Hodel RGJ; Hollingsworth PM; Johnson MTJ; Jost R; Joyce B; Kapralov MV; Kazamia E; Kellogg EA; Koch MA; Von Konrat M; Könyves K; Kutchan TM; Lam V; Larsson A; Leitch AR; Lentz R; Li FW; Lowe AJ; Ludwig M; Manos PS; Mavrodiev E; McCormick MK; McKain M; McLellan T; McNeal JR; Miller RE; Nelson MN; Peng Y; Ralph P; Real D; Riggins CW; Ruhsam M; Sage RF; Sakai AK; Scascitella M; Schilling EE; Schlösser EM; Sederoff H; Servick S; Sessa EB; Shaw AJ; Shaw SW; Sigel EM; Skema C; Smith AG; Smithson A; Stewart CN; Stinchcombe JR; Szövényi P; Tate JA; Tiebel H; Trapnell D; Villegente M; Wang CN; Weller SG; Wenzel M; Weststrand S; Westwood JH; Whigham DF; Wu S; Wulff AS; Yang Y; Zhu D; Zhuang C; Zuidof J; Chase MW; Pires JC; Rothfels CJ; Yu J; Chen C; Chen L; Cheng S; Li J; Li R; Li X; Lu H; Ou Y; Sun X; Tan X; Tang J; Tian Z; Wang F; Wang J; Wei X; Xu X; Yan Z; Yang F; Zhong X; Zhou F; Zhu Y; Zhang Y; Ayyampalayam S; Barkman TJ; Nguyen phuong N.; Matasci N; Nelson DR; Sayyari E; Wafula EK; Walls RL; Warnow T; An H; Arrigo N; Baniaga AE; Galuska S; Jorgensen SA; Kidder TI; Kong H; LuIrving P; Marx HE; Qi X; Reardon CR; Sutherland BL; Tiley GP; Welles SR; Yu R; Zhan S; Gramzow L; Theißen G; Wong GKS Nature 2019, 574, 679–685. [DOI] [PMC free article] [PubMed] [Google Scholar]
- 2.Twyford AD Nat. Plants 2018, 4, 312–313. [DOI] [PubMed] [Google Scholar]
- 3.Goodstein DM; Shu S; Howson R; Neupane R; Hayes RD; Fazo J; Mitros T; Dirks W; Hellsten U; Putnam N; Rokhsar DS Nucleic Acids Res. 2012, 40, D1178–D1186. [DOI] [PMC free article] [PubMed] [Google Scholar]
- 4.Shelenkov AA; Slavokhotova AA; Odintsova TI Biochem. Moscow 2018, 83, 1424–1432. [DOI] [PubMed] [Google Scholar]
- 5.Shelenkov A; Slavokhotova A; Odintsova T Antibiotics 2020, 9, 60. [DOI] [PMC free article] [PubMed] [Google Scholar]
- 6.Silverstein KAT; Moskal WA; Wu HC; Underwood BA; Graham MA; Town CD; VandenBosch KA Plant J. 2007, 51, 262–280. [DOI] [PubMed] [Google Scholar]
- 7.Zhou P; Silverstein KAT; Gao L; Walton JD; Nallu S; Guhlin J; Young ND BMC Bioinformatics 2013, 14, 335. [DOI] [PMC free article] [PubMed] [Google Scholar]
- 8.Mohimani H; Pevzner PA Nat. Prod. Rep 2016, 33, 73–86. [DOI] [PMC free article] [PubMed] [Google Scholar]
- 9.Toby TK; Fornelli L; Kelleher NL Annu. Rev. Anal. Chem 2016, 9, 499–519. [DOI] [PMC free article] [PubMed] [Google Scholar]
- 10.Zhang Y; Fonslow BR; Shan B; Baek MC; Yates JR Chem. Rev 2013, 113, 2343–2394. [DOI] [PMC free article] [PubMed] [Google Scholar]
- 11.Peter K; Gandhi P Egypt. J. Basic Appl. Sci 2017, 4, 196–205. [Google Scholar]
- 12.Chopra RN; Nayar SL; Chopra IC; Asolkar LV; Kakkar KK; Chakre OJ; Varma BS Glossary of Indian Medicinal Plants; Council of Scientific & Industrial Research: New Delhi, 1956. [Google Scholar]
- 13.Srivastava R Pharm Innov. 2017, 6, 124–129. [Google Scholar]
- 14.Moyer TB; Heil LR; Kirkpatrick CL; Goldfarb D; Lefever WA; Parsley NC; Wommack AJ; Hicks LM J. Nat. Prod 2019, 82, 2744–2753. [DOI] [PMC free article] [PubMed] [Google Scholar]
- 15.Bihani GV; Bodhankar SL; Kadam PP; Zambare GN Der Pharm. Lett 2013, 5, 48–55. [Google Scholar]
- 16.Devaraj VC J. Chin. Integr. Med 2011, 9, 1031–1038. [DOI] [PubMed] [Google Scholar]
- 17.Al-Dosari MS Am. J. Chin. Med 2010, 38, 1051–1064. [DOI] [PubMed] [Google Scholar]
- 18.Rahmatullah M; Hosain M; Rahman S; Akter M; Rahman F; Rehana F; Munmun M; Kalpana MA Afri. J.Trad. Complement. Altern. Med 2013, 10, 408–411. [PMC free article] [PubMed] [Google Scholar]
- 19.Amornrit W; Santiyanont R Genet. Mol. Res 2016, 15, gmr7562. [DOI] [PubMed] [Google Scholar]
- 20.Moyer TB; Heil LR; Kirkpatrick CL; Goldfarb D; Lefever WA; Parsley NC; Wommack AJ; Hicks LM J. Nat. Prod 2019, 82, 2744–2753. [DOI] [PMC free article] [PubMed] [Google Scholar]
- 21.Pribylova R; Kralik P; Pisarikova B; Pavlik I Biologia. 2008, 63, 217–220. [Google Scholar]
- 22.Broekaert WF; Mariën W; Terras FRG; De Bolle MFC; Proost P; Van Damme J; Dillen L; Claeys M; Rees SB; Vanderleyden J; Cammue BPA Biochemistry 1992, 31, 4308–4314. [DOI] [PubMed] [Google Scholar]
- 23.Nawrot R; Barylski J; Nowicki G; Broniarczyk J; Buchwald W; GoździckaJózefiak A Folia Microbiol. 2014, 59, 181–196. [DOI] [PMC free article] [PubMed] [Google Scholar]
- 24.Nahirñak V; Almasia NI; Hopp HE; Vazquez-Rovere C Plant Signal. Behav 2012, 7, 1004–1008. [DOI] [PMC free article] [PubMed] [Google Scholar]
- 25.Almagro Armenteros JJ; Tsirigos KD; Sønderby CK; Petersen TN; Winther O; Brunak S; von Heijne G; Nielsen H Nat. Biotechnol 2019, 37, 420–423. [DOI] [PubMed] [Google Scholar]
- 26.Wang G; Li X; Wang Z Nucleic Acids Res. 2016, 44, D1087–1093. [DOI] [PMC free article] [PubMed] [Google Scholar]
- 27.Madeira F; Park YM; Lee J; Buso N; Gur T; Madhusoodanan N; Basutkar P; Tivey ARN; Potter SC; Finn RD; Lopez R Nucleic Acids Res. 2019, 47, W636–W641. [DOI] [PMC free article] [PubMed] [Google Scholar]
- 28.Tam JP; Wang S; Wong KH; Tan WL Pharmaceuticals 2015, 8, 711–757. [DOI] [PMC free article] [PubMed] [Google Scholar]
- 29.Vriens K; Cammue BPA; Thevissen K Molecules 2014, 19, 12280–12303. [DOI] [PMC free article] [PubMed] [Google Scholar]
- 30.Goyal RK; Mattoo AK In Host Defense Peptides and Their Potential as Therapeutic Agents; Epand RM, Ed.; Springer International Publishing: Cham, Switzerland, 2016; pp 111–136. [Google Scholar]
- 31.Sagaram US; Pandurangi R; Kaur J; Smith TJ; Shah DM PLoS One 2011, 6, e18550. [DOI] [PMC free article] [PubMed] [Google Scholar]
- 32.Yount NY; Yeaman MR Proc. Natl. Acad. Sci. U. S. A 2004, 101, 7363–7368. [DOI] [PMC free article] [PubMed] [Google Scholar]
- 33.Edstam MM; Viitanen L; Salminen TA; Edqvist J Mol. Plant 2011, 4, 947–964. [DOI] [PubMed] [Google Scholar]
- 34.Yokoyama S; Kato K; Koba A; Minami Y; Watanabe K; Yagi F Peptides 2008, 29, 2110–2117. [DOI] [PubMed] [Google Scholar]
- 35.Ge X; Chen J; Li N; Lin Y; Sun C; Cao KJ Biochem. Mol. Biol 2003, 36, 603–607. [DOI] [PubMed] [Google Scholar]
- 36.Finkina EI; Melnikova DN; Bogdanov IV; Ovchinnikova TV Acta Naturae 2016, 8, 47–61. [PMC free article] [PubMed] [Google Scholar]
- 37.dos Santos-Silva CA; Zupin L; Oliveira-Lima M; Vilela LMB; Bezerra JP; Ferreira-Neto JR; Ferreira JDC; de Oliveira-Silva RL; de Pires CJ; Aburjaile FF; de Oliveira MF; Kido EA; Crovella S; Benko-Iseppon AM Bioinformat. Biol. Insights 2020, 14, 1–22. [DOI] [PMC free article] [PubMed] [Google Scholar]
- 38.Das D; Jaiswal M; Khan FN; Ahamad S; Kumar S Sci. Rep 2020, 10, 2194. [DOI] [PMC free article] [PubMed] [Google Scholar]
- 39.Islam SMA; Kearney CM; Baker EJ Sci. Rep 2018, 8, 9049. [DOI] [PMC free article] [PubMed] [Google Scholar]
- 40.Porto WF; Pires ÁS; Franco OL PLoS One 2012, 7, e51444. [DOI] [PMC free article] [PubMed] [Google Scholar]
- 41.Islam SMA; Sajed T; Kearney CM; Baker EJ BMC Bioinformatics 2015, 16, 210. [DOI] [PMC free article] [PubMed] [Google Scholar]
- 42.Vizcaíno JA; Csordas A; del-Toro N; Dianes JA; Griss J; Lavidas I; Mayer G; Perez-Riverol Y; Reisinger F; Ternent T; Xu Q-W; Wang R; Hermjakob H Nucleic Acids Res. 2016, 44, D447–D456. [DOI] [PMC free article] [PubMed] [Google Scholar]
- 43.Fleeman R; Lavoi TM; Santos RG; Morales A; Nefzi A; Welmaker GS; Medina-Franco JL; Giulianotti MA; Houghten RA; Shaw LN J. Med. Chem 2015, 58, 3340–3355. [DOI] [PMC free article] [PubMed] [Google Scholar]
- 44.Jacobs AC; Thompson MG; Black CC; Kessler JL; Clark LP; McQueary CN; Gancz HY; Corey BW; Moon JK; Si Y; Owen MT; Hallock JD; Kwak YI; Summers A; Li CZ; Rasko DA; Penwell WF; Honnold CL; Wise MC; Waterman PE; Lesho EP; Stewart RL; Actis LA; Palys TJ; Craft DW; Zurawski DV MBio 2014, 5, e01076–14. [DOI] [PMC free article] [PubMed] [Google Scholar]
- 45.Kirkpatrick CL; Broberg CA; McCool EN; Lee WJ; Chao A; McConnell EW; Pritchard DA; Hebert M; Fleeman R; Adams J; Jamil A; Madera L; Strömstedt AA; Göransson U; Liu Y; Hoskin DW; Shaw LN; Hicks LM Anal. Chem 2017, 89, 1194–1201. [DOI] [PMC free article] [PubMed] [Google Scholar]
- 46.Matasci N; Hung LH; Yan Z; Carpenter EJ; Wickett NJ; Mirarab S; Nguyen N; Warnow T; Ayyampalayam S; Barker M; Burleigh JG; Gitzendanner MA; Wafula E; Der JP; DePamphilis CW; Roure B; Philippe H; Ruhfel BR; Miles NW; Graham SW; Mathews S; Surek B; Melkonian M; Soltis DE; Soltis PS; Rothfels C; Pokorny L; Shaw JA; DeGironimo L; Stevenson DW; Villarreal JC; Chen T; Kutchan TM; Rolf M; Baucom RS; Deyholos MK; Samudrala R; Tian Z; Wu X; Sun X; Zhang Y; Wang J; Leebens-Mack J; Wong GK S. Gigascience 2014, 3, 17. [DOI] [PMC free article] [PubMed] [Google Scholar]
- 47.Afgan E; Baker D; Batut B; Van Den Beek M; Bouvier D; Ech M; Chilton J; Clements D; Coraor N; Grüning BA; Guerler A; Hillman-Jackson J; Hiltemann S; Jalili V; Rasche H; Soranzo N; Goecks J; Taylor J; Nekrutenko A; Blankenberg D Nucleic Acids Res. 2018, 46, W537–W544. [DOI] [PMC free article] [PubMed] [Google Scholar]
- 48.Brosch M; Yu L; Hubbard T; Choudhary JJ Proteome Res. 2009, 8, 3176–3181. [DOI] [PMC free article] [PubMed] [Google Scholar]
- 49.Brademan DR; Riley NM; Kwiecien NW; Coon JJ Mol. Cell. Proteomics 2019, 18, S193–S201. [DOI] [PMC free article] [PubMed] [Google Scholar]
Associated Data
This section collects any data citations, data availability statements, or supplementary materials included in this article.
Supplementary Materials
AtrProfile_SupportingInfo_2.xls: Table S1. A. tricolor database identifications
AtrProfile_SupportingInfo_1.pdf: Supporting mass spectra, Atr-LTP1 bioassays, and sample fractionation scheme.