

SUMMARY
The spinal cord contains neural networks that enable regionally distinct motor outputs along the body axis. Nevertheless, it remains unclear how segment-specific motor computations are processed because the cardinal interneuron classes that control motor neurons appear uniform at each level of the spinal cord. V2a interneurons are essential to both forelimb and hindlimb movements, and here we identify two major types that emerge during development: type I neurons marked by high Chx10 form recurrent networks with neighboring spinal neurons and type II neurons that downregulate Chx10 and project to supraspinal structures. Types I and II V2a interneurons are arrayed in counter-gradients, and this network activates different patterns of motor output at cervical and lumbar levels. Single-cell RNA sequencing (RNA-seq) revealed type I and II V2a neurons are each comprised of multiple subtypes. Our findings uncover a molecular and anatomical organization of V2a interneurons reminiscent of the orderly way motor neurons are divided into columns and pools.
In Brief
Hayashi et al. unmask a sequential process that creates V2a interneuron subtypes arrayed in counter-gradients along the spinal cord. The unique composition of V2a networks at each spinal level drives distinct activity in motor neurons controlling the forelimb and hindlimb.
INTRODUCTION
The spinal cord contains the final layer of circuitry involved in controlling motor behaviors, where descending commands and sensory inputs are integrated and transformed into behaviorally relevant patterns of motor neuron activity. Neural networks distributed along the rostrocaudal axis of the spinal cord are capable of controlling motor actions of discrete body parts, such as the forelimbs, trunk muscles, diaphragm, and hindlimbs, and these elementary networks are thought to be modulated and recruited in a context-dependent manner (Forssberg et al., 1980; Grillner, 1991; Shik and Orlovsky, 1976). The appropriate recruitment of individual body parts together forms complete motor behaviors, such as locomotion, swimming, grooming, and forelimb reaching (Grillner, 2006; Tinbergen, 1963). Although the cellular nodes underlying these ethologically relevant coordinated behaviors have begun to be identified (Alstermark et al., 2007; Azim et al., 2014; Graziano et al., 2002; Roseberry et al., 2016; Shik and Orlovsky, 1976), the network properties and molecular underpinnings that enable and endorse diverse motor outputs along the body axis remain elusive.
The sites of motor computations appear to be distributed across many areas of the CNS, making it challenging to identify the origin of body part-specific movements. Microstimulation and anatomical studies have shown that higher-level (supraspinal) circuitry contributes to the computations necessary to generate motor commands appropriate for particular body segments (Esposito et al., 2014; Graziano et al., 2002; Harrison et al., 2012; Jeffery and Fitzgerald, 1999; Ramanathan et al., 2015; Tennant et al., 2012). In addition to supraspinal structures, the spinal cord itself is a major site for computing motor actions at each level of the body (Bizzi et al., 1991; Hägglund et al., 2013; Juvin et al., 2005; Levine et al., 2014; Ruder et al., 2016). This was vividly illustrated by a series of transplantation studies in chick embryos in which brachial and lumbar spinal cord regions were switched, producing hopping chickens with left-right alternating wing movements (Narayanan and Hamburger, 1971). Although there are many possible explanations, this example illustrates that there are profound regional differences along the spinal cord, and, thus, there may be unique circuits arrayed along the rostrocaudal axis of this structure. Recent studies have shown cervically enriched propriospinal neurons communicate with supraspinal structures involved with forelimb reaching, providing further evidence for regional circuitry (Alstermark et al., 2007; Azim et al., 2014; Pivetta et al., 2014). A model that arises from these findings is that different levels of the spinal cord exhibit specialized network architectures, which may serve as the substrates for generating different motor neuron activation patterns appropriate for the muscles they control.
Numerous classes of spinal interneurons have been identified along the dorsoventral and mediolateral axes of the neural tube based on their combinatorial expression of transcription factors during development (Alaynick et al., 2011; Goulding, 2009; Jessell, 2000). Intersectional genetics has been used to uncover roles for many of these interneuron classes in motor control, thereby linking developmental lineage and neural function (Arber, 2012; Goulding, 2009; Grillner and Jessell, 2009; Kiehn, 2016). Labeling and genetic studies of motor neuron subtypes have revealed that this neuronal class is highly segmentally specialized (Landmesser, 1978; McKenna et al., 2000; Philippidou and Dasen, 2013; Romanes, 1951, 1964). Indeed, genetic manipulation of motor neuron subtype identity perturbs their connectivity and segment-specific activation patterns (Baek et al., 2017; Hinckley et al., 2015; Machado et al., 2015). Despite the diverse motor outputs the spinal cord regulates along the body axis, most classes of interneurons known to be involved in motor regulation appear to be present at all spinal levels and are viewed as repeating segmental units of circuitry extending the length of the spinal cord (Alaynick et al., 2011; Goulding, 2009; Jessell, 2000; Pivetta et al., 2014). While the richness of molecular diversity present within the cardinal classes of interneurons has begun to be uncovered (Bikoff et al., 2016; Francius et al., 2013; Gabitto et al., 2016), a major unresolved issue is to understand how the functional complexity and uniqueness of motor output patterns are generated along the body axis using reiterations of the same spinal interneurons at each level of the spinal cord.
In this study, we focused on V2a interneurons, which represent a cardinal population of excitatory interneurons within the ventral spinal cord (Al-Mosawie et al., 2007; Crone et al., 2008; Joshi et al., 2009; Kimura et al., 2006; Lundfald et al., 2007). These interneurons can be identified by their expression of the transcription factor Chx10/Vsx2 (Ericson et al., 1997; Kimura et al., 2006). V2a interneurons are present at all spinal levels, and anatomical and physiological studies have identified ascending connections to brainstem nuclei and local connections to motor neurons (Al-Mosawie et al., 2007; Azim et al., 2014; Dougherty et al., 2013; Menelaou et al., 2014; Pivetta et al., 2014; Song et al., 2016; Stepien et al., 2010). Despite the continuity of V2a interneurons along the spinal cord and their apparent embryonic homogeneity (Francius et al., 2013), functional studies indicate these interneurons control forelimbs and hindlimbs differently. Ablation of V2a interneurons affects respiration and left-right coordination of the hindlimbs (Crone et al., 2008, 2009, 2012), whereas targeted destruction of cervical V2a interneurons disrupts forelimb reaching without affecting locomotion (Azim et al., 2014; Pivetta et al., 2014). While these studies demonstrate that V2a interneurons as a population contribute to the regulation of forelimbs and hindlimbs, a comprehensive framework that links the molecular, anatomical, and functional differences within this critical interneuron population has not been established. Therefore, we examined how a well-defined cell population, V2a spinal interneurons, acquires the ability to serve as a neural substrate for controlling different motor behaviors along the body axis.
We found there are distinct V2a interneuron network infrastructures within the cervical and lumbar spinal cord that can be identified based on molecular, anatomical, and functional criteria. V2a interneurons can be divided into two major types: type I V2a interneurons with dense local connections within the spinal cord that efficiently drive motor neuron firing, and branched type II V2a interneurons with local and supraspinal projections. Gene expression analyses reveal that type I V2a interneurons maintain Chx10 expression whereas type II V2a interneurons downregulate this marker, providing a molecular tool for tracking the rostrocaudal distribution of these two cell groups that emerge during embryonic development. Although the overall number of V2a interneurons is similar at cervical and lumbar levels, the type I population is enriched within the lumbar spinal cord, and the type II subset is most prominent at cervical levels. In this way, type I and type II interneurons form a counter-gradient along the rostrocaudal axis of the spinal cord rather than localizing to specific segments. Single-cell transcriptomics revealed that both type I and type II V2a interneurons are further divided into multiple subpopulations analogous to the way motor columns are divided into motor pools. Our studies demonstrate that the V2a cardinal class of spinal interneurons progresses through multiple layers of anatomical and genetic diversification to create circuits distributed along the rostrocaudal axis that drive unique patterns of motor activity.
RESULTS
V2a Interneuron Postsynaptic Targets in Cervical and Lumbar Segments
To identify possible motor circuit differences along the rostrocaudal axis of the spinal cord, we investigated V2a interneurons because functional studies have implicated these cells in a variety of motor behaviors that are mediated by different segmental circuits (Azim et al., 2014; Crone et al., 2008, 2009, 2012; Pivetta et al., 2014; Ruder et al., 2016). However, there has not been a comprehensive comparison of V2a interneurons at different segments of the spinal cord. We indelibly labeled V2a interneurons with the fluorescent protein tdTomato (Tom) using the Cre-loxP system, where Cre was driven by the endogenous locus of the canonical V2a marker gene Chx10. We found that V2a interneurons are widely distributed in the ventral half of the spinal cord and are present in all spinal segments (Figure 1A). Given the differences in the degree of dexterity and repertoire of actions between forelimbs and hindlimbs, we focused on cervical and lumbar segments. When we analyzed the segmental distribution of V2a interneurons, we found similar numbers of Tom+ cells within cervical and lumbar segments (Figure S1A). Fluorescent in situ hybridization to detect vglut2 mRNA confirmed that all V2a interneurons are glutamatergic within both the cervical and lumbar spinal cord (Figure S1B; see also Figure S3B) (Crone et al., 2008; Lundfald et al., 2007).
Figure 1. Cervical and Lumbar V2a Interneurons Are Glutamatergic and Synapse with Ventral Spinal Targets.

(A) Chx10:Cre was crossed to ROSA-CAG:lsl:tdTomato reporter to indelibly label V2a interneurons. V2a cell bodies were found throughout the length of the spinal cord. Postnatal day (P) 0 is shown. 20-μm cryosections are shown. Scale bar, 100 μm.
(B) Chx10:Cre was crossed to ROSA-CAG:lsl:Synaptophysin-tdTomato reporter to label the presynaptic terminals of all V2a interneurons (INs).
(C and D) Synaptophysin labeling was detected throughout the entire ventral spinal cord. Numbered boxes correspond to the magnified images. Both in cervical (C) and lumbar (D) segments, NeuN+ cells, ChAT+ motor neurons, and Chx10+ V2a interneurons received inputs. Neurons in the dorsal spinal cord lacked V2a inputs (panels 3 and 6). 30-μm cryosections are shown. Scale bars, 100 and 5 μm. Magnified images are z-projections of two planes (0.5 μm).
(E) AAV1-hSyn:FLEX:tdTomato-2A-SypGFP was injected into either cervical or lumbar segments of Chx10:Cre animals to label the presynaptic terminals of local V2a interneurons. Viral injections were conducted at P2 and tissue was collected at P21.
(F and G) Both in cervical (F) and lumbar (G) segments, GFP+ V2a presynaptic terminals were detected on ChAT+ motor neurons and neighboring Chx10+ V2a interneurons in the ipsilateral cord. Numbered boxes correspond to magnified images. 50-μm cryosections are shown. Scale bar, 100 and 5 μm. Magnified images are z-projections of two planes (0.5 μm).
(H) Illustration summarizing that glutamatergic V2a interneurons project onto many types of ipsilateral ventral spinal cord neurons, including V2a interneurons (V2a), motor neurons (MN), and other ventral interneurons (vIN). This pattern of connectivity appears to be preserved at both cervical and lumbar levels.
We next surveyed the synaptic targets of V2a interneurons by genetically labeling presynaptic terminals with tdTomato-tagged synaptophysin (Syp-Tom) (Figure 1B). Syp-Tom expression recapitulated the pattern of synaptic output revealed by the excitatory presynaptic marker Vglut2 (Figure S1C), suggesting this genetic method reliably labels presynaptic terminals and is suited to globally surveying the postsynaptic targets of V2a interneurons. We observed Syp-Tom signals distributed widely throughout the ventral spinal cord within both cervical and lumbar segments (Figures 1C and 1D). Putative synaptic contacts were found on ~94% of NeuN+ somata in lamina VII–X, including ChAT+ motor neurons and Chx10+ V2a interneurons themselves (Figures 1C and 1D, insets). Interestingly, the distribution of V2a synaptic terminals obeyed a strict dorsoventral boundary, and putative synaptic contacts were found on less than 1% of interneurons in the dorsal half of the spinal cord (lamina I–V) (Figures 1C and 1D).
The global V2a synaptic target analysis provides a comprehensive view, but it obscures from which segments the synapses are derived. To characterize segment-specific synaptic targets of V2a interneurons, adeno-associated virus (AAV) expressing Cre-dependent Tom and Syp-GFP was injected into cervical or lumbar segments of Chx10:Cre neonates (Figure 1E). Within both cervical and lumbar segments containing locally labeled V2a interneurons, we observed synaptic contacts from V2a interneurons to V2a interneurons, from V2a interneurons to non-V2a interneurons, and from V2a interneurons to motor neurons within the ipsilateral ventral spinal cord (Figures 1F and 1G). Our observations show that the unifying characteristics of cervical and lumbar V2a interneurons include glutamatergic neurotransmitter identity and a broad pattern of local connections within the ventral ipsilateral spinal cord (Figure 1H) (Al-Mosawie et al., 2007; Crone et al., 2008; Dougherty and Kiehn, 2010; Kimura et al., 2006; Lundfald et al., 2007; Zhong et al., 2010).
Cervical and Lumbar V2a Interneurons Drive Different Patterns of Motor Output
To examine how the activity of V2a interneurons is integrated by motor neurons, we analyzed the properties of motor output evoked by stimulation of the V2a population. We utilized mouse genetics to express channelrhodopsin (ChR2) in V2a interneurons at reproducible levels across spinal segments. Unilateral photostimulation of V2a interneurons within cervical (C8) or lumbar (L5) spinal cord segments triggered ipsilateral motor neuron activity within the segment of stimulation (Figures 2A and 2B). Analysis of the latency and reliability of these motor responses revealed different motor activation characteristics evoked by stimulation of cervical versus lumbar V2a interneurons. Following repeated stimulations of cervical V2a interneurons (10 trials with 10-s intervals), we found that 48% ± 12% of trials evoked spiking in motor neurons. In contrast, lumbar V2a stimulation evoked motor neuron activity in all trials (100% ± 0%) (Figure 2C). Moreover, lumbar motor neuron action potentials were evoked with shorter latency than cervical motor neuron action potentials (Figure 2D).
Figure 2. Photostimulation of Cervical and Lumbar V2a Interneurons Activates Different Motor Responses.

(A) V2a interneurons in spinal cords dissected from Chx10:Cre × ROSA-CAG:lsl:ChR2-YFP mice were unilaterally photostimulated while recording motor output from ventral roots.
(B) Motor recording over 10 stimulation trials (gray) from a representative animal. An example motor response is shown in orange (cervical) or blue (lumbar). The duration of stimulation is highlighted blue.
(C) Trial reliability in evoking motor neuron spikes with V2a stimulation. 48% ± 12% (n = 12 animals, ± SEM %) of cervical stimulation trials evoked motor neuron spikes at cervical segments, whereas 100% ± 0% (n = 13 animals, ± SEM %) of lumbar stimulation trials evoked spikes at lumbar segments. Student’s t test, ***p < 0.001.
(D) Latency in evoking motor neuron spikes with V2a stimulation. Latency at cervical levels was 53.03 ± 2.93 ms (n = 9 animals, ± SEM ms), while lumbar V2a stimulation had a latency of 31.19 ± 1.83 ms (n = 13 animals, ± SEM ms). Student’s t test, ***p < 0.001.
(E) Contralateral V2a interneurons were stimulated to activate polysynaptic pathways.
(F) Cervical and lumbar ventral root motor neuron recording following contralateral V2a stimulation.
(G) Trial reliability in evoking motor neuron spikes with V2a stimulation. 3% ± 2% (n = 6 animals, ± SEM %) of cervical contralateral stimulation trials evoked motor neuron spikes, whereas 93% ± 4% (n = 6 animals, ± SEM %) of lumbar contralateral stimulation evoked spikes. Student’s t test, ***p < 0.001.
(H) Latency in evoking motor neuron spikes with V2a stimulation. Of the stimulation trials resulting in motor neuron spikes, cervical V2a stimulation had a latency of 64.29 ms (n = 2 animals), while lumbar V2a stimulation had a latency of 44.86 ± 1.87 ms (n = 6 animals, ± SEM ms).
(I) Transsynaptic viral tracing of connections between motor neurons and V2a interneurons at cervical and lumbar segments. ΔG-rabies virus expressing GFP (ΔG-Rabies:GFP) and AAV expressing glycoprotein (AAV:G) were co-injected into forelimb wrist extensor (WE) or hindlimb gastrocnemious (MG) muscles of Chx10:Cre; tdTomato animals to visualize spinal interneurons that synapse onto infected motor neurons. Injections were conducted at P0 and tissue was collected at P7.
(J–M) Spatial distribution of premotor V2a interneurons in cervical (J) and lumbar (K) segments. Contour maps revealed premotor V2a interneurons are enriched laterally (L). GFP+ neurons and GFP+tdTomato+ V2a interneurons (white arrowheads) were quantified. 2.2% ± 0.4% (n = 6 animals, ± SEM %) of forelimb premotor interneurons were V2a interneurons, whereas 4.9% ± 0.2% (n = 9 animals, ± SEM %) of hindlimb premotor interneurons were V2a interneurons (M). Student’s t test, ***p < 0.001. ChAT+ V0c interneurons represented 0.6% ± 0.1% (n = 5 animals, ± SEM %) and 0.5% ± 0.1% (n = 5 animals, ± SEM %) at cervical and lumbar segments, respectively. Student’s t test, p = 0.48. 25-μm cryosections are shown. Scale bar, 100 μm.
(N and O) Summary of motor neuron responses and connectivity with V2a interneurons. Lumbar V2a population (O) has more numerous connections with motor neurons and activates ipsilateral and contralateral motor responses more reliably than cervical V2a population (N).
To exclude the possibility that V2a interneurons contribute to motor outputs primarily with long-range intersegmental connections (Azim et al., 2014; Pivetta et al., 2014), we stimulated V2a interneurons across multiple segments while recording motor activity at C8 or L5 (Figure S2A). V2a interneurons evoked motor neuron action potentials most efficiently within the same segment, suggesting that the intrasegmental connectivity of these neurons is the most efficient pathway for motor neuron activation (Figure S2A). Next, to exclude the possibility that the distinct motor neuron responses detected at cervical and lumbar levels were due to differences in the optical recruitment of V2a interneurons, we synaptically isolated V2a interneurons (see the STAR Methods), and we found the latency and reliability of action potentials were similar at both levels (Figure S2B). To determine whether cervical spinal networks have inherent properties that make motor neurons more difficult to recruit, we measured motor responses following stimulation of dorsal glutamatergic Lmx1b interneurons. Stimulation of Lmx1b interneurons did not produce detectable differences on motor responses (Figure S2C), suggesting that these two levels share a similar capacity to generate motor activity.
V2a interneurons indirectly regulate contralateral spinal cord activity via commissural interneurons such as the V0 population (Crone et al., 2008; Lanuza et al., 2004; Talpalar et al., 2013). To assay polysynaptic motor activation by V2a interneurons, we recorded motor neuron spikes while stimulating the contralateral cervical or lumbar V2a interneurons (Figure 2E). As expected for an indirect pathway, the latency of contralateral motor activation was longer than ipsilateral activation (Figures 2D and 2H). Importantly, however, 93% ± 4% of lumbar trials evoked spikes, whereas only 3% ± 2% of cervical trials activated motor neurons (Figures 2F–2H). Dorsal glutamatergic Lmx1b interneuron stimulation produced contralateral motor neuron activity with equivalent reliability and latency at cervical and lumbar levels (Figure S2D). Together, our data show that, despite the similarities in their neurotransmitter identity and broad ventral synaptic targets, lumbar V2a interneurons drive both ipsilateral and contralateral motor neuron activity more robustly and reliably than cervical V2a interneurons (Figures 2N and 2O).
Distinct V2a Interneuron-to-Motor Neuron Connectivity at Cervical and Lumbar Segments
The differences revealed by optogenetics raised the possibility that V2a interneurons form distinct connections at cervical versus lumbar segments. To characterize the connectivity between V2a interneurons and motor neurons, we employed monosynaptic retrograde viral tracing. ΔG-rabies virus expressing GFP (ΔG-Rabies:GFP) together with AAV encoding glycoprotein (AAV:G) was injected into forelimb or hindlimb muscles (wrist extensor or gastrocnemius, respectively) of Chx10:Cre; tdTomato neonates (Figure 2I). Both cervical and lumbar limb premotor V2a interneurons were located in the lateral half of the V2a interneuron domain (Figure 2L). However, V2a interneurons (Tom+) comprised 2.2% ± 0.4% of the forelimb premotor interneurons (primarily cervical; Figures 2J and 2M), whereas 4.9% ± 0.2% of hindlimb premotor cells were V2a interneurons (primarily lumbar; Figures 2K, 2M, S2E, and S2F). Furthermore, the quantitative difference in V2a premotor interneurons at cervical versus lumbar levels was not a general feature of premotor interneurons, as the connectivity of forelimb and hindlimb premotor cholinergic V0c interneurons was similar at cervical and lumbar levels (Figure 2M). Thus, although the number of V2a interneurons is similar, the synaptic connections revealed by transsynaptic rabies labeling between V2a interneurons and motor neurons are 2-fold more abundant at spinal levels controlling the hindlimb than the forelimb (Figures 2N and 2O). Together, our data indicate that diverse functions and connectivity can indeed be encoded within a cardinal class of spinal interneurons along the rostrocaudal axis.
Cervical and Lumbar V2a Interneurons Exhibit Distinct Genetic Signatures
The anatomical and functional differences between cervical and lumbar V2a interneurons prompted us to explore whether there are molecular differences that distinguish these cells. Cervical and lumbar spinal cord segments were collected from Chx10:Cre; tdTomato mice at postnatal day (P) 0. Tom+ and Tom− cells were purified by fluorescence-activated cell sorting (FACS), and mRNA levels were quantified using next-generation RNA sequencing (Figures 3A and 3B). Principal component analysis was first used to examine global differences in gene expression among cervical V2a, cervical non-V2a, lumbar V2a, and lumbar non-V2a cells. The top two principal components accounted for 87% of the variance and were sufficient to separate these 4 populations (Figures 3B and 3C).
Figure 3. V2a Interneurons Exhibit Distinct Genetic Signatures between Cervical and Lumbar Segments.

(A) Cervical and lumbar segments were isolated from Chx10:Cre; tdTomato neonates at P0 and sorted into Tom+ and Tom− samples. Each sample consisted of cells pooled from ~5 animals. A total of three litters was used for biological replicates (n = 3).
(B) Schematic of the comparative analyses.
(C) Principal component analysis of gene profiles from V2a and non-V2a cells from cervical and lumbar segments.
(D and E) Differentially expressed genes in V2a interneurons compared to non-V2a cells in cervical (D) and lumbar (E) segments. Five transcription factors and a non-coding RNA (highlighted) were highly enriched in V2a interneurons in both segments. Cre RNA levels tracked with Chx10.
(F) Hox genes detected in cervical and lumbar V2a interneurons along the rostrocaudal axis. See also Figure S3A.
(G) Differentially expressed genes in cervical V2a compared to lumbar V2a interneurons from −6 to +6 log2 fold change. Cervical and lumbar enriched genes (p < 0.05) are highlighted in orange and blue, respectively. See also Figure S3.
To comprehensively identify genes that distinguish cervical V2a and lumbar V2a interneurons that are restricted to only V2a interneurons, we compared the transcriptomes of cervical Tom+ cells (V2a) to cervical Tom− cells (non-V2a) (Figures 3B and 3D). Likewise, we made a similar comparison of lumbar Tom+ to lumbar Tom− cells (Figures 3B and 3E). The genes highly enriched in V2a interneurons were identical at cervical and lumbar levels: Chx10/Vsx2, Sox14, Shox2, Lhx3, Lhx4, and non-coding RNA RP23–297l16.6 (Figures 3D and 3E). Despite our expectation, this analysis revealed that the genes that separate V2a interneurons from the rest of the spinal cells are shared between cervical and lumbar segments, indicating no individual genes label cervical or lumbar V2a interneurons with absolute selectivity.
We next compared the transcriptomes of cervical V2a to lumbar V2a interneurons (Figure 3B). We found 154 genes enriched in cervical V2a interneurons and 113 genes enriched in lumbar V2a interneurons (Figures S3A and S3C), showing that cervical and lumbar V2a interneurons indeed exhibit distinct genetic signatures. Although Hox genes were not restricted to V2a interneurons, they represented the most enriched genes between cervical and lumbar V2a samples (Figures 3F and S3A). Whereas major neurotransmitter synthesis, transporter, and receptor genes appeared to be expressed similarly (Figure S3B; data not shown), we unexpectedly found that the canonical V2a marker Chx10 as well as other known V2a transcription factors, Sox14 and Lhx3, were expressed at significantly higher levels in lumbar V2a interneurons relative to cervical V2a interneurons (Figure 3G).
Chx10 Differentially Labels Cervical and Lumbar V2a Interneurons
Chx10 is regarded as the canonical V2a interneuron marker gene (Ericson et al., 1997; Kimura et al., 2006). However, our transcriptome analysis indicated that Chx10 is differentially expressed by cervical and lumbar V2a interneurons (Figure 3G). We used Chx10:Cre to label V2a interneurons for gene profiling. This strategy produces indelible reporter-gene marking of V2a interneurons that becomes independent from the regulation of Chx10. Therefore, we examined whether Chx10 is dynamically regulated at a single-cell resolution to explore the possibility that this heretofore canonical marker of V2a interneurons itself can be used to reveal segmental differences among these neurons.
To characterize Chx10 levels within individual cells, we stained Tom+ V2a interneurons in Chx10:Cre; tdTomato mice with a specific antibody (Figure S4A). In neonates, ~50% of Tom+ cervical V2a interneurons expressed Chx10, whereas ~90% of lumbar V2a interneurons were Chx10+ (Figures 4A and 4B). At cervical levels, the Chx10+/Tom+ and Chx10−/Tom+ V2a interneurons were intermingled, but the greatest density of Chx10+ V2a interneurons was medial to the Chx10− cells (Figure 4C). These findings suggest that Chx10 protein status in postnatal V2a interneurons distinguishes two types, which we classified type I (Chx10+) and type II (Chx10−). These two groups are unequally distributed along the rostrocaudal axis, forming a counter-gradient with each other (Figure 4B). Within the cervical spinal cord, type I (Chx10+) and type II (Chx10−) V2a interneurons are present in similar numbers, whereas at lumbar levels most V2a interneurons are the type I class.
Figure 4. The Conventional Marker Gene Chx10 Labels V2a Types along the Rostrocaudal Axis that Emerges during Embryonic Development.
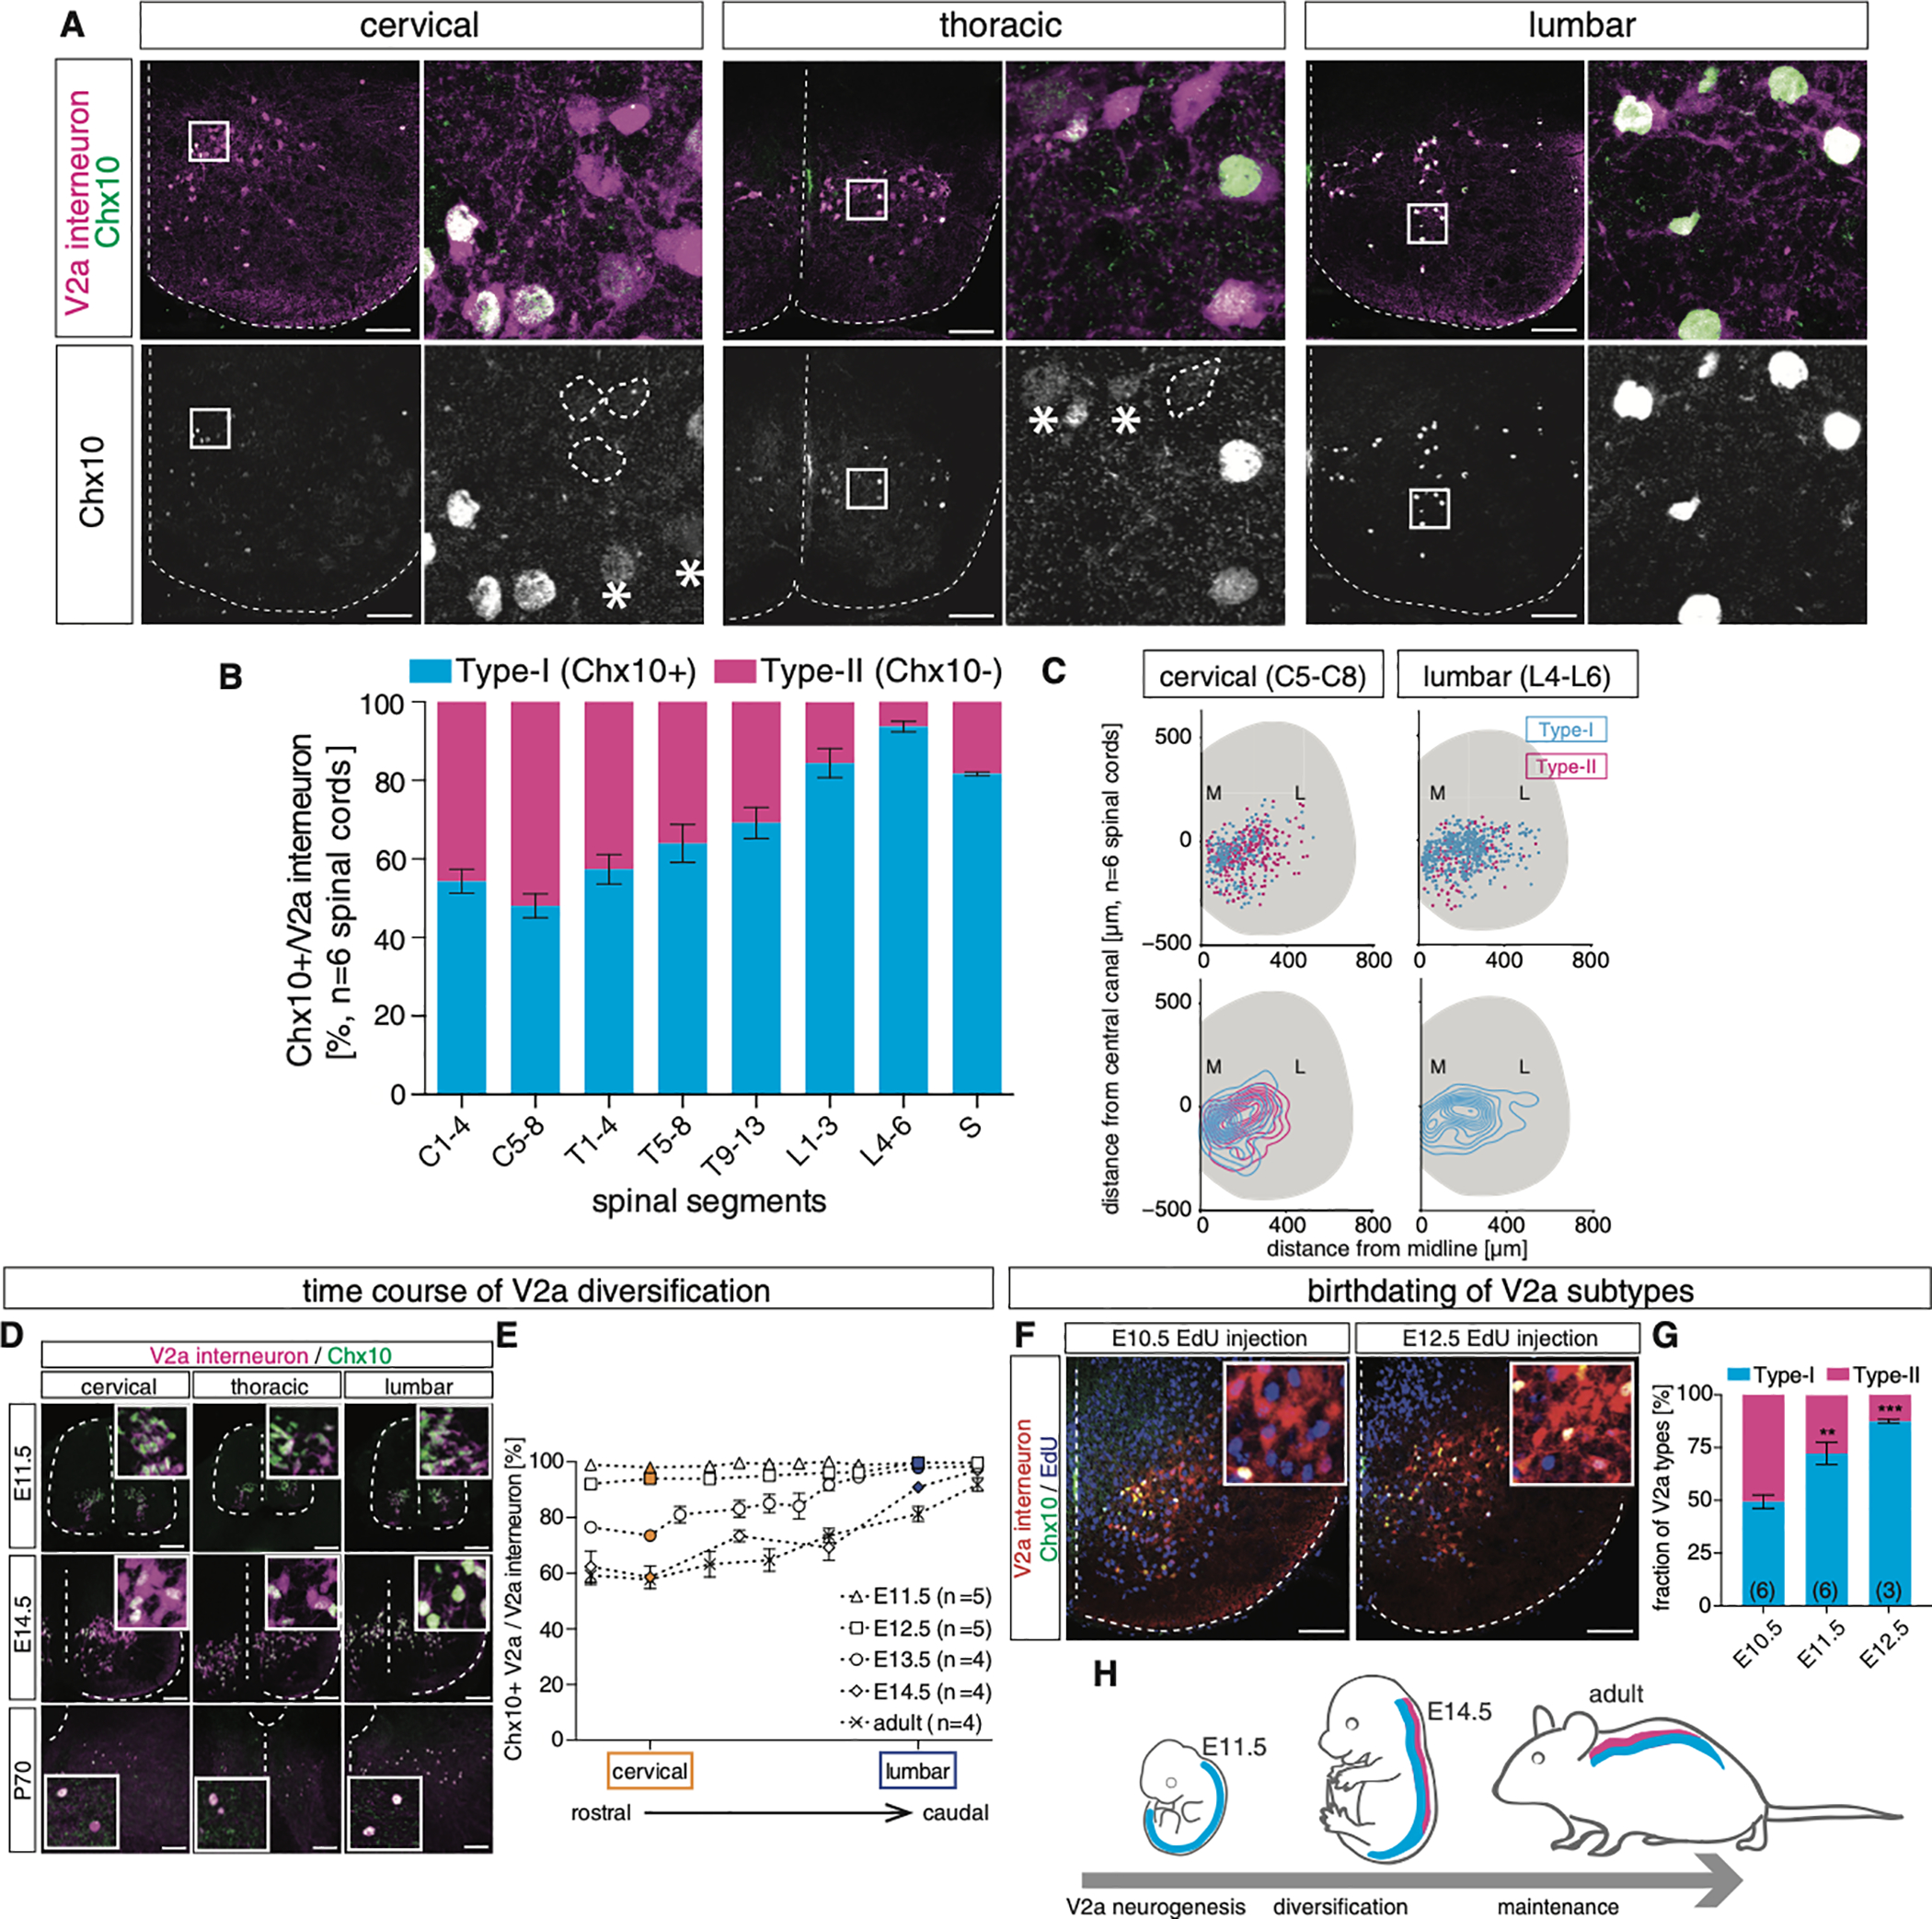
(A) Chx10 immunostaining in Chx10:Cre; tdTomato animals at P1. In cervical segments, a subset of Tom+ V2a interneurons lacked Chx10 immunostaining (dashed circles). At lumbar levels Chx10 was detected in most Tom+ V2a interneurons. Among the Chx10+ V2a interneurons, we observed signal intensity differences (asterisks indicate low Chx10). 20-μm cryosections are shown. Scale bar, 50 μm.
(B) Quantification of type I (Chx10+) and type II (Chx10−) V2a IN numbers along the rostrocaudal axis (n = 6 animals).
(C) Spatial distribution of type I (Chx10+) and type II (Chx10−) V2a interneurons in cervical and lumbar segments (n = 6 animals). Contour maps revealed medial bias for type I relative to type II.
(D) Time course of Chx10 protein expression. Chx10 immunostaining was conducted from embryonic day (E)11.5–E14.5 and P70 animals. 12-μm cryosections at E11.5 and E14.5 and 20-μm cryosections at P70 are shown. Scale bars, 50 μm at E11.5 and 14.5 and 100 μm at P70.
(E) Ratio of Chx10+ V2a interneurons along the rostrocaudal axis. Since the lengths of the spinal cords are different at different developmental stages, Foxp1 immunostaining was conducted to identify brachial/cervical and lumbar segments (data not shown).
(F and G) EdU was injected into E10.5–E13.5 pregnant females, respectively, and spinal cords were collected at P0 to identify V2a interneuron birth dates (F). Type II V2a interneurons were born at an earlier time point (G). One-way ANOVA with post hoc Dunnett’s test, E10.5 versus E11.5, **p < 0.01 and E10.5 versus E12.5, ***p < 0.001. 20-μm cryosections are shown. Scale bar, 50 μm.
(H) Summary of V2a diversification. Type I and type II interneurons emerge progressively from immature postmitotic V2a interneurons between E12.5 and E14.5, and the diversification is maintained into adulthood.
The finding that Chx10 labels two types of V2a interneurons prompted us to examine other V2a marker genes in more detail. Lhx3, Sox14, Lhx4, and Bhlhb5 were enriched in lumbar V2a interneurons and also exhibited a graded pattern along the rostrocaudal axis (Figures S4B–S4F). In contrast, Shox2 was expressed within a subset of V2a interneurons that was equally distributed (Figure S4G). Thus, multiple V2a transcription factors exhibit a graded expression pattern in addition to Chx10 (Figures S4H and S4I).
The Chx10:Cre mouse has been used to selectively target V2a interneurons for functional studies (Azim et al., 2014; Bouvier et al., 2015). To investigate the relationship between Chx10 expression and the regulation of Cre activity, we injected self-complimentary adeno associated virus (scAAV) expressing Cre-dependent GFP (i.e., reporter of Cre activity at the time of infection) into cervical segments of Chx10:Cre; tdTomato neonates (i.e., indelible reporter of V2a interneurons). Within the cervical spinal cord, we observed both type I and type II V2a interneurons labeled with GFP (Figure S4J). This finding suggests all V2a interneurons (Tom+) possess Cre activity despite the downregulation of Chx10 protein detected by immunostaining. Thus, previous functional studies using Chx10:Cre most likely perturbed the function of both V2a types (type I and type II).
Sequential Diversification of V2a Types during Embryonic Development
To address how different subpopulations of V2a interneurons arise along the rostrocaudal axis of the spinal cord, we characterized the expression of Chx10 in V2a interneurons during development. At embryonic day (E)11.5, all V2a interneurons expressed Chx10 along the rostrocaudal axis (Figures 4D and 4E). However, we observed a progressive downregulation of Chx10 in rostral segments starting at E12.5. By E14.5, ~50% of cervical V2a interneurons expressed Chx10, whereas ~90% retained Chx10 in the lumbar spinal cord (Figures 4D, 4E, and S4K). Moreover, we found that a similar rostrocaudal pattern was present in adult spinal cords, indicating that the type I (Chx10+) and type II (Chx10−) status of the V2a types is preserved in the adult spinal cord (Figures 4D and 4E). These findings suggest that an early ground state for all V2a interneurons is a Chx10+ state, followed by the progressive downregulation of Chx10 in approximately half of the cervical V2a interneurons to generate type I and type II V2a interneurons during embryonic development.
Postmitotic spinal neurons are generated from progenitors over multiple days, and the timing of neurogenesis is often correlated with the appearance of different neuronal subtypes (Jessell, 2000; Stam et al., 2012; Tripodi et al., 2011). To birth date type I (Chx10+) V2a and type II (Chx10−) V2a interneurons, thymodine analog EdU was injected into pregnant females at different developmental time points (Figure S4L). As a population, V2a neurogenesis is completed by E13.5 (Figures S4L and S4M), but type II V2a IN peak generation is at E10.5 whereas type I V2a interneurons are born from ~E10.5 to E12.5 (Figures 4F, 4G, and S4M). Taken together, our findings indicate that type II V2a interneurons are born during an early phase of V2a neurogenesis and express Chx10, which is then downregulated within days of becoming postmitotic (Figure 4H). In contrast, type I V2a interneurons are generated over a longer period of development and maintain Chx10 expression.
Type II V2a Interneurons Project Supraspinally
Given that the molecular distinction between V2a types is maintained into adulthood, we next set out to elucidate whether type I and type II V2a interneurons establish different connectivity patterns. V2a interneurons have been shown to project into the brainstem (Azim et al., 2014; Menelaou et al., 2014; Pivetta et al., 2014). To visualize V2a interneurons with ascending projections into supraspinal structures, ΔG-Rabies:GFP (alone) was unilaterally injected into the brainstem as a retrograde tracer (Figure 5A); 84.8% ± 5.6% of all rabies-labeled V2a interneurons resided within C1–8, whereas we failed to detect lumbar V2a interneurons that projected to the brainstem (Figures 5B–5D). Instead, brainstem projections from the lumbar spinal cord arose from contralateral non-V2a interneurons (Figure 5C) (Menétrey et al., 1983). Interestingly, the brainstem-projecting cervical V2a interneurons were enriched in the lateral half of the V2a domain, corresponding to the location of limb premotor V2a interneurons (Pivetta et al., 2014) (Figures 2L and 5E).
Figure 5. Type II V2a Interneurons Project Supraspinally to the Brainstem.

(A–D) DG-Rabies:GFP was injected into the brainstem of Chx10:Cre; tdTomato animals to label spinal neurons with brainstem projections. Injections were conducted at P2 and tissue was collected at P6 (A). GFP+/Tom+ V2a interneurons (B) were quantified along the rostrocaudal axis of the spinal cord. 84.8% ± 5.6% (n = 7 animals, ±SEM %) of all brainstem-projecting V2a interneurons resided within cervical segments (C). Brainstem-projecting non-V2a interneurons were found on the contralateral side of lumbar segments (asterisk) (D). 25-μm cryosections are shown. One-way ANOVA with post hoc Dunnett’s test, *p < 0.05 and **p < 0.01. Scale bar, 100 μm.
(E) Spatial distribution of brainstem-projecting V2a interneurons in cervical segments (n = 6 animals). Contour map revealed brainstem-projecting V2a interneurons are enriched laterally.
(F) Chx10 expression was monitored with immunostaining of ΔG-Rabies:GFP+/Tom+V2a interneurons. Yellow arrowheads indicate brainstem-projecting V2a interneurons without Chx10 expression. 25-μm cryosections are shown. Scale bar, 50 μm.
(G) 83% ± 5% of supraspinal-projecting V2a interneurons were the type II subtype, while 44% ± 3% of the cervical V2a interneurons in the corresponding sections were the type II subtype. n = 9 animals, ±SEM %; Student’s t test, ***p < 0.001.
We next performed viral tracing in combination with marker analysis. We found 83% ± 5% of the brainstem-projecting V2a interneurons were type II interneurons (Chx10−). Given that only 44% ± 3% of all cervical V2a interneurons in the corresponding sections were type II, the brainstem-projecting V2a labeling was strongly biased for the type II subset (Figures 5F and 5G). As a control to ensure that the infection of V2a interneurons did not cause Chx10 downregulation, we injected DG-Rabies:GFP into the cervical spinal cord and assayed Chx10 expression in randomly infected V2a interneurons. We found rabies labeled both type I V2a and type II V2a interneurons without bias, suggesting Chx10 expression was unaffected by viral infection (Figure S5A).
Previous studies have shown that cervical supraspinal V2a interneurons relay an efference copy of motor commands to the cerebellum via the lateral reticular nucleus (LRN) for error correction (Alstermark et al., 2007; Azim et al., 2014; Pivetta et al., 2014). These specialized neurons have bifurcating projections that also form direct synapses onto motor neurons. Since type II V2a interneurons project supraspinally, we investigated whether they also synapse onto motor neurons. Monosynaptic-retrograde rabies labeling from the forelimb wrist extensor revealed that 71% ± 5% of the premotor V2a interneurons were type II (Figure S5B), consistent with our observation that both cervical premotor and brainstem-projecting V2a interneurons are concentrated within the lateral domain of the V2a population (Figures 2L and 5E). Our findings indicate that type II V2a interneurons correspond to the previously identified supraspinal-projecting efference relay neurons.
scRNA-Seq Reveals Subtype Diversity in the Type I and Type II Classes
To systematically characterize the genetic differences between individual V2a interneurons, we conducted single-cell RNA sequencing (scRNA-seq) on Tom-labeled V2a interneurons from cervical and lumbar segments (Figure 6A). We processed ~3,000 Tom+ cells using Chromium Single-Cell 3’ pipeline, and we selected 949 individual neurons for further transcriptomic analyses based on quality assessment (see the STAR Methods). As expected, 99.5% of the cells expressed one or more V2a marker genes (see Figures 3D and 3E; Chx10, Sox14, Shox2, Lhx3, or Lhx4), and 92.7% expressed slc17a6 (Vglut2) consistent with their glutamatergic phenotype (Figure 6B). In addition, neither the Hb9 motor neuron nor the En1 V1 IN markers were detected, indicating accurate purification (Figure 6B).
Figure 6. Single-Cell RNA Sequencing Identifies Multiple Spatially Organized V2a Subgroups.
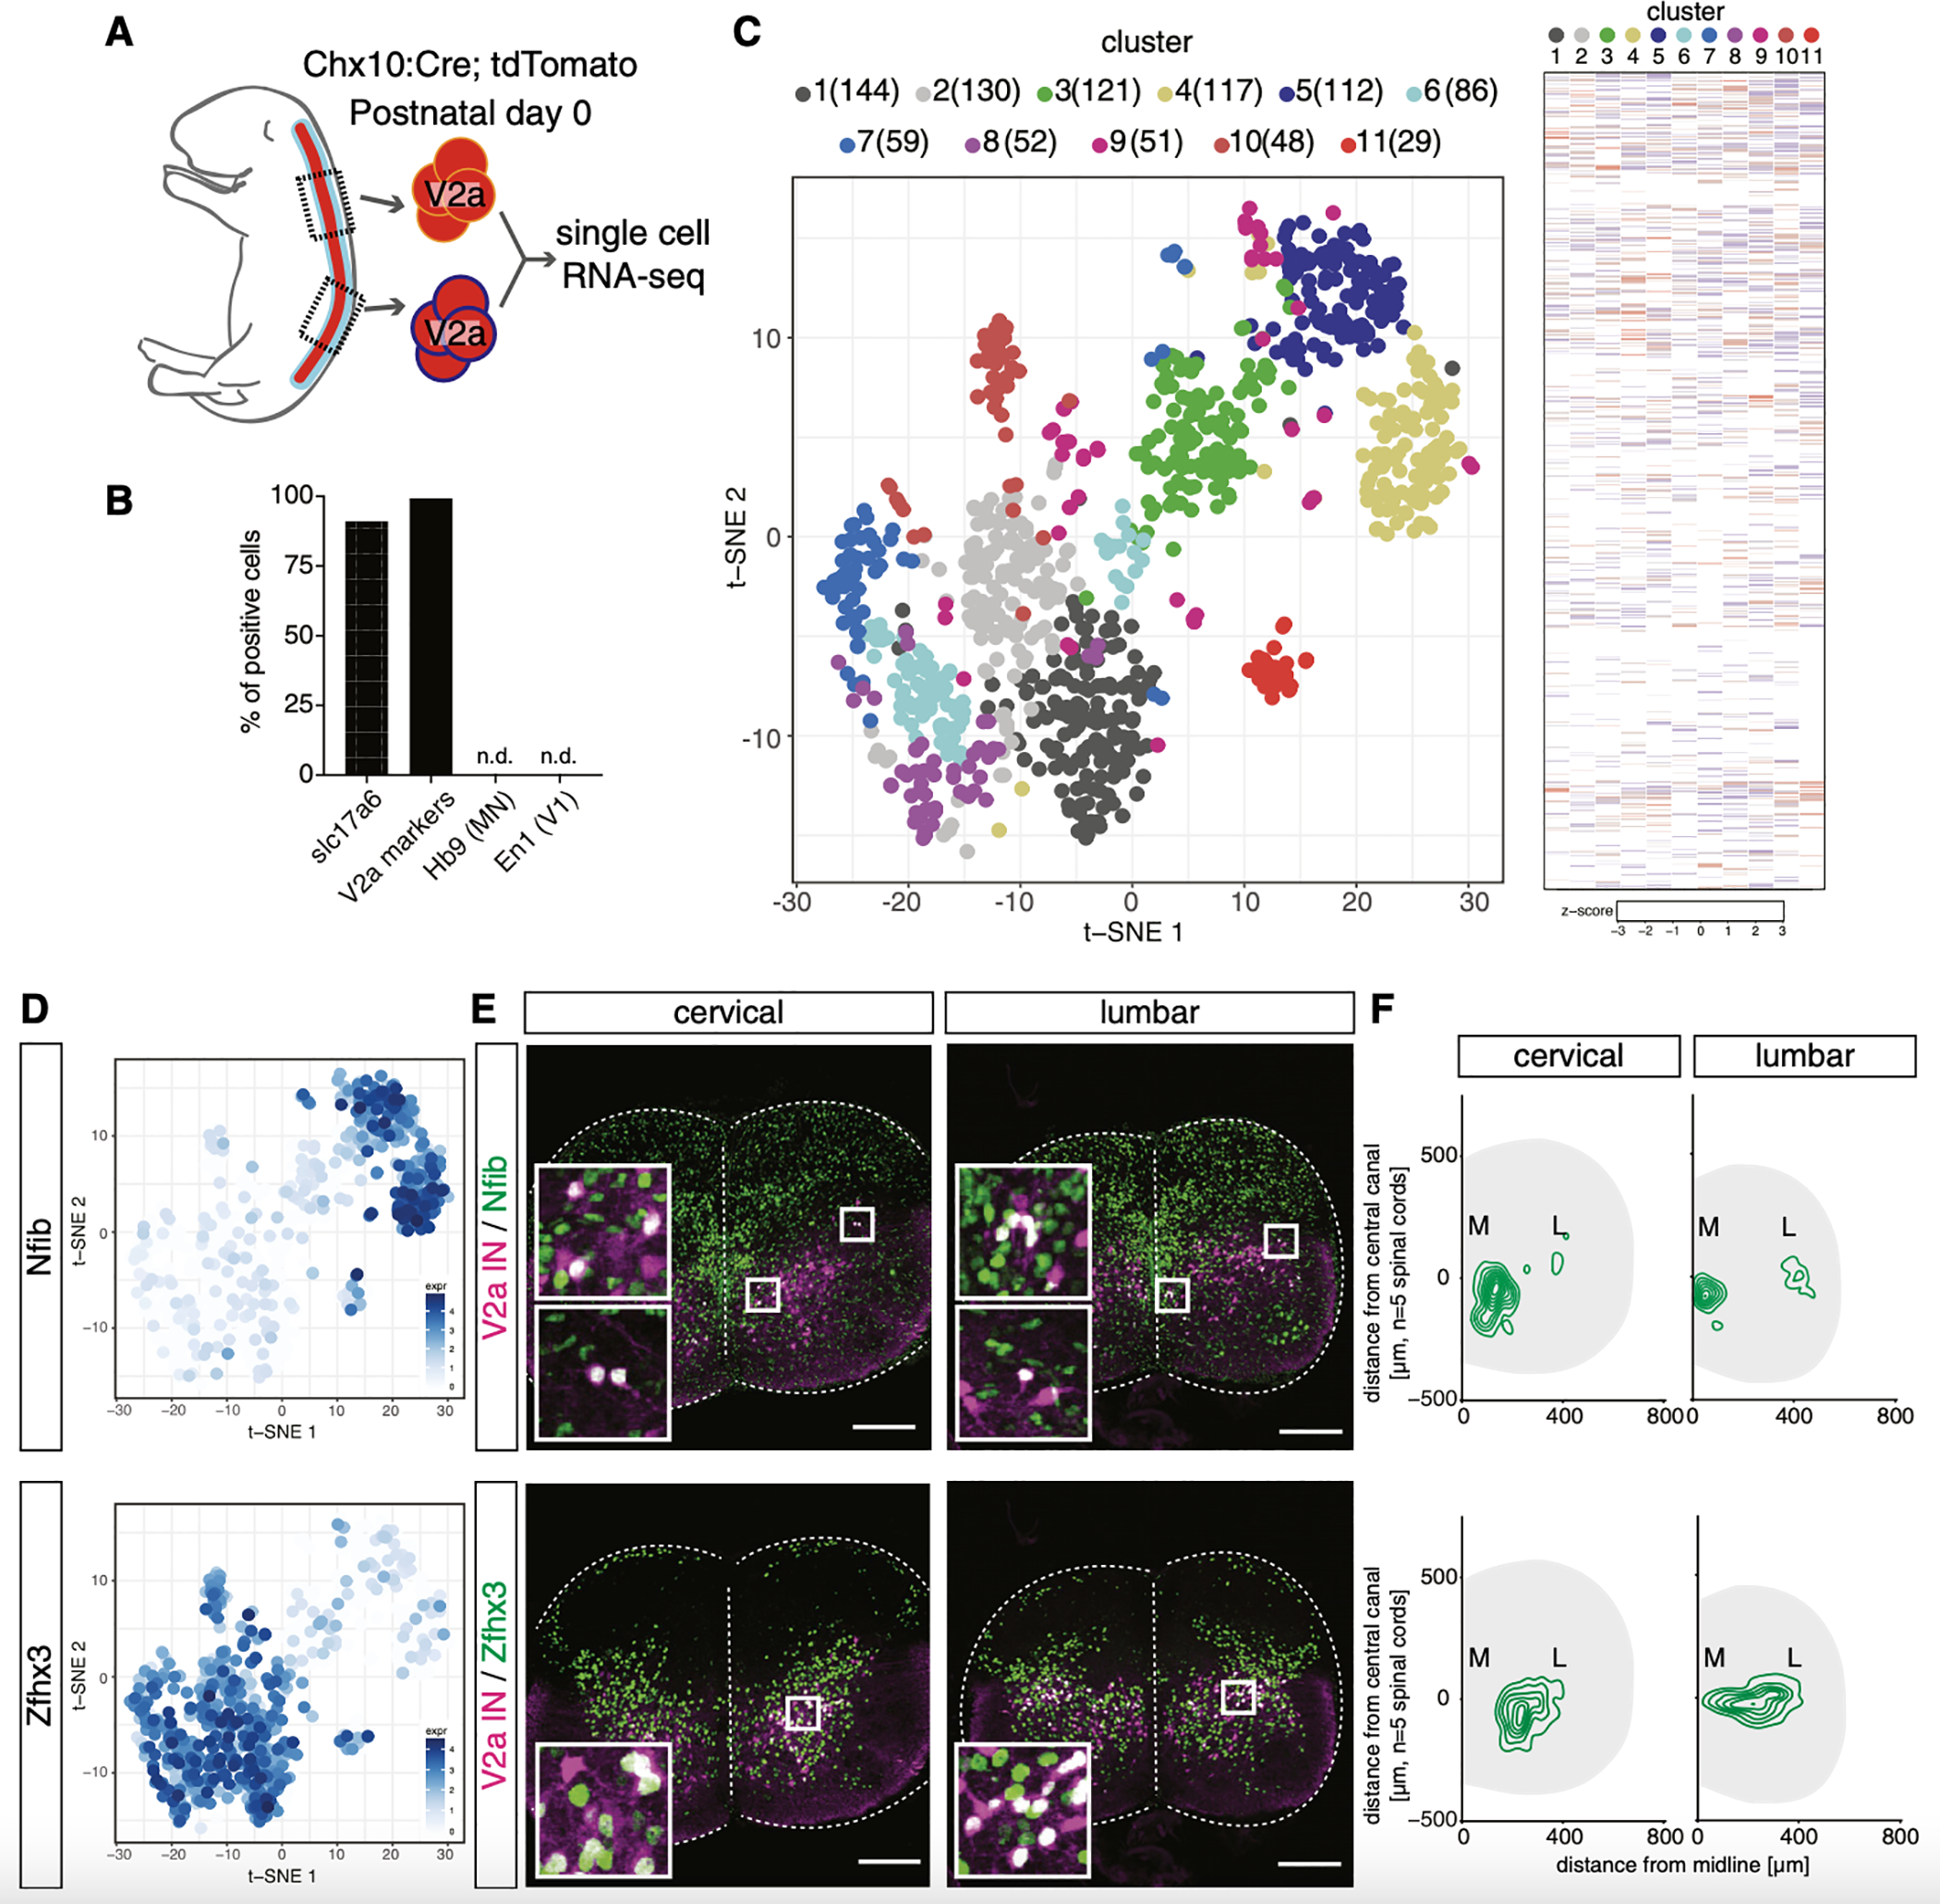
(A) Cervical and lumbar segments were isolated from two Chx10:Cre; tdTomato neonates at P0, and Tom+ cells were subjected to single-cell RNA sequencing (scRNA-seq), which produced 418,000 reads/cell and detected 12,986 genes (4,435 genes/cell, 12,349 mean unique molecular identifiers [UMIs]/cell).
(B) Slc17a6 and one or more V2a marker genes (Chx10, Sox14, Lhx3, Lhx4, and Shox2) were detected in most of the cells. Neither motor neuron (Hb9) nor V1 IN (En1) markers were detected as contaminants.
(C) Left panel: t-SNE plot showing the 11 clusters identified. Each cluster is color coded and the number of cells in each cluster is shown. Right panel: heatmap shows distinct gene expression patterns for each cluster.
(D) Cells expressing Nfib and Zfhx3 are shown with log2 scale. These two genes, among others (Figures S6A and S6B), separated V2a interneurons into two populations.
(E) Upper row: Nfib immunostaining in Chx10:Cre; tdTomato animals at P0. In cervical and lumbar segments, a subset of V2a interneurons were Nfib+ and were most concentrated toward the medial edge of the spinal cord. Lower row: Zfhx3 immunostaining is shown. At cervical and lumbar levels, a subset of V2a interneurons were Zfhx3+ and were enriched laterally. 20-μm cryosections are shown. Scale bar, 100 μm.
(F) Spatial distribution of Nfib+ (upper panel) and Zfhx3+ (lower panel) V2a interneurons in cervical and lumbar segments (n = 5 animals). Contour maps revealed medial enrichment of Nfib+ V2a and lateral enrichment of Zfhx3+ V2a.
Genome-wide comparisons identified 11 separate groupings of V2a interneurons (Figures 6A and 6C). Pairwise comparisons were used to identify genes enriched in each cluster (Figures 6C, S6A, and S6B). Cell clusters 3–5 in the upper right (UR) of the t-distributed stochastic neighbor embedding (t-SNE) plot were enriched for transcription factors Nfib, Tcf4, NeuroD2, and Sp8, whereas clusters 1, 2, 6–8, and 10 in the lower left (LL) were enriched for Zfhx3, Zfhx4, Nefl, and Shox2 (Figures 6D and S6B). We performed immunostaining with Nfib enriched in UR clusters and Zfhx3 in LL clusters to confirm their predicted expression and to map their location (Figures 6E and S6C). Interestingly, Nfib and Zfhx3 labeling revealed distinct medial and lateral columnar groups of V2a interneurons (Figures 6F and S6C). Specifically, Zfhx3+ V2a interneurons were enriched laterally and Nfib+ V2a interneurons were enriched medially (Figure 6F). We further confirmed that the V2a interneurons within clusters 3–5 corresponded to medially located V2a interneurons and the cells in clusters 1, 2, 6–8, and 10 were concentrated laterally by characterizing the expression of NeuroD2, Sp8, Zfhx4, and Shox2 (see Figures 7C–7G; data not shown).
Figure 7. Laterally Enriched V2a Subsets Drive the Rostrocaudal Diversification.

(A) Left: expression of Chx10 in log2 scale. Right: percentage composition of Chx10-high and Chx10-low V2a interneurons in each cluster is shown.
(B) Left: cervical-lumbar composition of each cluster. Right: distribution of cervical and lumbar cells in t-SNE space is shown. Clusters were color coded based on the ratio of cervical to lumbar cells.
(C) Top: Zfhx3 expression pattern and level in t-SNE plot. Middle: Zfhx3 and Chx10 immunostaining in Chx10:Cre; tdTomato animals at P0 at cervical and lumbar segments is shown. 20-μm cryosections are shown. Scale bar, 50 μm. Bottom: type I and type II V2a interneurons exhibited an extensive counter-gradient among Zfhx3+ V2a interneurons. One-way ANOVA with post hoc Dunnett’s test, cervical versus thoracic, ***p < 0.001 and cervical versus lumbar, ***p < 0.001.
(D) Top: Shox2 expression pattern and level. Middle: Shox2 and Chx10 immunostaining is shown. 20-μm cryosections are shown. Scale bar, 50 μm. Bottom: type I and type II V2a interneurons exhibited an extensive counter-gradient among Shox2+ V2a interneurons. One-way ANOVA with post hoc Dunnett’s test, cervical versus thoracic, *p < 0.05 and cervical versus lumbar, ***p < 0.001.
(E) Top: Nfib expression pattern and level. Middle: Nfib and Chx10 immunostaining is shown. 20-μm cryosections are shown. Scale bar, 50 μm. Bottom: type I and type II V2a interneurons were less graded among Nfib+ V2a interneurons. One-way ANOVA with post hoc Dunnett’s test, cervical versus thoracic, not significant (n.s.) and cervical versus lumbar, **p < 0.01.
(F) Top: NeuroD2 expression pattern and level. Middle: NeuroD2 and Chx10 immunostaining is shown. 20-μm cryosections are shown. Scale bar, 50 μm. Bottom: type I and type II V2a interneurons were less graded among NeuroD2+ V2a interneurons. One-way ANOVA with post hoc Dunnett’s test, cervical versus thoracic, n.s. and cervical versus lumbar, n.s.
(G) Top: Sp8 expression pattern and level. Middle: Sp8 and Chx10 immunostaining is shown. 20-μm cryosections are shown. Scale bar, 50 μm. Bottom: type I and type II V2a interneurons were less graded among Sp8+ V2a interneurons. One-way ANOVA with post hoc Dunnett’s test, cervical versus thoracic, n.s. and cervical versus lumbar, **p < 0.01.
(H) Model of type I and type II V2a interneuron circuit modules arrayed in a gradient along the rostrocaudal axis of the spinal cord. Type I V2a interneurons, enriched in lumbar segments, lack brainstem projections and synapse onto other ventral interneurons (vIN connections simplified in this schematic). Type II V2a interneurons, enriched in cervical segments, project to supraspinal structures, likely sending motor efference copies to the lateral reticular nucleus (LRN), which indirectly feeds back into the spinal cord through descending cortical and reticular tracts among other descending tracts (Alstermark et al., 2007; Jiang et al., 2015). Motor neurons are segmentally organized into columns and pools (gray), whereas V2a IN subtypes are distributed along the spinal cord. A counter-gradient of type I and type II V2a is positioned within a lateral domain of V2a interneurons.
Next we examined whether type I and type II interneurons represent specific cell clusters within the t-SNE plot (Figure 6C). Based on Chx10 reads, we assigned cells as high (putative type I) or low (putative type II) V2a interneurons. While Zfhx3+ lateral clusters 6–8 contained the highest fraction of Chx10-low V2a interneurons, each cluster seemed to contain both Chx10-high and Chx10-low cells (Figure 7A). We confirmed that indeed each cluster was a mixture of both type I and type II interneurons by performing immunolabeling with cell cluster markers in combination with Chx10 staining (Figures 7C–7G). These findings suggest that type I and type II V2a interneurons are each comprised of multiple genetically distinct cell groups.
To understand how cervical and lumbar V2a interneurons are represented within the t-SNE clusters, we used the overall genetic signatures for cervical and lumbar interneurons defined from bulk sequencing to assign 455 cells as cervical and 494 as lumbar (Figure S7A). We found both cervical and lumbar V2a interneurons in 10 of the 11 clusters, however, the ratio of cervical to lumbar V2a interneurons comprising each cluster varied considerably (Figure 7B). For example, Zfhx3/Zfhx4/Shox2+ clusters 6 and 8 were mostly cervical neurons; Zfhx3/Zfhx4/Shox2+ clusters 1, 2, and 10 were enriched for lumbar V2a interneurons; and Nfib/NeuroD2/Sp8+ clusters 3–5 were mixtures of cervical and lumbar V2a interneurons (Figure 7B). Using Zfhx3 and Shox2 to mark the lateral domain of V2a interneurons in combination with Chx10 to define type I/II identity, we found that the composition of the lateral V2a domain shifted from being predominately type II at cervical levels to type I at lumbar levels (Figures 7C and 7D). In contrast, the medial population of neurons expressing Nfib, NeuroD2, or Sp8 was enriched for type I neurons, and the type I/II ratio was relatively constant along the rostrocaudal axis (Figures 7E–7G). These findings indicate that the V2a interneuron subtypes arrayed within the lateral domain change along the rostrocaudal axis, whereas the composition of the medial population remains more constant (Figure 7H).
DISCUSSION
The functional diversity in forelimb and hindlimb motor control is difficult to reconcile with the simple view of the developmentally defined cardinal interneuron classes present at all spinal levels (Alaynick et al., 2011; Goulding, 2009; Grillner and Jessell, 2009). To date, a few studies have identified regionally enriched spinal neurons with marker genes (Francius et al., 2013; Hantman and Jessell, 2010; Hinckley et al., 2005; Zagoraiou et al., 2009). To address how the spinal cord accommodates the functional diversity using reiteration of the cardinal interneuron classes, we focused on the V2a interneuron population marked by the transcription factor Chx10 (Ericson et al., 1997; Kimura et al., 2006). V2a interneurons are excitatory, intersegmental ipsilaterally projecting neurons found mainly in lamina VII of the spinal cord (Al-Mosawie et al., 2007; Crone et al., 2008; Kimura et al., 2006; Lundfald et al., 2007; Peng et al., 2007). Functional studies have uncovered roles for these interneurons in behaviors ranging from forelimb food retrieval to hindlimb locomotor coordination (Azim et al., 2014; Crone et al., 2008, 2009, 2012; Pivetta et al., 2014; Song et al., 2016).
It remains unknown whether V2a interneurons have specialized attributes capable of generating distinct and instructive control over forelimb and hindlimb movements or if they have a uniform contribution to motor activity at each level of the spinal cord. In this study, we identify two major types of V2a interneurons, classified as type I and type II, that can be distinguished by their unique marker profiles and distinct connectivity patterns. Single-cell gene profiling revealed type I and II neurons are further divided into genetically distinct subtypes. Below we discuss how V2a interneuron diversification arises, and we speculate on how the different ratios of type I and type II neurons might contribute to fine dexterous control of forelimbs versus the automaticity associated with hindlimb stepping.
Characterization of Type I and Type II V2a Interneurons
There is extensive evidence for different spinal neuron classes within segments (Alaynick et al., 2011; Goulding, 2009; Jessell, 2000), but little is known about the cell type diversity across spinal segments and how this might underlie different motor neuron activation patterns for specific behaviors. Francius et al. (2013) have previously identified molecular diversity at an embryonic stage within the cardinal V1 and V3 interneuron populations distributed along the rostrocaudal axis. Here we report molecular, anatomical, and functional differences between cervical and lumbar V2a interneurons. Rabies retrograde transsynaptic labeling revealed that lumbar V2a interneurons have more connections to motor neurons and drive their activity more reliably than cervical V2a interneurons. We profiled the gene expression of purified cervical and lumbar V2a interneurons, and we unexpectedly found that Chx10, the canonical marker of these neurons, was differentially expressed. Chx10 labeling was used to identify two types of V2a interneurons that we categorized as type I and type II. Type I V2a interneurons retain high levels of Chx10 and are most abundant within the lumbar spinal cord, whereas type II V2a interneurons downregulate Chx10 after E12.5 and are most prominent in the cervical cord (Figure 7H). Type I neurons have extensive local recurrent connections but lack supraspinal projections, whereas type II neurons project rostrally into the brainstem in addition to having segmental projections. Interestingly, type I and type II V2a interneurons form an extended counter-gradient with each other along the rostrocaudal axis of the cord, rather than localizing to discrete spinal segments (Figure 7H).
We speculate that the cervically enriched type II V2a interneurons that relay efference copies of motor commands to supraspinal structures facilitate forelimb dexterity, whereas the lumbar-enriched type I V2a interneurons may contribute to greater automaticity of the hindlimbs by helping secure a strong central pattern generator activity. The graded distribution of type I relative to type II neurons within the lateral V2a column may serve as a cost-efficient means for building ratiometric circuits that generate different motor patterns along the body axis. This is supported by the observation that photostimulation of thoracic V2a interneurons drives thoracic motor neuron activity with a latency that is between cervical and lumbar V2a photostimulation (data not shown). Because V2a interneurons project across multiple segments (Menelaou et al., 2014; Ni et al., 2014; Ruder et al., 2016), thoracic V2a interneurons are also potential substrates to coordinate the contraction of thoracic muscles with limb movements in order to stabilize the body.
Molecular and Developmental Mechanisms Underlying V2a Diversification
We found that Chx10 is transiently expressed by all embryonic V2a interneurons, then downregulated in the type II subset 1–3 days after the cells become postmitotic. The generation of type I and type II V2a interneurons is analogous to motor neuron diversification in which Lhx3 is initially present in all embryonic spinal motor neurons, but subsequently it is downregulated in all subtypes except the medial motor column (Sharma et al., 1998). The overlap in Lhx3 and Chx10 (Figure S4D) combined with previous observations that ectopic expression of Lhx3 is sufficient to induce Chx10 V2a interneuron differentiation in the dorsal spinal cord (Clovis et al., 2016; Tanabe et al., 1998; Thaler et al., 2002) suggested Lhx3 might be central to the diversification process that generates type I and type II neurons. We generated transgenic mouse lines that express these Lin11-Isl1-Mec3 (LIM) homeodomain factors in a Cre-dependent fashion (tgCAG:lsl:Lhx3 and tgCAG:lsl:Lhx4). While the forced expression of Lhx3 or Lhx4 in Isl1/2+ dorsal root ganglion neurons induced ectopic Hb9+ motor neurons as predicted by the LIM code (Thaler et al., 2002), surprisingly, neither Lhx3 nor Lhx4 was sufficient to sustain Chx10 expression in type II V2a interneurons (data not shown). Our observations suggest there is a potent regulatory system within type II V2a interneurons that prevents Lhx3 and Lhx4 from sustaining Chx10 expression.
Single-cell transcript profiling revealed 11 molecularly distinct groups of V2a interneurons. Interestingly, the further diversification of type I and II neurons into individual subtypes seems to occur in parallel, because markers that label subsets of type I cells also label subsets of type II neurons. Although the V2a interneuron populations we identified do not appear to be organized segmentally like motor neurons, the divisions of V2a interneuron types and subtypes are analogous to the ordering of motor neurons into columns and pools. Like the V2a interneuron subtypes comprising the type I and II classes, motor pools within different columns frequently share expression of motor pool markers, such as the Ets transcription factors (Lin et al., 1998). Thus, both motor neurons and V2a interneurons appear to develop following a stepwise diversification plan that uses combinatorial transcription factor codes.
Spinal Neuron Diversity and the Circuitry for Elaboration of Motor Behavior
Using genes Zfhx3, Shox2, Nfib, NeuroD2, and Sp8 that further divide type I and type II V2a interneurons, we found that a group of Nfib/NeuroD2/Sp8-labeled type I interneurons was positioned medially within the spinal cord and formed a relatively continuous column of cells along the spinal cord (Figure 7H). Conversely, type I interneurons marked by Zfhx3/Shox2 were positioned more laterally and formed a counter-gradient with the type II neurons along the rostrocaudal spinal axis (Figure 7H). What might distinguish the functionality of the medial and lateral V2a interneurons? Retrograde transsynaptic labeling of axial premotor interneurons detected many that are positioned medially within lamina VII where V2a interneurons reside (see Goetz et al., 2015). We found that limb premotor V2a as well as brainstem-projecting V2a interneurons were enriched laterally. Because the composition of cervical and lumbar V2a interneuron types differs most within the lateral domain, it is possible this subgroup of V2a interneurons is optimized for differences in forelimb and hindlimb motor control, while the medial V2a column might represent an axial musculature network that is shared along the body axis.
The other cardinal classes of interneurons may also display a similar scheme of cellular complexity along the rostrocaudal axis of the spinal cord. Indeed, viral tracing studies have revealed that, in addition to V2a interneurons, many other cardinal groups of spinal interneurons at cervical segments also project into the LRN in the brainstem (Pivetta et al., 2014). As the supraspinal projections of V2a interneurons are restricted to the type II class, it raises the possibility that LRN projections arise from analogous subtypes among the other cardinal interneuron groups. Furthermore, most of the genes enriched in the 11 V2a subtypes defined by scRNA-seq are also expressed in other interneurons. Collectively, our molecular, anatomical, and functional data of V2a interneurons reveal neural substrates and organizational principles for a key cell group known to underlie forelimb and hindlimb motor control, and they provide a foundation for further understanding the organizational logic of neuronal diversity in the spinal cord.
STAR⋆METHODS
CONTACT FOR REAGENT AND RESOURCE SHARING
Further information and requests for resources and reagents should be directed to and will be fulfilled by the Lead Contact, Samuel Pfaff (pfaff@salk.edu).
EXPERIMENTAL MODEL AND SUBJECT DETAILS
Mice Lines
The following strains of mice were used: ROSA-CAG:lsl:tdTomato (JAX, Ai9: 007909, Ai14: 007908), ROSA-CAG:lsl:Synaptophysin-tdTomato (JAX, Ai34D: 012570), ROSA-CAG:lsl:ChR2-EYFP (JAX, Ai32: 012569), Chx10:Cre (Azim et al., 2014; Bouvier et al., 2015), Lmx1b:Cre (provided by R. Johnson, University of Texas MD Anderson Cancer Center, (Hilde et al., 2016)).
All mice were immune competent, SFP free, handled and housed in accordance with IACUC and AAALAC guidelines of the Salk Institute for Biological Studies. Mouse lines obtained from the JAX laboratory were maintained in a C57BL/6J background, and all other lines were maintained in a CB6F1/J background. For histological studies, E11-P70 male and female mice were used. For optogenetic studies, P2-P4 male and female mice were used. For bulk and scRNA-seq studies, P0 male and female mice were used.
We occasionally saw animals with ubiquitous expression of tdTomato or ChR2-YFP when crossed with Chx10:Cre mice (~5%–10% of the animals, regardless of maternal or paternal origin). These animals were excluded from the experiments.
METHOD DETAILS
Viral injections and tracing
AAV1-hSyn:FLEX: tdTomato-2A-SypGFP (Addgene: #51509, 9×10^11GC/mL) and scAAV1-hSyn:FLEX:GFP (5×10^12 GC/mL) were generated at GT3 core at Salk Institute. AAV6-Ef1a:G (1×10^13 GC/mL) was generated at Applied Viromics.
For the transsynaptic rabies labeling, AAV:G and rabies were mixed 4:1 immediately before injection. Injections were performed at P0 or P1 by anesthetizing pups on ice followed by single injections of 0.5–1 μL of virus into the muscle through the skin with a Hamilton syringe (see Levine et al., 2014). For the intraspinal injection of AAV or rabies virus, injections were performed at P2 by anesthetizing pups on ice, small unilaterall laminectomy, and delivering 0.25 μL of the virus using a fine glass needle and a picospritzer (see Levine et al., 2014). For the brainstem injection, ΔG-Rabies:GFP was unilaterally injected into rhombomere 8 and 9 at P2 by anesthetizing pups on ice and delivering 0.25 μL of the virus using a fine glass needle and a picospritzer. The injection site was identified using the posterior end of the developing cerebellum as a landmark (E18 and P4 reference atlas, Allen Brain Atlas).
Tissue preparation, immunohistochemistry, and imaging
Antibodies used were: Guinea pig anti-Chx10 (1:4000) (Thaler et al., 1999), Neurotrace-Alexa647 (life technologies, 1:100), Guinea pig anti-Vglut2 (Millipore, 1:3000), Rabbit anti-GFP (Lifetechnologies, 1:1,000), Goat anti-GFP (Millipore, 1:1,000), Rabbit anti-RFP (MBL, 1:1000), Rabbit anti-NeuN (Millipore, 1:1000), Rabbit anti-Lhx3 (1:5000) (Sharma et al., 1998), Rabbit anti-Lhx4 (1:5000) (Sharma et al., 1998), Guinea pig anti-Lhx3 (1:5,000) (Sharma et al., 1998), Guinea pig anti-Lhx4 (1:20,000) (Sharma et al., 1998), Guinea pig anti-Sox14 (Gift from the Lee lab, 1:2,000) (Clovis et al., 2016), Guinea pig anti-Shox2 (1:20,000, antibody raised against peptide sequence: PELKDRKDDAKGMEDEG), Rabbit anti-Shox2 (1:20,000, antibody raised against peptide sequence: PELKDRKDDAKGMEDEG), Goat anti-Bhlhb5 (Santa Cruz, 1:200), Rabbit anti-Nfib (Novus, 1:1,000), Sheep anti-Zfhx3 (Novus, 1:1,000), Rabbit anti-NeuroD2 (abcam, 1:1,000), Goat anti-Sp8 (Santa Cruz, 1:500).
Embryos were fixed with 2%–4% PFA for 60–120 min at 4°C. Postnatal spinal cords were isolated and fixed with 4% PFA for 60–120 min at 4°C. Adult mice were transcardially perfused with PBS followed by 4% PFA. Adult spinal cords were dissected out and post-fixed with 4% PFA for 90 min at 4°C. After the fixation, tissues were washed with PBS, equilibrated in 30% sucrose for 2hr – overnight at 4°C, embedded in Tissue-Tek OCT (Sakura), and subjected for cryosectioning onto glass slides (VWR). Immunohistochemistry was performed by incubating with primary antibodies (1–3 overnights, 4°C) and fluophore-conjugated secondary antibodies (1:500, 2hr, room temperature; life technologies, Jackson ImmunoResearch). Sections were mounted with VectaShield (VECTOR) and coverslipped (VWR). Images were acquired using an Olympus FV1000. Images are presented as z-projections unless otherwise noted.
Optical stimulation and electrophysiology
P2–4 spinal cords including the caudal end of the brainstem were isolated in 4°C oxygenated dissection aCSF (128 mM NaCl; 4 mM KCl; 21 mM NaHCO3; 0.5 mM NaH2PO4; 3 mM MgSO4; 30 mM d-glucose; and 1 mM CaCl2) and were transferred to oxygenated room temperature recording aCSF (128 mM NaCl; 4 mM KCl; 21 mM NaHCO3; 0.5 mM NaH2PO4; 1 mM MgSO4; 30 mM d-glucose; and 2 mM CaCl2). Suction electrodes were attached to the cervical (typically C8) or lumbar (typically L5) ventral roots, and cords were then allowed to recover and equilibrate to room temperature for ~20 min. A 20× 1.0 numerical aperture (NA) objective was used to deliver light through the dorsal surface, ipsilaterally to a region of 250 μm diameter. The illuminated area corresponds to approximately half a spinal segment at these stages. 50-ms light pulses were generated by a 200-W light source and high-speed mechanical (5 ms open time) shutter controlled by TTL signals from pclamp software.
Motor neuron responses were recorded via the ventral roots with a multiclamp 700B amplifier and filtered 300 Hz-1kHz to isolate suprathreshold responses, unless otherwise noted. Latencies to motor neuronresponses were measured offline from the onset of the stimulation. At each location, photostimulations were conducted 10 times with an interval of 10 sec.
Extracellular recordings from V2a interneurons were conducted with borosilicate glass microelectrodes filled with recording aCSF (100–500 kΩ resistance) and amplified with a multiclamp 700B amplifier as described above. The dura mater was removed from the dorsal surface of the spinal cord, and the electrodes were slowly advanced through the spinal gray matter with a motorized micromanipulator (Sutter instruments). Optical stimulations were triggered at ~25–50 μm intervals to search for low latency/jitter spike responses. Consistent with the laminar distribution of V2a interneurons, we only detected optical responses for recording sites > 250 μm from the dorsal surface. Once V2a responses were identified 10 μM CNQX and 20 μM D-APV were bath applied to isolate direct responses from V2a interneurons. In a subset of experiments we further synaptically isolated V2a interneurons with 10 μM CNQX, 20 μM D-APV, 10 μM picrotoxin and 1 μM strychnine. Following synaptic isolation we continued to record responses from optically identified V2a interneurons at ~50 μm intervals. At each location photostimulations were conducted 10 times with an interval of 10sec between stimulations. Responses were analyzed offline as described for motor neurons.
Following physiological recordings, spinal cords were fixed by immersion in 4% PFA for 2 hr for histological analysis. We occasionally saw animals with ubiquitous expression of ChR2-YFP (~5%–10% of the animals). These animals were excluded from the experiments.
Bulk RNA-seq sample preparation
Cervical and lumbar segments were dissected in aCSF, and cell dissociation was conducted using Papain following the manufacturer’s instruction (Worthington Biochemical). Via FACS (FACSDIVA or Influx, BD), cells were collected directly into Trizol (Life Technologies). 5–6 neonates at P0 were used from each litter, which typically yielded ~20K cells. ~100K Tom- cells were collected. 3 litters were used to obtain biological replicates.
Total RNA was isolated and digested with TURBO DNase (Life Technologies). An Agilent Tape Station was used to determine RNA integrity (RIN) numbers prior to library preparation. Stranded mRNA-seq libraries were prepared using the TruSeq Stranded mRNA Library Prep Kit according to the manufacturer’s instructions (Illumina). Briefly, poly-A RNA was isolated using magnetic beads conjugated to poly-T oligos. mRNA was then fragmented and reverse-transcribed into cDNA. dUTPs were incorporated, followed by second strand cDNA synthesis. dUTP-incorporated second strand was not amplified. cDNA was then end-repaired, index adaptor-ligated and PCR amplified. AMPure XP beads (Beckman Coulter) were used to purify nucleic acid after each steps of the library prep. All sequencing libraries were then quantified, pooled, and sequenced at single-end 150 base-pair using the Illumina NextSeq 500 at the Salk NGS Core. Raw sequencing data were demultiplexed and converted into FASTQ files using CASAVA (v1.8.2). Libraries were sequenced with a median depth of 37.8 million (IQR = 35.5–38.7 million).
Bulk RNA-seq analyses
TruSeq adapters were trimmed from reads. Only reads > 50bp were retained. Remaining reads were filtered, selecting for reads with > 15 average base quality. Trimming and filtering was performed with the BBMap (BBTools) package. For genome alignments, HISAT2 was used with default settings and the mm10 mouse genome release.
Gene expression quantification was performed using the following method. We aligned reads directly to transcriptome sequences (mm10 annotations from Ensembl, Refseq, UCSC and Cre sequence) using BWA (‘aln’, version 0.6.2) allowing up to 200 mapping locations per read. Reads mapped to multiple sequences were evaluated as follows. 1) if the read mapped to multiple isoforms of a single gene then the gene’s read count is incremented by 1. 2) if the read mapped to multiple genes (i.e., more than one gene locus) it is counted to each gene but scaled by 1/n^2 where ‘n’ is the number of gene loci to which the read mapped.
Differential expression testing was performed by using DESeq2, edgeR and limma/voom. The maximum post hoc corrected p value from the three programs was taken as the final p value at each gene (i.e., significant in all three programs). Each program was run in “glm” mode, and all conditions presented were included in the model. Genes were considered significant at p < 0.05.
Birthdating analysis
For each time point, EdU (20mg/kg) in saline was administered into a pregnant female via intraperitoneal injection twice with a 3hr interval (typically at 10am and 1pm of each time point). Immunostaining against Chx10 was performed first, and EdU signal was visualized using Click-iT EdU Alexa Fluor 647 imaging kit (Life Technologies) following the manufacturer’s instruction.
Single cell RNA-seq sample preparation
Cervical and lumbar segments were dissected from 2 neonates at P0 in aCSF, and cell dissociation was conducted using Papain following the manufacturer’s instruction (Worthington Biochemical) with 5% Trehalose, 50 μM APV, and 800 μM KA added during the dissociation process (Saxena et al., 2012). Via FACS (FACSDIVA, BD), 2800 cervical cells and 2800 lumbar cells were collected into 500 μL of FACS buffer (DMEM w/o Phenol Red; 1 mM EDTA; 25 mM HEPES pH 7.0; 5% FBS). Cell suspension was centrifuged and resuspended in 60 μL of FACS buffer, 33.4 μL of which was loaded onto the 10X Chromium Controller using Chromium Single Cell 3’ v2 reagents. Sequencing library was prepared following the manufacturer’s instructions (10X Genomics), with 12 cycles used for cDNA amplification and 11 cycles for library amplification. The resulting sequencing library was sequenced with Paired End reads, with a Read 1 of 26 basepairs and a Read 2 of 98 basepairs, on an Illumina HiSeq 4000 at the UCSD IGM Genomics Center. Raw sequencing data were demultiplexed using bcl2fastq v2.18.0.12.
Single cell RNA-seq analyses
To ensure the quantification of 3’ scRNA-seq data was as complete as possible, a de-novo transcriptome assembly was generated from our V2a bulk RNA-seq samples using cufflinks. Bulk RNA-seq reads were aligned to the mouse genome (mm10) with STAR and assembled individually with cufflinks. The group of assemblies and transcriptome assemblies from UCSC and refGene were then merged with cuffmerge.
ScRNA-seq reads were demultiplexed into reads per individual sequenced cell using estimates provided with the 10x Cell Ranger toolkit (10x Genomics). Reads from individual cells were mapped to the transcriptome by perfect 31-mer matching using Seal (BBTools https://jgi.doe.gov/data-and-tools/bbtools/). Alignment quality was measured by number of 31-mer matches, and reads with a single best match to a gene were assigned to that gene. Reads with multiple best matches were discarded. The frequency of each unique molecular identifier (UMI) associated with the reads mapped to a gene was counted. To account for possible sequencing errors, UMIs were further combined in a pairwise fashion based on the following rules: (1) the two UMI must differ by only a single base and (2) one of the two must have more than 2 times as many reads supporting it as the other. Additionally, any UMIs with fewer than 2 reads were discarded, and the final UMI counts for the gene were quantified from the remaining UMIs. Library size normalization factors were computed using the “scran” R package (Lun et al., 2016).
As a quality control to detect outlier cells, the quality control metrics calculated by the “scater” R package were used (https://github.com/davismcc/scater). PCA was applied and the mahalanobis distance was used to detect outliers. Additionally, in order to filter out non-V2a contaminant cells, we used k-means (with k determined using the method implemented in the “SC3” R package; Kiselev et al., 2017) to cluster genes with similar expression profiles across cells. Two gene clusters contained non-neuronal genes that specifically marked a small subset of cells and were not associated with V2a neurons. These cells were removed from further analysis.
Clustering was performed using a method that combines the approaches of two R packages: (1) SC3 and (2) ConsensusClusterPlus (Kiselev et al., 2017; Wilkerson and Hayes, 2010). We combined the two approaches by, in addition to randomly subsetting genes and cells, randomly selecting a distance measure and transform from those used in the SC3 package to further vary the clustering results.
To find genes enriched in each cell cluster, pairwise differential expression tests were performed between all clusters. For each cluster, the average fold change for genes relative to all other clusters was calculated. The number of times each gene was found significant relative to other clusters was also counted. To find the most enriched or de-enriched genes for the cluster, we established a rank based on the average fold change and the ratio of tests a gene was significant.
All differential expression tests were performed with edgeR’s glm based approach (McCarthy et al., 2012; Robinson et al., 2010). “trend.method = ‘none”’ was used when running edgeR’s dispersion estimation step as it does not work well for single cell data which usually contains numerous zero counts. Genes were accepted as significant if their post hoc corrected p values were less than 0.05.
To identify V2a interneurons from cervical or lumbar segments, using the gene clustering previously described, two gene clusters were found that specifically marked either cervical or lumbar spinal cord as we had observed in the bulk RNA-seq, including hox genes. The expression matrix was reduced down to only the genes from these gene clusters, and the cells were clustered into two groups. The group with higher expression of the cervical markers was assigned as the cervical cells and the other as the lumbar cells.
To identify type I and type II V2a interneurons, since expression of Vsx2 (Chx10) across single cells was bimodal, expectation maximization was used to predict the parameters of the bimodal distribution, which assigned V2a cells to either Vsx2-high or Vsx2-low cells.
No strategy was taken for randomization or blinding.
QUANTIFICATION AND STATISTICAL ANALYSIS
No statistical methods were used to predetermine sample sizes. No methods were used to determine whether the data met assumptions of the statistical approach. All data are presented as the mean ± SEM with n indicating the number of mice analyzed unless otherwise stated in the figure legend. Quantification of neurons was performed by analyzing 3–9 spinal cords (3–8 sections per cord/spinal region) using Olympus Fluoview and Imaris softwares. For transsynaptic rabies labeling, quantification of neurons was performed using all the cryosections containing at least 10 rabies+ neurons (forelimb injections: primarily cervical segments, hindlimb injections: primarily lumbar segments). Statistical analyses were performed using Student’s t test or one-way ANOVA with post hoc Dunnett’s test, with p values below 0.05 considered statistically significant. Prism7 software was used for statistical analyses in Figures 2, 4, 5, 7. For bulkRNA-seq and scRNA-seq, see Method Details above.
DATA AND SOFTWARE AVAILABILITY
The accession numbers for the bulkRNA-seq and scRNA-seq data reported in this paper are NIH GEO: GSE108775 and GSE108788, respectively.
Supplementary Material
KEY RESOURCES TABLE.
| REAGENT or RESOURCE | SOURCE | IDENTIFIER |
|---|---|---|
| Antibodies | ||
| Goat polyclonal anti-BHLHB5/Beta3 | Santa Cruz | Cat#sc-6045; RRID: AB_2065341 |
| Goat polyclonal anti-ChAT | Millipore | Cat#AB144P; lot#NG1915294; RRID: AB_2079751 |
| Guinea pig polyclonal anti-CHX10 | Thaler et al., 2002 | N/A |
| Goat polyclonal anti-GFP | Rockland | Cat#600–101–215; RRID: AB_218182 |
| Rabbit polyclonal anti-GFP | Life technologies | Cat#A6455; lot#1774720; RRID: AB_221570 |
| Guinea pig polyclonal anti-LHX3 | Sharma et al., 1998 | N/A |
| Rabbit polyclonal anti-LHX3 | Sharma et al., 1998 | N/A |
| Guinea pig polyclonal anti-LHX4 | Sharma et al., 1998 | N/A |
| Rabbit polyclonal anti-LHX4 | Sharma et al., 1998 | N/A |
| Rabbit polyclonal anti-NeuN | Millipore | Cat#ABN78; lot#210559; RRID: AB_10807945 |
| Rabbit polyclonal anti-RFP | MBL | Cat#PM005; lot#045; RRID: AB_591279 |
| Rabbit polyclonal anti-SHOX2 | This paper | N/A |
| Guinea pig polyclonal anti-SOX14 | Clovis et al., 2016 | N/A |
| Guinea pig polyclonal anti-VGLUT2 | Millipore | Cat#AB2251; lot#2800626; RRID: AB_2665454 |
| Rabbit polyclonal anti-Zfhx4 | Novus | Cat#NBP1–82156; lot#G105409; RRID: AB_11020060 |
| Sheep polylclonal anti-Zfhx3 | Novus | Cat#AF7384; lot#CGHE011709A; RRID: AB_11127859 |
| Goat polyclonal anti-Sp8 | Santa Cruz | Cat#sc-104661; RRID: AB_2194626 |
| Rabbit polyclonal anti-NeuroD2 | Abcam | Cat#ab104430; lot#GR3185621–1; RRID: AB_10975628 |
| Rabbit polyclonal anti-Nfib | Novus | Cat#NBP1–81000; lot#A104664; RRID: AB_11027763 |
| Donkey anti-rabbit secondary antibody, alexa488 | Life technologies | Cat#A-21206; RRID: AB_141708 |
| Donkey anti-rabbit secondary antibody, alexa568 | Life technologies | Cat#A-31572; RRID: AB_162543 |
| Donkey anti-rabbit secondary antibody, alexa647 | Life technologies | Cat#A-31573; RRID: AB_2536183 |
| Goat anti-guinea pig secondary antibody, alexa488 | Life technologies | Cat#A-11073; RRID: AB_142018 |
| Goat anti-guinea pig secondary antibody, alexa568 | Life technologies | Cat#A-11075; RRID: AB_141954 |
| Goat anti-guinea pig secondary antibody, alexa647 | Life technologies | Cat#A-21450; RRID: AB_141882 |
| Donkey anti-sheep secondary antibody, alexa488 | Life technologies | Cat#A-11015; RRID: AB_141362 |
| Donkey anti-sheep secondary antibody, alexa647 | Life technologies | Cat#A-21448; RRID: AB_2535865 |
| Donkey anti-guinea pig secondary antibody, alexa488 | Jackson Immuno | Cat#706–545–148; RRID: AB_2340472 |
| Donkey anti-guinea pig secondary antibody, alexa647 | Jackson Immuno | Cat#706–605–148; RRID: AB_2340476 |
| Bacterial and Virus Strains | ||
| AAV1-phSyn1(S):FLEX:tdTomato-T2A-SypEGFP-WPRE (titer: 9×10^11GC/mL) | Addgene | Addgene#51509 |
| AAV6-Ef1a:G (titer: 1×10^13GC/mL) | Levine et al., 2014 | N/A |
| scAAV1-hSyn:FLEX:eGFP (titer: 5×10^12GC/mL) |
This paper | N/A |
| DeltaG-Rabies:GFP (titer: 5×10^9 TU/mL) | Levine et al., 2014 | N/A |
| Chemicals, Peptides, and Recombinant Proteins | ||
| NeuroTrace deep-red | Lifetechnologies | Cat#N21483 |
| Papain dissociation kit | Worthington Biochemical | Cat#LK003150 |
| Critical Commercial Assays | ||
| EdU detection kit | Lifetechnologies | Cat#C10340 |
| Deposited Data | ||
| Raw and analyzed bulk RNA-seq | This paper | GEO:GSE108775 |
| Raw and analyzed single-cell RNA-seq | This paper | GEO:GSE108788 |
| Experimental Models: Organisms/Strains | ||
| Mouse: B6;129S-Gt(ROSA) 26Sortm34.1(CAG-Syp/tdTomato)Hze/J |
The Jackson Laboratory | JAX: 012570; RRID: IMSR_JAX:012570 |
| Mouse: B6.Cg-Gt(ROSA) 26Sortm9(CAG-tdTomato)Hze/J |
The Jackson Laboratory | JAX: 007909; RRID: IMSR_JAX:007909 |
| Mouse: B6;129S6-Gt(ROSA) 26Sortm14(CAG-tdTomato)Hze/J |
The Jackson Laboratory | JAX: 007908; RRID: IMSR_JAX:007908 |
| Mouse: B6.Cg-Gt(ROSA) 26Sortm32(CAG-COP4*H134R/EYFP)Hze/J |
The Jackson Laboratory | JAX: 024109; RRID: IMSR_JAX:024109 |
| Chx10:Cre | Azim et al., 2014 | N/A |
| Lmx1b:Cre | Hilde et al., 2016 | N/A |
| Software and Algorithms | ||
| cellranger | 10x Genomics | https://www.10xgenomics.com/software/ |
| BWA | Li and Durbin, 2009 | http://bio-bwa.sourceforge.net/ |
| BBMap (BBTools) | Brian Bushnell | https://sourceforge.net/projects/bbmap/ |
| DESeq2 | Love et al., 2014 | https://bioconductor.org/packages/release/bioc/html/DESeq2.html |
| edgeR | Robinson et al., 2010 | https://bioconductor.org/packages/release/bioc/html/edgeR.html |
| limma with voom | Law et al., 2014 | https://bioconductor.org/packages/release/bioc/html/limma.html |
Highlights.
V2a neurons drive distinct patterns of motor activity at forelimb and hindlimb levels
Type I and type II V2a neurons have distinct spinal and supraspinal connectivity
Types I and II V2a neurons are graded, not segmentally localized, along the rostrocaudal axis
Types I and II neurons are organized into multiple genetic subtypes
ACKNOWLEDGMENTS
We would like to thank K. Lettieri, M. Gullo, N. White, L. Franco, L.C. Bachmann, M.J. Sternfeld, N.D. Amin, P.J. Osseward, T. Poon, members of the Pfaff lab, the Salk GT3 core (L. Lisowski, J. Naughton, J. Marlett, R. Armendariz, and C. Ly; NIH-NCI CCSG: P30 014195, NINDS R24 Core Grant, funding from NEI), the FCCF core (C. O’Connor and C. Fitzpatrick; NIH-NCI CCSG: P30 014195), the NGS core (M. Ku; NIH-NCI CCSG: P30 014195, the Chapman Foundation and the Helmsley Charitable Trust), the Transgenic core (Y. Dayn), and UCSD IGM Genomic Center (K. Jepsen) for technical support and advice; M. Goulding and members of the Goulding lab for providing reagents and advice; S. Lee and R. Johnson for providing reagents; E. Azim for discussions and comments on the manuscript; and, S. Crone, Y. Jin, F. Polleux, M. Scanziani, and B. Zheng for discussions and advice. M.H. was supported by the Japanese Ministry of Education, Culture, Sports, Science, and Technology Long-Term Student Support Program and the Timken-Sturgis Foundation. C.A.H. was supported by the U.S. National Research Service Award Fellowship from NIH NINDS. A.J.L. was supported by the George E. Hewitt Foundation for Medical Research and Christopher and Dana Reeve Foundation. K.L.H. was supported as an NSF Graduate Research Fellow and by the Chapman Foundation. S.L.P. is supported as a Howard Hughes Medical Institute Investigator and as a Benjamin H. Lewis chair in neuroscience. This research was supported by funding from the Howard Hughes Medical Institute and the Sol Goldman Charitable Trust.
Footnotes
DECLARATION OF INTERESTS
The authors declare no competing interests.
SUPPLEMENTAL INFORMATION
Supplemental Information includes seven figures and can be found with this article online at https://doi.org/10.1016/j.neuron.2018.01.023.
REFERENCES
- Al-Mosawie A, Wilson JM, and Brownstone RM (2007). Heterogeneity of V2-derived interneurons in the adult mouse spinal cord. Eur. J. Neurosci. 26, 3003–3015. [DOI] [PubMed] [Google Scholar]
- Alaynick WA, Jessell TM, and Pfaff SL (2011). SnapShot: spinal cord development. Cell 146, 178–178.e1. [DOI] [PMC free article] [PubMed] [Google Scholar]
- Alstermark B, Isa T, Pettersson LG, and Sasaki S (2007). The C3-C4 propriospinal system in the cat and monkey: a spinal pre-motoneuronal centre for voluntary motor control. Acta Physiol. (Oxf.) 189, 123–140. [DOI] [PubMed] [Google Scholar]
- Arber S (2012). Motor circuits in action: specification, connectivity, and function. Neuron 74, 975–989. [DOI] [PubMed] [Google Scholar]
- Azim E, Jiang J, Alstermark B, and Jessell TM (2014). Skilled reaching relies on a V2a propriospinal internal copy circuit. Nature 508, 357–363. [DOI] [PMC free article] [PubMed] [Google Scholar]
- Baek M, Pivetta C, Liu J-P, Arber S, and Dasen JS (2017). Columnar-Intrinsic Cues Shape Premotor Input Specificity in Locomotor Circuits. Cell Rep. 21, 867–877. [DOI] [PMC free article] [PubMed] [Google Scholar]
- Bikoff JB, Gabitto MI, Rivard AF, Drobac E, Machado TA, Miri A, Brenner-Morton S, Famojure E, Diaz C, Alvarez FJ, et al. (2016). Spinal inhibitory interneuron diversity delineates variant motor microcircuits. Cell 165, 207–219. [DOI] [PMC free article] [PubMed] [Google Scholar]
- Bizzi E, Mussa-Ivaldi FA, and Giszter S (1991). Computations underlying the execution of movement: a biological perspective. Science 253, 287–291. [DOI] [PubMed] [Google Scholar]
- Bouvier J, Caggiano V, Leiras R, Caldeira V, Bellardita C, Balueva K, Fuchs A, and Kiehn O (2015). Descending command neurons in the brainstem that halt locomotion. Cell 163, 1191–1203. [DOI] [PMC free article] [PubMed] [Google Scholar]
- Clovis YM, Seo SY, Kwon JS, Rhee JC, Yeo S, Lee JW, Lee S, and Lee S-K (2016). Chx10 consolidates V2a interneuron identity through two distinct gene repression modes. Cell Rep. 16, 1642–1652. [DOI] [PMC free article] [PubMed] [Google Scholar]
- Crone SA, Quinlan KA, Zagoraiou L, Droho S, Restrepo CE, Lundfald L, Endo T, Setlak J, Jessell TM, Kiehn O, and Sharma K (2008). Genetic ablation of V2a ipsilateral interneurons disrupts left-right locomotor coordination in mammalian spinal cord. Neuron 60, 70–83. [DOI] [PubMed] [Google Scholar]
- Crone SA, Zhong G, Harris-Warrick R, and Sharma K (2009). In mice lacking V2a interneurons, gait depends on speed of locomotion. J. Neurosci. 29, 7098–7109. [DOI] [PMC free article] [PubMed] [Google Scholar]
- Crone SA, Viemari J-C, Droho S, Mrejeru A, Ramirez J-M, and Sharma K (2012). Irregular breathing in mice following genetic ablation of V2a neurons. J. Neurosci. 32, 7895–7906. [DOI] [PMC free article] [PubMed] [Google Scholar]
- Dougherty KJ, and Kiehn O (2010). Firing and cellular properties of V2a interneurons in the rodent spinal cord. J. Neurosci. 30, 24–37. [DOI] [PMC free article] [PubMed] [Google Scholar]
- Dougherty KJ, Zagoraiou L, Satoh D, Rozani I, Doobar S, Arber S, Jessell TM, and Kiehn O (2013). Locomotor rhythm generation linked to the output of spinal shox2 excitatory interneurons. Neuron 80, 920–933. [DOI] [PubMed] [Google Scholar]
- Ericson J, Rashbass P, Schedl A, Brenner-Morton S, Kawakami A, van Heyningen V, Jessell TM, and Briscoe J (1997). Pax6 controls progenitor cell identity and neuronal fate in response to graded Shh signaling. Cell 90, 169–180. [DOI] [PubMed] [Google Scholar]
- Esposito MS, Capelli P, and Arber S (2014). Brainstem nucleus MdV mediates skilled forelimb motor tasks. Nature 508, 351–356. [DOI] [PubMed] [Google Scholar]
- Forssberg H, Grillner S, Halbertsma J, and Rossignol S (1980). The locomotion of the low spinal cat. II. Interlimb coordination. Acta Physiol. Scand. 108, 283–295. [DOI] [PubMed] [Google Scholar]
- Francius C, Harris A, Rucchin V, Hendricks TJ, Stam FJ, Barber M, Kurek D, Grosveld FG, Pierani A, Goulding M, and Clotman F (2013). Identification of multiple subsets of ventral interneurons and differential distribution along the rostrocaudal axis of the developing spinal cord. PLoS ONE 8, e70325. [DOI] [PMC free article] [PubMed] [Google Scholar]
- Gabitto MI, Pakman A, Bikoff JB, Abbott LF, Jessell TM, and Paninski L (2016). Bayesian sparse regression analysis documents the diversity of spinal inhibitory interneurons. Cell 165, 220–233. [DOI] [PMC free article] [PubMed] [Google Scholar]
- Goetz C, Pivetta C, and Arber S (2015). Distinct limb and trunk premotor circuits establish laterality in the spinal cord. Neuron 85, 131–144. [DOI] [PubMed] [Google Scholar]
- Goulding M (2009). Circuits controlling vertebrate locomotion: moving in a new direction. Nat. Rev. Neurosci. 10, 507–518. [DOI] [PMC free article] [PubMed] [Google Scholar]
- Graziano MS, Taylor CS, and Moore T (2002). Complex movements evoked by microstimulation of precentral cortex. Neuron 34, 841–851. [DOI] [PubMed] [Google Scholar]
- Grillner S (1991). Recombination of motor pattern generators. Curr. Biol. 1, 231–233. [DOI] [PubMed] [Google Scholar]
- Grillner S (2006). Biological pattern generation: the cellular and computational logic of networks in motion. Neuron 52, 751–766. [DOI] [PubMed] [Google Scholar]
- Grillner S, and Jessell TM (2009). Measured motion: searching for simplicity in spinal locomotor networks. Curr. Opin. Neurobiol. 19, 572–586. [DOI] [PMC free article] [PubMed] [Google Scholar]
- Hägglund M, Dougherty KJ, Borgius L, Itohara S, Iwasato T, and Kiehn O (2013). Optogenetic dissection reveals multiple rhythmogenic modules underlying locomotion. Proc. Natl. Acad. Sci. USA 110, 11589–11594. [DOI] [PMC free article] [PubMed] [Google Scholar]
- Hantman AW, and Jessell TM (2010). Clarke’s column neurons as the focus of a corticospinal corollary circuit. Nat. Neurosci. 13, 1233–1239. [DOI] [PMC free article] [PubMed] [Google Scholar]
- Harrison TC, Ayling OG, and Murphy TH (2012). Distinct cortical circuit mechanisms for complex forelimb movement and motor map topography. Neuron 74, 397–409. [DOI] [PubMed] [Google Scholar]
- Hilde KL, Levine AJ, Hinckley CA, Hayashi M, Montgomery JM, Gullo M, Driscoll SP, Grosschedl R, Kohwi Y, Kohwi-Shigematsu T, and Pfaff SL (2016). Satb2 is required for the development of a spinal exteroceptive microcircuit that modulates limb position. Neuron 91, 763–776. [DOI] [PMC free article] [PubMed] [Google Scholar]
- Hinckley CA, Hartley R, Wu L, Todd A, and Ziskind-Conhaim L (2005). Locomotor-like rhythms in a genetically distinct cluster of interneurons in the mammalian spinal cord. J. Neurophysiol. 93, 1439–1449. [DOI] [PubMed] [Google Scholar]
- Hinckley CA, Alaynick WA, Gallarda BW, Hayashi M, Hilde KL, Driscoll SP, Dekker JD, Tucker HO, Sharpee TO, and Pfaff SL (2015). Spinal locomotor circuits develop using hierarchical rules based on motorneuron position and identity. Neuron 87, 1008–1021. [DOI] [PMC free article] [PubMed] [Google Scholar]
- Jeffery ND, and Fitzgerald M (1999). Lack of topographical organisation of the corticospinal tract in the cervical spinal cord of the adult rat. Brain Res. 833, 315–318. [DOI] [PubMed] [Google Scholar]
- Jessell TM (2000). Neuronal specification in the spinal cord: inductive signals and transcriptional codes. Nat. Rev. Genet. 1, 20–29. [DOI] [PubMed] [Google Scholar]
- Jiang J, Azim E, Ekerot CF, and Alstermark B (2015). Direct and indirect spino-cerebellar pathways: shared ideas but different functions in motor control. Front. Comput. Neurosci. 9, 75. [DOI] [PMC free article] [PubMed] [Google Scholar]
- Joshi K, Lee S, Lee B, Lee JW, and Lee S-K (2009). LMO4 controls the balance between excitatory and inhibitory spinal V2 interneurons. Neuron 61, 839–851. [DOI] [PMC free article] [PubMed] [Google Scholar]
- Juvin L, Simmers J, and Morin D (2005). Propriospinal circuitry underlying interlimb coordination in mammalian quadrupedal locomotion. J. Neurosci. 25, 6025–6035. [DOI] [PMC free article] [PubMed] [Google Scholar]
- Kiehn O (2016). Decoding the organization of spinal circuits that control locomotion. Nat. Rev. Neurosci. 17, 224–238. [DOI] [PMC free article] [PubMed] [Google Scholar]
- Kimura Y, Okamura Y, and Higashijima S (2006). alx, a zebrafish homolog of Chx10, marks ipsilateral descending excitatory interneurons that participate in the regulation of spinal locomotor circuits. J. Neurosci. 26, 5684–5697. [DOI] [PMC free article] [PubMed] [Google Scholar]
- Kiselev VY, Kirschner K, Schaub MT, Andrews T, Yiu A, Chandra T, Natarajan KN, Reik W, Barahona M, Green AR, and Hemberg M (2017). SC3: consensus clustering of single-cell RNA-seq data. Nat. Methods 14, 483–486. [DOI] [PMC free article] [PubMed] [Google Scholar]
- Landmesser L (1978). The distribution of motoneurones supplying chick hind limb muscles. J. Physiol. 284, 371–389. [DOI] [PMC free article] [PubMed] [Google Scholar]
- Lanuza GM, Gosgnach S, Pierani A, Jessell TM, and Goulding M (2004). Genetic identification of spinal interneurons that coordinate left-right locomotor activity necessary for walking movements. Neuron 42, 375–386. [DOI] [PubMed] [Google Scholar]
- Law CW, Chen Y, Shi W, and Smyth GK (2014). Voom: precision weights unlock linear model analysis tools for RNA-seq read counts. Genome Biology 15, R29. [DOI] [PMC free article] [PubMed] [Google Scholar]
- Levine AJ, Hinckley CA, Hilde KL, Driscoll SP, Poon TH, Montgomery JM, and Pfaff SL (2014). Identification of a cellular node for motor control pathways. Nat. Neurosci. 17, 586–593. [DOI] [PMC free article] [PubMed] [Google Scholar]
- Li H, and Durbin R (2009). Fast and accurate short read alignment with Burrows–Wheeler transform. Bioinformatics 25, 1754–1760. [DOI] [PMC free article] [PubMed] [Google Scholar]
- Lin JH, Saito T, Anderson DJ, Lance-Jones C, Jessell TM, and Arber S (1998). Functionally related motor neuron pool and muscle sensory afferent subtypes defined by coordinate ETS gene expression. Cell 95, 393–407. [DOI] [PubMed] [Google Scholar]
- Love MI, Huber W, and Anders S (2014). Moderated estimation of fold change and dispersion for RNA-seq data with DESeq2. Genome Biology 15, 550. [DOI] [PMC free article] [PubMed] [Google Scholar]
- Lun AT, Bach K, and Marioni JC (2016). Pooling across cells to normalize single-cell RNA sequencing data with many zero counts. Genome Biol. 17, 75. [DOI] [PMC free article] [PubMed] [Google Scholar]
- Lundfald L, Restrepo CE, Butt SJ, Peng CY, Droho S, Endo T, Zeilhofer HU, Sharma K, and Kiehn O (2007). Phenotype of V2-derived interneurons and their relationship to the axon guidance molecule EphA4 in the developing mouse spinal cord. Eur. J. Neurosci. 26, 2989–3002. [DOI] [PubMed] [Google Scholar]
- Machado TA, Pnevmatikakis E, Paninski L, Jessell TM, and Miri A (2015). Primacy of flexor locomotor pattern revealed by ancestral reversion of motor neuron identity. Cell 162, 338–350. [DOI] [PMC free article] [PubMed] [Google Scholar]
- McCarthy DJ, Chen Y, and Smyth GK (2012). Differential expression analysis of multifactor RNA-Seq experiments with respect to biological variation. Nucleic Acids Res. 40, 4288–4297. [DOI] [PMC free article] [PubMed] [Google Scholar]
- McKenna JE, Prusky GT, and Whishaw IQ (2000). Cervical motoneuron topography reflects the proximodistal organization of muscles and movements of the rat forelimb: a retrograde carbocyanine dye analysis. J. Comp. Neurol. 419, 286–296. [DOI] [PubMed] [Google Scholar]
- Menelaou E, VanDunk C, and McLean DL (2014). Differences in the morphology of spinal V2a neurons reflect their recruitment order during swimming in larval zebrafish. J. Comp. Neurol. 522, 1232–1248. [DOI] [PMC free article] [PubMed] [Google Scholar]
- Menétrey D, Roudier F, and Besson JM (1983). Spinal neurons reaching the lateral reticular nucleus as studied in the rat by retrograde transport of horseradish peroxidase. J. Comp. Neurol. 220, 439–452. [DOI] [PubMed] [Google Scholar]
- Narayanan CH, and Hamburger V (1971). Motility in chick embryos with substitution of lumbosacral by brachial and brachial by lumbosacral spinal cord segments. J. Exp. Zool. 178, 415–431. [DOI] [PubMed] [Google Scholar]
- Ni Y, Nawabi H, Liu X, Yang L, Miyamichi K, Tedeschi A, Xu B, Wall NR, Callaway EM, and He Z (2014). Characterization of long descending premotor propriospinal neurons in the spinal cord. J. Neurosci. 34, 9404–9417. [DOI] [PMC free article] [PubMed] [Google Scholar]
- Peng C-Y, Yajima H, Burns CE, Zon LI, Sisodia SS, Pfaff SL, and Sharma K (2007). Notch and MAML signaling drives Scl-dependent interneuron diversity in the spinal cord. Neuron 53, 813–827. [DOI] [PMC free article] [PubMed] [Google Scholar]
- Philippidou P, and Dasen JS (2013). Hox genes: choreographers in neural development, architects of circuit organization. Neuron 80, 12–34. [DOI] [PMC free article] [PubMed] [Google Scholar]
- Pivetta C, Esposito MS, Sigrist M, and Arber S (2014). Motor-circuit communication matrix from spinal cord to brainstem neurons revealed by developmental origin. Cell 156, 537–548. [DOI] [PubMed] [Google Scholar]
- Ramanathan DS, Conner JM, Anilkumar AA, and Tuszynski MH (2015). Cholinergic systems are essential for late-stage maturation and refinement of motor cortical circuits. J. Neurophysiol. 113, 1585–1597. [DOI] [PMC free article] [PubMed] [Google Scholar]
- Robinson MD, McCarthy DJ, and Smyth GK (2010). edgeR: a Bioconductor package for differential expression analysis of digital gene expression data. Bioinformatics 26, 139–140. [DOI] [PMC free article] [PubMed] [Google Scholar]
- Romanes GJ (1951). The motor cell columns of the lumbo-sacral spinal cord of the cat. J. Comp. Neurol. 94, 313–363. [DOI] [PubMed] [Google Scholar]
- Romanes GJ (1964). The motor pools of the spinal cord. Prog. Brain Res. 11, 93–119. [DOI] [PubMed] [Google Scholar]
- Roseberry TK, Lee AM, Lalive AL, Wilbrecht L, Bonci A, and Kreitzer AC (2016). Cell-type-specific control of brainstem locomotor circuits by basal ganglia. Cell 164, 526–537. [DOI] [PMC free article] [PubMed] [Google Scholar]
- Ruder L, Takeoka A, and Arber S (2016). Long-distance descending spinal neurons ensure quadrupedal locomotor stability. Neuron 92, 1063–1078. [DOI] [PubMed] [Google Scholar]
- Saxena A, Wagatsuma A, Noro Y, Kuji T, Asaka-Oba A, Watahiki A, Gurnot C, Fagiolini M, Hensch TK, and Carninci P (2012). Trehalose-enhanced isolation of neuronal sub-types from adult mouse brain. Biotechniques 52, 381–385. [DOI] [PMC free article] [PubMed] [Google Scholar]
- Sharma K, Sheng HZ, Lettieri K, Li H, Karavanov A, Potter S, Westphal H, and Pfaff SL (1998). LIM homeodomain factors Lhx3 and Lhx4 assign subtype identities for motor neurons. Cell 95, 817–828. [DOI] [PubMed] [Google Scholar]
- Shik ML, and Orlovsky GN (1976). Neurophysiology of locomotor automatism. Physiol. Rev. 56, 465–501. [DOI] [PubMed] [Google Scholar]
- Song J, Ampatzis K, Björnfors ER, and El Manira A (2016). Motor neurons control locomotor circuit function retrogradely via gap junctions. Nature 529, 399–402. [DOI] [PubMed] [Google Scholar]
- Stam FJ, Hendricks TJ, Zhang J, Geiman EJ, Francius C, Labosky PA, Clotman F, and Goulding M (2012). Renshaw cell interneuron specialization is controlled by a temporally restricted transcription factor program. Development 139, 179–190. [DOI] [PMC free article] [PubMed] [Google Scholar]
- Stepien AE, Tripodi M, and Arber S (2010). Monosynaptic rabies virus reveals premotor network organization and synaptic specificity of cholinergic partition cells. Neuron 68, 456–472. [DOI] [PubMed] [Google Scholar]
- Talpalar AE, Bouvier J, Borgius L, Fortin G, Pierani A, and Kiehn O (2013). Dual-mode operation of neuronal networks involved in left-right alternation. Nature 500, 85–88. [DOI] [PubMed] [Google Scholar]
- Tanabe Y, William C, and Jessell TM (1998). Specification of motor neuron identity by the MNR2 homeodomain protein. Cell 95, 67–80. [DOI] [PubMed] [Google Scholar]
- Tennant KA, Adkins DL, Scalco MD, Donlan NA, Asay AL, Thomas N, Kleim JA, and Jones TA (2012). Skill learning induced plasticity of motor cortical representations is time and age-dependent. Neurobiol. Learn. Mem. 98, 291–302. [DOI] [PMC free article] [PubMed] [Google Scholar]
- Thaler J, Harrison K, Sharma K, Lettieri K, Kehrl J, and Pfaff SL (1999). Active suppression of interneuron programs within developing motor neurons revealed by analysis of homeodomain factor HB9. Neuron 23, 675–687. [DOI] [PubMed] [Google Scholar]
- Thaler JP, Lee S-K, Jurata LW, Gill GN, and Pfaff SL (2002). LIM factor Lhx3 contributes to the specification of motor neuron and interneuron identity through cell-type-specific protein-protein interactions. Cell 110, 237–249. [DOI] [PubMed] [Google Scholar]
- Tinbergen N (1963). On aims and methods of ethology. Ethology 20, 410–433. [Google Scholar]
- Tripodi M, Stepien AE, and Arber S (2011). Motor antagonism exposed by spatial segregation and timing of neurogenesis. Nature 479, 61–66. [DOI] [PubMed] [Google Scholar]
- Wilkerson MD, and Hayes DN (2010). ConsensusClusterPlus: a class discovery tool with confidence assessments and item tracking. Bioinformatics 26, 1572–1573. [DOI] [PMC free article] [PubMed] [Google Scholar]
- Zagoraiou L, Akay T, Martin JF, Brownstone RM, Jessell TM, and Miles GB (2009). A cluster of cholinergic premotor interneurons modulates mouse locomotor activity. Neuron 64, 645–662. [DOI] [PMC free article] [PubMed] [Google Scholar]
- Zhong G, Droho S, Crone SA, Dietz S, Kwan AC, Webb WW, Sharma K, and Harris-Warrick RM (2010). Electrophysiological characterization of V2a interneurons and their locomotor-related activity in the neonatal mouse spinal cord. J. Neurosci. 30, 170–182. [DOI] [PMC free article] [PubMed] [Google Scholar]
Associated Data
This section collects any data citations, data availability statements, or supplementary materials included in this article.
Supplementary Materials
Data Availability Statement
The accession numbers for the bulkRNA-seq and scRNA-seq data reported in this paper are NIH GEO: GSE108775 and GSE108788, respectively.