

Short abstract
Engineered P. putida H sets a benchmark in lignin‐based PHA. Balancing the catechol degrading pathways enables improved PHA production. A DO‐stat fed‐batch process permits the efficient conversion of lignin hydrolysates into biomass and biopolymer.
Summary
Lignin‐based aromatics are attractive raw materials to derive medium‐chain length poly(3‐hydroxyalkanoates) (mcl‐PHAs), biodegradable polymers of commercial value. So far, this conversion has exclusively used the ortho‐cleavage route of Pseudomonas putida KT2440, which results in the secretion of toxic intermediates and limited performance. Pseudomonas putida H exhibits the ortho‐ and the meta‐cleavage pathways where the latter appears promising because it stoichiometrically yields higher levels of acetyl‐CoA. Here, we created a double‐mutant H‐ΔcatAΔA2 that utilizes the meta route exclusively and synthesized 30% more PHA on benzoate than the parental strain but suffered from catechol accumulation. The single deletion of the catA2 gene in the H strain provoked a slight attenuation on the enzymatic capacity of the ortho route (25%) and activation of the meta route by nearly 8‐fold, producing twice as much mcl‐PHAs compared to the wild type. Inline, the mutant H‐ΔcatA2 showed a 2‐fold increase in the intracellular malonyl‐CoA abundance – the main precursor for mcl‐PHAs synthesis. As inferred from flux simulation and enzyme activity assays, the superior performance of H‐ΔcatA2 benefited from reduced flux through the TCA cycle and malic enzyme and diminished by‐product formation. In a benzoate‐based fed‐batch, P. putida H‐ΔcatA2 achieved a PHA titre of 6.1 g l–1 and a volumetric productivity of 1.8 g l–1 day–1. Using Kraft lignin hydrolysate as feedstock, the engineered strain formed 1.4 g l‐ 1 PHA. The balancing of carbon flux between the parallel catechol‐degrading routes emerges as an important strategy to prevent intermediate accumulation and elevate mcl‐PHA production in P. putida H and, as shown here, sets the next level to derive this sustainable biopolymer from lignin hydrolysates and aromatics.
Introduction
Microbial polymers are promising alternatives to conventional petrochemical plastics (Choi et al., 2019; Becker and Wittmann, 2019, 2016). Particularly attractive biopolymers are poly(3‐hydroxyalkanoates (PHAs), accessible from renewables via microbial conversion and proven biodegradable (Castilho et al., 2009; Borrero‐de Acuña et al., 2019). More than 160 different monomers can be channelled into PHAs yielding materials with various properties. Most PHAs are thermoplastics, enabling applications as packaging materials, films, drug delivery systems and medical implants (Zhang et al., 2018).
In nature, PHAs accumulate as intracellular inclusion bodies in microbial cells under nutrient imbalances (Madison and Huisman, 1999). Among. different bacteria, strains of P. putida are metabolically versatile (Poblete‐Castro et al., 2019; Weimer et al., 2020) and most efficient in accumulating PHAs under nitrogen limitation (Prieto et al., 2016; Poblete‐Castro et al., 2020). Previous studies have achieved high PHA production in pseudomonads mostly from sugars (Poblete‐Castro, Rodriguez, et al., 2014; Borrero‐de Acuña et al., 2014; Davis et al., 2015) and sugar alcohols such as glycerol (Poblete‐Castro et al., 2014; Beckers et al., 2016; Pacheco et al., 2019; Orellana‐Saez et al., 2019). However, microbes accumulate PHAs also on aromatic substrates (Widdel and Pfennig, 1981; Nikodinovic et al., 2008) and in line, PHA production was recently demonstrated from lignin‐based compounds using P. putida KT2440 (Linger et al., 2014; Liu et al., 2017) and engineered mutant derivatives (Salvachúa et al., 2020). Although the developed Pseudomonas strains synthesized only minor PHA levels (0.25 g l–1 from lignin‐based aromatics and approximately 1 g l–1 from p‐coumarate) (Salvachúa et al., 2020), these pioneering efforts provide a seminal proof of concept. Lignin displays the second most abundant polymer on earth, is rich in aromatics, widely regarded as a waste and heavily underexploited, thus highly interesting to derive bio‐based chemicals and materials (Dietrich et al., 2019; Becker and Wittmann, 2019). Towards future industrialization of lignin‐based PHA, it appears crucial at this point to further enhance microbial production from aromatics and identify the most promising microbial strains and pathways for high PHA yield and titre.
Here, we investigated the natural phenol‐degrader P. putida H for PHA production. The H strain harbours the plasmid pPGH1 (Herrmann et al., 1987), comprising phenol degrading genes encoding for a hydroxylase, metapyrocatechase and 2‐hydroxymuconic semialdehyde dehydrogenase (Herrmann et al., 1995) along with the entire genetic machinery for assembling mcl‐PHA (Vizoso et al., 2015). Strain H displays two parallel routes for benzoate breakdown, downstream of the intermediate catechol (Fig. 1). The ortho‐pathway involves catechol 1,2‐dioxygenase (C12DO), yields succinyl‐CoA and acetyl‐CoA and is the exclusive route to degrade benzoate in P. putida KT2440 (Jiménez et al., 2002). In addition, P. putida H operates the meta pathway which involves catechol 2,3‐dioxygenase (C23DO) and forms pyruvate and acetyl‐CoA, and considering downstream action of pyruvate dehydrogenase, ultimately forms 2 acetyl‐CoA (Fig. 1A). Our knowledge regarding the contribution of the two pathways during PHA accumulation, i.e. nitrogen limitation, is rather poor. Notably, acetyl‐CoA is the starter unit to derive malonyl‐CoA, the main precursor for the synthesis of PHAs. In our study, a set of P. putida H mutants with engineered aromatic catabolism was generated and characterized in detail. The best strain P. putida H‐ΔcatA2 used simultaneously both the ortho and meta routes, achieved a PHA titre of 6.3 (g l–1) from benzoate in a fed‐batch process and surpassed previous PHA production efforts on aromatic compounds approximately six‐fold.
Fig. 1.

(A) Metabolic degradation of benzoate in Pseudomonas putida H through the parallel ortho‐ and meta‐cleavage pathways yielding different acetyl‐CoAs.
B. Genetic organization of the catabolic benzoate (ben), catechol (cat), phenol (phl) operons and their controls in P. putida H. Catechol 1,2‐dioxygenase (C12DO) and catechol 2,3‐dioxygenase (C23DO).
Results
Genomic repertoire of P. putida H to produce PHA from aromatics and construction of ortho‐cleavage pathway mutants
As inferred from the genome analysis, P. putida H harbours two chromosomal genes that encode for catechol‐1,2‐dioxygenases (C12DO) in the ortho‐cleavage pathway for the breakdown of benzoate. One gene was in the cat operon and the other one belonged to the ben operon (Fig. 1B). The alignment of amino acid sequence of the ortho‐pathway enzymes CatA and CatA2 of strain H against the homologues of P. putida KT2440 (Jiménez et al., 2002) showed 100% identity. We therefore designated them catA and catA2, as previously done for KT2440 (van Duuren et al., 2011). Besides, and different to KT2440, P. putida H harbours the plasmid‐based gene phlH, encoding a catechol‐2,3‐dioxygenase (C23DO) as the entry step of the meta pathway (Fig. 1). Different deletion strains were constructed to (i) partially and (ii) completely block the ortho route for aromatic conversion. The obtained mutants P. putida H‐ΔcatA, H‐ΔcatA2, H‐ΔcatAΔA2, lacking either one or both C12DOs were validated by PCR. The H‐ΔcatA deletion yielded a shortened fragment (1173 bp) as compared to wild type (2019 bp), when using the oligos catAUpFw/DwRv. Likewise, the fragment size for ΔcatA2 (1095 bp) was smaller than in wild type (2010 bp), using the catA2UpFw/DwRv primers. Positive clones were additionally verified by sequencing.
Growth and PHA synthesis of P. putida H ortho‐pathway mutants on benzoate
First, the growth of the single‐deletion mutants (H‐ΔcatA and H‐ΔcatA2), the double deletion mutant (H‐ΔcatAΔA2), and the parental strain H was characterized on benzoate with sufficient ammonium supply (C/N ratio 0.3 mol mol–1) (Fig. 2A). All mutants retained the maximum specific growth rate of P. putida H (Table 1). In a previous work of benzoate‐grown P. putida KT2440, carrying the TOL plasmid pWW0, inactivation of catA2 promoted the secretion of 2‐hydroxymuconic semialdehyde (2‐HMS), an intermediate of the meta route resulting in a yellowish culture broth (Jiménez et al., 2014). We did not observe such colour in any culture, including that of the corresponding H‐ΔcatA2 mutant (Fig. 2A).
Fig. 2.

A. Growth of P. putida H and its catabolic pathway mutants on 5 mM benzoate (C/N ratio 0.3 mol mol–1).
B. PHA production by the engineered P. putida H strain after 24 h cultivation (C/N ratio 4.0 mol mol–1). Values represent the mean and errors from three independent experiments. NS, not significant. P values (P> 0.05, *P < 0.05, **P < 0.001 and ***P < 0.0001).
Table 1.
Physiological parameters of P. putida H and metabolically engineered mutants grown on 5 mM benzoate and 1 g l–1 NH4Cl in shake flasks. Values represent the mean and corresponding errors from three independent experiments.
| Strain | Specific growth rate (h–1) | Biomass yield (gCDW mol–1) | Specific benzoate uptake rate (mmol gCDW –1 h–1) |
|---|---|---|---|
| P. putida H | 0.33 ± 0.01 | 67.16 ± 2.44 | 4.91 ± 0.04 |
| H‐ΔcatA | 0.35 ± 0.00 | 72.05 ± 1.22 | 4.86 ± 0.06 |
| HΔcatA2 | 0.34 ± 0.01 | 70.82 ± 2.44 | 4.80 ± 0.03 |
| H‐ΔcatAΔA2 | 0.33 ± 0.02 | 72.05 ± 1.22 | 4.52 ± 0.01 |
We then assessed the PHA production capacity of all strains by growing them on an increased ratio of benzoate to ammonium (final C/N ratio 4.0 mol mol–1) and quantified the PHA amount at 24 h cultivation in batch cultures. As shown in Fig. 2B, wild‐type P. putida H produced 0.14 g l–1 PHA under these conditions. The inactivation of the catA gene increased the amount of PHA by 50% to 0.21 g l–1. The deletion of catA2 boosted PHA synthesis even stronger to 0.24 g l–1, 70% more than the parental H strain. The double‐mutant H‐ΔcatAΔA2, however, presented an almost equal PHA level as compared to the wild type. In this case, the culture broth turned dark brownish, an indication of catechol accumulation and its oxidation and polymerization during the bioconversion process (Jiménez et al., 2014) (Fig. 2B). A slightly visible brown colour was observed for the best producer H‐ΔcatA2, whereas the cultures of wild‐type and strain H‐ΔcatA remained clear.
Next, we performed cultivations in bioreactors to study growth and production dynamics in more detail. Using the previous high benzoate to ammonium ratio, nitrogen limitation triggered PHA accumulation in later phases of the process (Fig. 3, Table 2). The single‐deletion strains H‐ΔcatA and H‐ΔcatA2 accumulated the highest level of PHA, 0.20 and 0.26 g l–1 after 24 h cultivation respectively. During cultivation, they secreted and then re‐consumed catechol and cis,cis‐muconate. The latter metabolite exclusively occurs as intermediate of the ortho route (Fig. 1), indicating that this branch was involved in catechol conversion in both strains. The strain H‐ΔcatA2 revealed a higher catechol peak, correlating to a more pronounced culture pigmentation, than the wild‐type and strain H‐ΔcatA. Interestingly, the two intermediates peaked later in H‐ΔcatA2 than in the other two strains. None of the strains accumulated 2‐HMS, suggesting a sufficient bioconversion capacity of the meta route (Fig. 3B‐C). The H‐ΔcatA2 mutant achieved the highest PHA level among all strains (Table 2). The double mutant did not accumulate cis,cis‐muconate but secreted substantial amounts of catechol. It reached a PHA titre of 0.17 g l–1, 30% more than the wild type, but significantly less than the single‐deletion strains (Table 2).
Fig. 3.

Time course of benzoate degradation and biomass, catechol, muconate, 2‐HMS and PHA synthesis by P. putida H strains (A) wild‐type, (B) H‐ΔcatA, (C) H‐ΔcatA2, (D) H‐ΔcatAΔA2 in batch bioreactors. (C/N) ratio 4 (mol mol–1). Values represent the mean and errors from two independent bioreactors.
Table 2.
Biomass synthesis, PHA concentration and monomer composition of wild‐type P. putida H and metabolically engineered strains in batch cultures using top‐bench bioreactors on 15 mM of sodium benzoate. Values represent the mean and corresponding errors from two independent experiments.
| Strain |
CDW (g l–1) |
PHA (g l–1) |
PHA (%wt) |
Monomer composition (%) a | |||
|---|---|---|---|---|---|---|---|
| C8 | C10 | C12 | C12:1 | ||||
| P. putida H | 0.79 ± 0.01 | 0.13 ± 0.00 | 16.5 ± 0.1 | 11.8 ± 0.4 | 81.2 ± 1.3 | 6.3 ± 0.4 | 0.7 ± 0.1 |
| H‐ΔcatA | 0.87 ± 0.06 | 0.20 ± 0.01 | 23.0 ± 0.4 | 9.7 ± 0.5 | 82.1 ± 1.8 | 6.8 ± 1.8 | 1.5 ± 0.1 |
| H‐ΔcatA2 | 1.00 ± 0.05 | 0.26 ± 0.01 | 26.0 ± 0.8 | 14.3 ± 1.1 | 75.3 ± 2.2 | 3.9 ± 0.1 | 6.5 ± 0.3 |
| H‐ΔcatAΔA2 | 0.86 ± 0.02 | 0.17 ± 0.00 | 19.8 ± 0.3 | 7.9 ± 0.8 | 75.6 ± 1.6 | 8.4 ± 0.3 | 8.1 ± 0.1 |
C8: 3‐hydroxyoctanoate, C10: 3‐hydroxydecanoate, C12: 3‐hydroxydodecanoate, C12:1: 3‐hydroxy‐5‐cis‐dodecanoate.
All mutants showed an interesting variation in PHA monomer composition. Whereas 3‐hydroxydecanoate (C10) generally was the major monomer (75–80%) (Table 2), all mutants revealed an increased content of carbon‐twelve building blocks as compared to the wild type. This effect was most pronounced for the double mutant, which exhibited nearly a two‐fold increase of C12:0 and C12:1 (16.5%) as compared to strain H (7.0%), while H‐ΔcatA (8.3%) and H‐ΔcatA2 (10.4%) showed values in between.
Intracellular levels of CoA thioesters in wild‐type and engineered P. putida H during growth and PHA production
The imposed growth conditions in the batch cultures revealed a two‐phase profile when grown on a high benzoate to ammonium ratio: initial growth if sufficient nitrogen was available and subsequent PHA accumulation under nitrogen limitation (Fig. 3). We thus quantified the intracellular CoA thioesters, including the PHA precursor malonyl‐CoA and its upstream intermediate acetyl‐CoA (Fig. 4). Samples were taken from the wild‐type and the best PHA producer H‐ΔcatA2 during growth (5 h cultivation, nitrogen excess) and PHA synthesis (15 h cultivation, nitrogen limitation) in batch cultures. During growth, the mutant H‐ΔcatA2 – expressing the attenuated ortho‐pathway – exhibited 50% increased acetyl‐CoA and malonyl‐CoA levels as compared to the wild type, whereas the TCA cycle intermediate succinyl‐CoA was not affected. Notably, the concentration of the CoA esters generally collapsed when cells entered nitrogen limitation. For example, the availability of succinyl‐CoA was decreased up to a hundred‐fold. Regarding PHA production, the mutant H‐ΔcatA2 exhibited twice as much malonyl‐CoA during the production phase (Fig. 4B).
Fig. 4.

Intracellular level of CoA thioesters in P. putida H and its catA2 deletion mutant during growth (sample taken at 5 h cultivation under nitrogen excess) and PHA production (sample taken at 15 h cultivation under nitrogen limitation) in batch cultures.
A. Acetyl‐CoA levels (nmol gCDW–1), (B) malonyl‐CoA levels (nmol gCDW–1), (C) succinyl‐CoA levels (nmol gCDW–1). Values represent the mean and errors from three independent experiments. NS, not significant. P values (P> 0.05 and *P < 0.05).
Kinetics of PHA synthesis in chemostat cultures
To obtain rates and yields undermaintained nitrogen‐limiting conditions and provide the experimental basis for later steady‐state flux analysis (see below), specific benzoate uptake and production rates (biomass, PHA, carbon dioxide and by‐products) were assessed in chemostat cultures, operated under benzoate excess and nitrogen‐limiting conditions (C/N ratio of 4.02 mol mol–1) to promote PHA accumulation (Table 3). Once cultures had reached a steady state, the measurements yielded a well‐closed carbon balance for all strains, underlining the data’s consistency. The wild type produced PHA at 21% on a cell dry basis. Almost 50% of the benzoate taken up accumulated as cis,cis‐muconic acid. In comparison, the mutant strain H‐ΔcatA revealed an increased PHA content (27%). Here, catechol was secreted together with cis,cis‐muconic acid. As observed in batch cultures, P. putida H‐ΔcatA2 exhibited the best performance. It consumed benzoate fastest and exhibited the highest PHA titre and content (35%), more than twice as high as the wild type. Notably, the two deletion strains produced significantly more CO2. This effect might have resulted from the usage attenuation of the ortho‐pathway in the two mutants, which could have otherwise channelled more aromatics to succinyl‐CoA downstream of the dehydrogenases, the entry of the TCA cycle like pyruvate dehydrogenase (PDH), 2‐oxoglutarate dehydrogenase (ODH) and isocitrate dehydrogenase (ICDH). The double knockout mutant strain, which exclusively converted catechol via the meta pathway, obviously suffered from the high level of secreted catechol. It showed rather low rates regarding substrate uptake, PHA formation and CO2 evolution.
Table 3.
Growth kinetics and stoichiometry of P. putida strains grown on 15 mM benzoate under nitrogen‐limiting conditions in chemostat cultures. D = 0.09 (h–1). Values represent the mean and corresponding errors from two independent experiments.
| Strain | Residual benzoate (mmol) | YXr/S (g mol–1) | YPHA/S (g mol–1) | PHA a (wt%) | Carbon recovery (%) | Uptake and production rates (mmol gCDW–1 h–1) | |||||
|---|---|---|---|---|---|---|---|---|---|---|---|
| Benzoate | Cis,cis‐muconate | Catechol | CO2 | ||||||||
| P. putida H | 9.4 ± 0.6 | 44.6 | 11.5 | 21.1 | 97 ± 3 | 2.39 ± 0.17 | 1.15 ± 0.09 | 0.02 ± 0.17 | 4.19 ± 0.31 | ||
| H‐ΔcatA | 7.7 ± 0.4 | 43.2 | 15.9 | 27.0 | 95 ± 2 | 2.16 ± 0.12 | 0.42 ± 0.01 | 0.34 ± 0.02 | 5.51 ± 0.28 | ||
| H‐ΔcatA2 | 7.3 ± 0.5 | 47.6 | 24.5 | 35.4 | 102 ± 3 | 2.64 ± 0.08 | 0.93 ± 0.06 | 0.12 ± 0.03 | 6.72 ± 0.45 | ||
| H‐ΔcatAΔA2 | 6.4 ± 0.8 | 69.2 | 11.6 | 15.0 | 96 ± 6 | 1.54 ± 0.14 | 0.00 | 0.52 ± 0.02 | 3.89 ± 0.10 | ||
PHA content relative to cell dry weight (CDW).
Impact of the inactivation of catA genes on catechol‐dioxygenase activities under PHA synthesis
As shown, the different mutants varied significantly regarding growth and PHA production and differed in the extent of intermediate catabolic secretion. The capacity of the ortho and the meta route downstream of the central node catechol was now studied by measuring the capacity of the catechol dehydrogenases (C12DO and C23DO) from the chemostat cultures. The wild‐type P. putida H expressed enzymes of both routes (Fig. 5A). The activity of C12DO, reflecting the two ortho cleaving dioxygenases, was almost ten‐fold higher than that of C23DO, the enzyme of the meta route, suggesting the ortho branch as dominating catabolic pathway. The inactivation of catA reduced the C12DO activity to 30%, whereas approximately 75% C12DO activity was retained in H‐ΔcatA2, indicating a substantially different impact of the two enzymes on pathway flux. Surprisingly, deletion of either catA or catA2 had a strong effect on the enzymatic capacity of the meta route. While inactivation of catA provoked a two‐fold enhanced activity of C23DO, catA2 deletion resulted in an eight‐fold activity increase for C23DO to 75 (mU mg–1), the highest activity among the tested strains (Fig. 5A).
Fig. 5.
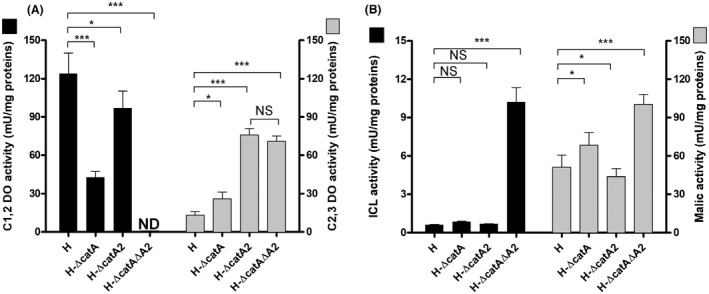
A. Activities of catechol 1,2‐dioxygenase (C12DO) and catechol 2,3‐dioxygenase (C23DO).
B. Activities of isocitrate lyase (ICL) and malic enzyme (MAE) in P. putida H and catabolic pathway mutants, grown in chemostat (D = 0.09 h–1) on benzoate under PHA‐producing conditions. Values represent the mean and errors from three independent experiments. ND, not detected. (NS, not significant (P> 0.05), *P < 0.05, **P < 0.001 and ***P < 0.0001).
Taken together, P. putida H‐ΔcatA2 exhibited the highest total capacity to metabolize catechol (180 mU mg–1), more than 30% higher than in wild type. The double mutation revealed a similarly boost of the C23DO activity, but had lost entirely the C12DO activity so that its total capacity to convert catechol was only 50% of that of the parent and below 40% of that of the best PHA producer P. putida H‐ΔcatA2, explaining its generally reduced performance (Table 3).
Impact of the catabolic operation between the ortho and meta route on the activity of anaplerotic enzymes
We further measured the activity of two enzymes competing with PHA synthesis for acetyl‐CoA, i.e. the glyoxylate shunt enzyme isocitrate lyase (ICL) and malic enzyme (malate dehydrogenase, MAE), converting the product of the shunt (malate) into pyruvate (Klinke et al., 2000)(Borrero‐de Acuña et al., 2014)(Fig. 5B). We recorded different ICL activity (0.3–0.6 mU mg −1) in the wild‐type and the two single‐deletion strains H‐ΔcatA and H‐ΔcatA2. Likewise, MAE was different between in the strains, whereby the specific activity (5 ‐ 7 mU mg−1) was up to 25‐fold higher than that of ICL. Both enzymes were strongly activated in the strain H‐ΔcatAΔA2 (Fig. 5). This activation suggested a partial redistribution of carbon towards the glyoxylate shunt and subsequent decarboxylation of malate into pyruvate via MAE.
Metabolic fluxes of the engineered PHA‐producing strains
We used the measured rates (benzoate, catechol, cis,cis‐muconate, CO2 and PHA, Table 3) and specific dioxygenase activities at the catechol node (Fig. 5) as constrains for metabolic flux balance analysis (FBA) of each strain under PHA‐producing conditions. This procedure allows us to optimize biomass synthesis (FBA) and compare the computed insilico growth rate with the imposed specific growth rate (dilution rate D) in the chemostats, where the values were very consistent in all cases (0.09 (h–1), Fig. 6). At the catechol node, ortho and meta pathway fluxes were partitioned according to the available enzymatic capacity as previously described (Kind et al., 2014; Becker et al., 2018)(Fig. 5A, Fig. 6). The enzyme capacity in the wild type comprised that of C23DO (13.3 mU mg protein–1) and C12DO (124.0 mU mg protein–1). Considering a cellular protein content of 50% (van Duuren et al., 2013), this capacity would allow for a maximum flux of 1.6 mmol gCDW –1 h–1 (C23DO) and 14.4 mmol gCDW –1 h–1, (C12DO) respectively (˜1:9 ratio). When both values were added together, they exceeded the measured uptake rate of sodium benzoate, indicating that the catabolic pathway operated below the highest possible flux (Fig. 6) When computing the remaining fluxes, the wild type revealed an active TCA cycle with a citrate synthase flux (at the entry into the cycle) of 0.68 mmol gCDW –1 h–1. The glyoxylate shunt carried nearly zero flux along with an inactive Entner–Doudoroff (ED) pathway (Fig. 6A). The calculation further revealed that the malic enzyme was active.
Fig. 6.

Carbon flux distribution of (A) P. putida H, (B) the deletion mutants H‐ΔcatA, (C) H‐ΔcatA2 and (D) H‐ΔcatAΔA2. The rates, used to calculate the fluxes, were inferred from chemostat cultures (D = 0.09 h–1) on benzoate under nitrogen‐limiting PHA‐producing conditions. The enzymatic activities for Catechol 1,2‐dioxygenase (C12DO), catechol 2,3‐dioxygenase (C23DO), malic dehydrogenase (MAE), isocitrate lyase (ICL) were measured experimentally. Red arrows represent zero flux.
When comparing the flux pattern of P. putida H to that of the single‐deletion mutant H‐ΔcatA, MAE exhibited a similar flux (Fig. 6A, B). For the mutant H‐ΔcatA2, however, a lower flux was estimated (Fig. 6C). As more PHA was synthesized by H‐ΔcatA2, this was reflected by a higher PHA flux 2‐fold than that of the parental strain. A different scenario was found for the double‐mutant H‐ΔcatAΔA2, where benzoate was only metabolized through the meta route. The C23DO enzyme seemed to be less effective at converting catechol to HMS so that catechol secretion was boosted more than 20‐fold (Fig. 6D). There was also a major flux change observed within the TCA cycle, where the flux through the succinic dehydrogenase enzyme was reduced by 50% and the glyoxylate shunt was found activated.
Next, we explored the carbon partitioning between the meta and ortho‐pathway in more detail. For this, we performed a robustness analysis of fluxes taking the PHA synthesis on benzoate as objective (Edwards and Palsson, 2000). The simulations showed that a redirection of flux exclusively via the ortho route (Fig. S1A) resulted in diminished PHA biosynthesis with an undesired high secretion of cis,cis‐muconate (Fig. S1B). On the other hand, exclusive use of the meta pathway for benzoate conversion led to an enhanced but restricted PHA production flux due to the limited carbon conversion capacity of the C23DO (1.1 mmol gCDW –1 h–1) under nitrogen limitation (Table 3, Fig. 6D), ultimately leading to the high accumulation of catechol during benzoate transformation (Table 3). These results suggest that a balanced operation of the meta and ortho route is crucial for an appropriate distribution of catechol via the parallel pathways (Fig. 6, Fig. S1) to enable fast substrate uptake and enhanced formation of acetyl‐CoA for increased PHA synthesis, as observed in the H‐ΔcatA2 mutant strain.
Benchmarking PHA production in P. putida H‐ΔcatA2 using a benzoate‐based fed‐batch process
The best mutant was now compared to the wild type for PHA production performance using fed‐batch fermentation (Fig. 7). A specific feed strategy was elaborated for this purpose, which comprised three phases. As exemplified for the wild type, an initial batch phase (0–10 h) was followed by exponential feeding of benzoate under sufficient nitrogen availability (ammonium feeding rate 0.11 g h–1) to form biomass (10–40 h). This strategy allowed to avoid the accumulation of intermediates, e.g. catechol and cis,cis‐muconate. As displayed in Fig. 7A . P. putida H reached 34 gCDW l–1 after 40 h cultivation. Slightly afterwards, a third phase was initiated. The supply of ammonium was stopped, and a pulse of benzoate was added to deplete the remaining ammonium and trigger PHA accumulation. Once benzoate and ammonium were depleted, the carbon substrate was fed to the bioreactor at a constant rate of 5.8 (g benzoate h–1) based on data from the batch cultures during the nitrogen‐limiting phase (Fig. 3). Benzoate slightly accumulated during the final phase, and catechol and cis,cis‐muconate were inevitably synthesized to a small extent, hence we tried to maintain the benzoate level as low as possible with the imposed conditions. The cells finally produced 3.3 g l–1 of PHA, 16.5% of biomass, at a volumetric productivity of 1.1 g l–1 day–1.
Fig. 7.

Three‐phase fed‐batch PHA synthesis by feeding benzoate as the solely carbon substrate. The fermentation comprised multiple feeding stages: (i) batch culture (initial benzoate concentration 10 mM), (ii) exponential feeding (µset 0.15 h–1), (iii) constant feeding of benzoate.
A. Substrates and products profile of P. putida H and (B) the mutant H‐ΔcatA2. Grey panels indicate nitrogen limitation. Values represent the mean and errors from two independent bioreactors.
Using the same feeding approach than for the wild‐type strain during the exponential growth phase (NH4Cl feeding rate 0.11 g h–1), the mutant H‐ΔcatA2 achieved a slightly lower biomass concentration (27 g l–1) after 40 h cultivation (Fig 7B). During the PHA production phase, we stopped the addition of ammonium and supplied benzoate to the bioreactor at a rate of 8.3 g h–1, as imposed from the batch behaviour of the mutant (Fig. 3). The engineered H‐ΔcatA2 strain secreted less cis,cis‐muconate and slightly higher amounts of catechol (Fig. 7A, B). Notably, the strain synthesized 6.1 g l–1 of PHA, resulting in a volumetric productivity of 1.83 g l–1 day–1, nearly two‐fold higher than the parental strain (Fig. 7B, Table 4).
Table 4.
Performance of P. putida strains for the synthesis of mcl‐PHA from benzoate and lignin‐based aromatics
| Strain | Fermentation mode | Substrate | CDW (g l–1) | PHA (g l–1) | PHA productivity (g l–1 day–1) | Monomer composition (%) a | References | |||||
|---|---|---|---|---|---|---|---|---|---|---|---|---|
| C6 | C8 | C10 | C12 | C12:1 | C14 | |||||||
| P. putida H | Fed‐batch | Benzoate | 20.5 ± 1.2 | 3.3 ± 0.3 | 1.1 ± 0.1 | ND | 19.6 | 77.4 | 2.3 | 0.7 | ND | This study |
| H‐ΔcatA2 | Fed‐batch | Benzoate | 21.1 ± 0.9 | 6.1 ± 0.6 | 1.8 ± 0.2 | ND | 13.5 | 78.3 | 6.8 | 1.5 | ND | This study |
| KT2440 | Batch | Benzoate | 0.3 | 0.1 | 0.1 | 6.3 | 52.0 | 28.1 | 4.8 | 8.5 | ND | Xu et al. (2019) |
| H‐ΔcatA2 | Fed‐batch | Enriched lignin stream b | 5.4 ± 0.3 | 1.4 ± 0.1 | 0.7 ± 0.0 | ND | 11.8 | 79.4 | 7.6 | 1.2 | ND | This study |
| AG2162 | Batch | Lignin‐ aromatics | 0.7 | 0.1 | 0.03 | ND | 10.0 | 80.0 | 8.3 | ND | 1.7 | Salvachúa et al. (2020) |
| KT2440 | Fed‐batch | Lignin‐aromatics | 5.1 | 1.0 | 0.6 | NS | NS | NS | NS | NS | NS | Liu et al. (2017) |
| KT2440 | Batch | Lignin‐ aromatics | 0.8 | 0.3 | 0.1 | ND | 22.0 | 55.0 | 16.0 | ND | 7.0 | Linger et al. (2014) |
ND, Not detected; NS, Not shown.
C6: 3‐hydroxyhexanoate, C8: 3‐hydroxyoctanoate, C10: 3‐hydroxydecanoate, C12: 3‐hydroxydodecanoate, C12:1: 3‐hydroxy‐5‐cis‐dodecanoate.
The feeding solution was enriched with pure catechol (final concentration 250 mM catechol).
Fed‐batch PHA production on lignin‐derivative aromatic compounds
Finally, the PHA producer P. putida H‐ΔcatA2 was challenged to produce the biopolymer from a lignin hydrolysate (50 mM catechol) solution and smaller levels of methylated and ethylated catechol derivatives and enriched with 200 mM catechol. The feed addition was coupled to the oxygen demand (DO‐stat) to avoid cell intoxication. A feed pulse (to attain 1.25 mM catechol) was supplied, when the pO2 level sharply increased to above 80% of saturation, which indicated a stop of catechol‐dioxygenase catalysis due to catechol depletion (Fig. 8B). The mutant achieved a biomass level of 5.36 gCDW l–1 after 30 h, without accumulation of cis,cis‐muconate and catechol. Growth stopped when nitrogen became the limiting nutrient. Finally, 1.40 g l–1 of PHA was produced, accounting for more than 25% of cell dry weight. The process yielded a final volumetric productivity of 0.7 (g PHA) l–1 day–1. We recorded a minor accumulation of methyl‐muconate (<200 µM) and traces of ethyl‐muconate (<10 µM) during the PHA production phase, explaining the intrinsic acidification of the medium (Fig 8A).
Fig. 8.
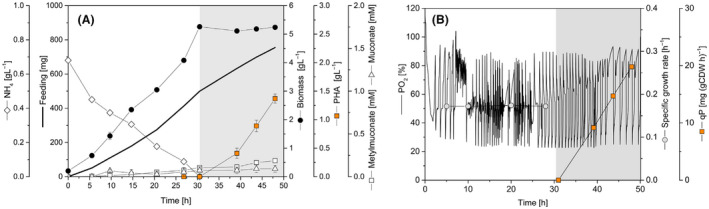
Fed‐batch PHA production using an enriched lignin hydrolysate.
A. Substrate and product profile of strain H‐ΔcatA2 growing on lignin‐derived aromatics.
B. DO‐based feed profile, constant specific growth rate and specific PHA productivity. The obtained lignin hydrolysate contained 50 mM of catechol and traces of other aromatics, and it was enriched with 200 mM pure catechol. Grey panels indicate nitrogen limitation. Values represent the mean and errors of two independent bioreactors.
Discussion
The mutant P. putida H‐ ΔcatA2 sets a next level in PHA production from aromatics
One of the biggest challenges to utilizing aromatics for the synthesis of microbial added‐value chemicals is to achieve efficient catabolic conversion without substrate accumulation and/or toxic intermediate’s secretion. In this regard, P. putida KT2440, that exclusively exhibits the ortho‐cleavage pathway to degrade benzoate and catechol, has been used as both a model strain to investigate the underlying molecular mechanisms on aromatics (Reva et al., 2006; Johnson et al., 2017) as well as a biocatalyst for the synthesis of PHA and cis,cis‐muconic acid (Linger et al., 2014; Kohlstedt et al., 2018). So far, most of the PHA production processes on aromatics have been carried out in batch cultures, using low concentrations of benzoate and lignin derivatives since higher levels of the aromatic substrates promote catechol formation arresting biomass and biopolymer synthesis (Linger et al., 2014)(Xu et al., 2019). The ortho‐pathway attenuated mutant P. putida H‐ΔcatA2 converted aromatics simultaneously via the ortho and meta route, yielded much higher PHA levels and accumulated the biopolymer in a fed‐batch process on benzoate with a titre of 6.1 g l–1 and a volumetric productivity of 1.8 g l–1 day–1, surpassing previous efforts approximately six‐fold (Liu et al., 2017). Moreover, 1.4 g l–1 PHA was formed from softwood lignin hydrolysate in a cascaded process. The lignin‐derived aromatics served as sole carbon substrate for rapid growth and efficient PHA production, providing an important next step towards future PHA production from lignin (Table 4).
In a recent study, the implementation of the meta pathway from a Sphingomonas sp. strain into KT2440 along with inactivation of the pyruvate dehydrogenase complex enabled the production of lactate from aromatics (Johnson and Beckham, 2015). In this regard, the balancing of different catabolic routes at the catechol node – i.e. 2,3 meta, 4,5 meta, and ortho‐cleavage pathways – by combining them in one strain (Johnson and Beckham, 2015) and fine‐tuning their activity (this study) emerges as an interesting concept to streamline bio‐based production from aromatics. Similar strategies might also help to drive the production of other important chemicals such as organic acids (Johnson and Beckham, 2015), lipids (Shields‐Menard et al., 2017), cis,cis‐muconic acid (Barton et al., 2018; Becker et al., 2018) and adipic acid (Kohlstedt et al., 2018; van Duuren et al., 2020).
Simultaneous activation of the ortho and the meta route is the key to achieve high PHA levels from aromatics
Several studies reported that strains of P. putida, endowed with the ortho and the meta route, modulate the activity of the corresponding ortho and the meta cleaving catechol dioxygenases, C12DO and C23DO, respectively (Kiesel and Müller, 2002), involving a fine‐tuned response to the nutrient level (Barnsley, 1976; Bin and Kai‐Chee, 2008). At a low level of benzoate (< 2 mM), P. putida exclusively uses the ortho route, and with increasing concentrations, C23DO is activated up to 14‐fold higher activity than C12DO (Hamzah and Al‐Baharna, 1994; Kiesel and Müller, 2002; Bin and Kai‐Chee, 2008). Given the benzoate concentration (15 mM) employed in this study to promote PHA synthesis, the wild‐type strain displayed a C12DO:C23DO ratio of ˜ 9:1, explaining the high secretion of cis,cis‐muconate (Fig. 5, Table 3) and the low level of synthesized mcl‐PHA. Interestingly, we encountered a different scenario for the mutant strains, where the inactivation of catA2 was the key to improved PHA formation in P. putida H. The deletion had several effects, including the diminished capacity of the ortho route at the catechol node by 25% and an increased bioconversion capacity of the meta route by almost 8‐fold (Fig. 5). As a result, the total catabolic capability to degrade catechol in P. putida H‐ΔcatA2 was even 30% higher than in the wild type. This increased overall flux potential appeared as a surprising response to eliminating an important pathway enzyme on a first glance, although it was highly beneficial for PHA production. As shown, diverting carbon flux into the meta pathway in H‐ΔcatA2 increased the availability of acetyl‐CoA and malonyl‐CoA (Fig. 4), which seemed a major driver for enhanced PHA formation. This improvement occurred at the expense of transiently accumulating cis,cis‐muconate during the bioconversion (Figs 3 and 7B), which appeared, however, not too severe due to later re‐use by the cells. The growth of all strains without secretion of the intermediate 2‐HMS distinguishes P. putida H from other pseudomonads endowed with the meta pathway (Bin and Kai‐Chee, 2008; Jiménez et al., 2014). This trait might be a first indication that P. putida H channels catechol more efficiently through the meta route, resulting in improved precursor supply for PHA formation (Poblete‐Castro et al., 2017). Another distinction among the engineered P. putida strain was the variation in the monomer composition of the synthesized mcl‐PHA (Table 2). Given the catechol accumulation during benzoate bioconversion, this toxic aromatic might trigger changes in acyl‐ACP (C6‐C18) intermediates belonging to the synthesis de novo fatty acids to safeguard membrane integrity. Usually, the incorporation of long‐chain unsaturated fatty acids and the increase in the isomerization form, from cis to trans, are adaptive bacterial mechanisms to cope with catechol and other highly toxic aromatics (Heipieper et al., 1992; Mrozik et al., 2005). As the de novo fatty acid biosynthesis route generates the PHA precursors (3‐hydroxyacyl‐ACP) in P. putida strains when grown on aromatics, this might explain to some extent the observed increment on unsaturated monomers in the PHA polymeric chain (Table 2).
Recent studies of benzoate‐grown P. putida KT2440 proposed CatA2 as a regulatory safety valve during aromatics degradation, involved in keeping intracellular catechol levels low and avoiding intoxication and cell death (Jiménez et al., 2014). The strain H‐ΔcatA2 did not possess this safety valve anymore so that the upregulation of C23DO in the meta branch could display a second or alternative level of safety control. As elucidated from the enzyme assays and flux balance analyses, C23DO has a limited capacity and is negatively controlled by CatA2 (Fig. 4A). It is interesting to note that P. putida mt‐2 a bacterium that carries the TOL plasmid pWWO and is endowed with both ortho and meta routes faced an metabolic conflict for the dissimilation of catechol due to stochastic population heterogeneity as a portion of the cells population remained inactive (Silva‐Rocha and Lorenzo, 2014), which would be interesting to be studied further also in strain H and its mutants.
Future strategies for metabolic engineering of PHA overproduction in P. putida from aromatics
Up to date, the focus for enhanced PHA production in P. putida has been poured mainly into engineering pathways involved in the catabolism of fatty acids (Chen and Jiang, 2018; Borrero‐de Acuña et al., 2019) and carbohydrates (Poblete‐Castro et al., 2013; Borrero‐de Acuña et al., 2014; Poblete‐Castro, Binger, et al., 2014). Recently, comprehensive metabolic engineering created a P. putida PHA factory for biopolymer production from aromatics (Salvachúa et al., 2020), which integrated PHA biosynthetic engineering at the level of the phaZ, PhaG, PhaC1 and PhaC2 with the elimination of β‐oxidation pathway.
Our results nicely complement these strategies by adding the peripheral catabolism. It seems promising to combine the optimized modules to breed a hyper‐PHA producer with a completely streamlined carbon core metabolism. In addition, and despite its presently weaker performance, further upgrading of engineer the C12DO‐free double deletion strain H‐ΔcatAΔA2 strain towards deregulation of C23DO activity might be a vital strategy to follow in order to circumvent the accumulation of catechol and carbon loss into muconate. Approaches could involve enhancing PhlH activity using refined synthetic promoters (Zobel et al., 2015; Kohlstedt et al., 2018) to drain as much carbon as possible into the meta‐cleavage pathway. In addition, protein engineering of PhlH for improved activity appears promising (Han et al., 2015; Becker et al., 2018).
Finally, our data suggest that carbon core metabolism might be improved further. The carbon flux distributions revealed significant alterations at the isocitrate and the malate node among the strains. Particularly, the carbon flux into the acetyl‐CoA pool was drastically enhanced in the double mutant, resulting in full activation of the glyoxylate shunt (Fig 6D, Fig. 5B) with isocitrate lyase (ICL) catalysing the first enzymatic step. Generally, activation of the glyoxylate shunt occurs due to a high abundance of pyruvate and acetyl‐CoA (Kukurugya et al., 2019). The glyoxylate shunt competes with PHA synthesis for acetyl‐CoA (Klinke et al., 2000). Here, we showed increased levels of CoA esters. Hence, the glyoxylate shunt’s inactivation could lead to an improved PHA accumulation from aromatics channelled through the meta route exclusively.
Conclusions
Overall, the mcl‐PHA production capacity of the metabolically engineered H‐ΔcatA2 strain yielded twice as much biopolymer as that produced in the wild‐type strain under various fermentation modes and surpassed previous efforts to derive this important biopolymer from aromatics. By deleting the catA2 gene in P. putida H, the cells displayed a more balanced operation of the meta and ortho‐pathways, thus allowing an efficient conversion of the toxic intermediate catechol and generating an enhanced acetyl‐CoA and malonyl‐CoA flux towards PHA synthesis. We further demonstrated that a high cell density culture on benzoate is feasible in P. putida H by applying an exponential feeding approach to convert benzoate into biomass and CO2 without by‐product formation. Within the PHA production phase under nitrogen limitation, we found different demands for benzoate uptake between the wild‐type and H‐ΔcatA2 mutant, pointing to the requirement of tailoring the substrate feeding to exploit strain performance fully. Finally, we developed a successful process using lignin hydrolysates from softwood as sole feedstock for fed‐batch PHA synthesis by coupling the oxygen demand (DO‐stat) exerted by the action of catechol dioxygenases during catechol cleavage to prevent substrate overload and growth arrestment along with the full conversion of aromatics into central carbon intermediates for biopolymer synthesis.
Experimental procedures
Bacterial strains, plasmids and genetic engineering
All bacterial strains, plasmids and oligos used in this study are summarized in Table 5. The deletion of the genes catA (RS04870) and catA2 (RS18210) from the genome of P. putida H used scarless mutagenesis, which relied on DNA excision by I‐SceI homing endonuclease (Martínez‐García and de Lorenzo, 2011). In a first step, the oligo pairs catAUpFw‐catADwRv and catA2UpFw‐catA2DwRv were used to amplify the flanking regions of catA and catA2. Overlap extension PCR was then conducted to fuse the generated up‐ and downstream regions of each gene together, followed by ligation of the joint fragment into the blunt‐end vector pJET1.2. The E. coli DH5α strain was used to propagate the obtained pJET1.2 constructs. Afterwards, inserts previously introduced in pJET1.2 vectors were EcoRI‐BamHI digested and re‐ligated into the suicide vector pSEVA212, which yielded the plasmids pSEVA212‐catAUPDW and pSEVA212‐catA2UPDW. These were introduced into E. coli DH5αλpir. Triparental mating was used to transfer the suicide vectors into P. putida H using E. coli HB101/pRK600 as a helper strain. The correct integration was validated using PCR with primers catAUpFw/catADwRv and catA2UpFw/catA2DwRv respectively. The gentamicin‐resistance containing plasmid pSEVA628 bearing the I‐SceI endonuclease was introduced into the given strains by triparental mating as specified above. Next, 5 mM m‐toluic acid was added to induce I‐SceI enzyme expression, which resulted in the formation of kanamycin‐sensitive clones. Successful deletion of catA and catA2 was controlled via PCR, using primers catAKOFw‐catAKORv and catA2KOFw‐catA2KORv respectively. All deletions were additionally verified by sequencing. The resulting deletion strains were designated P. putida H ΔcatA and P. putida H ΔcatA2. The double deletion strain (P. putida H ΔcatAΔA2) was constructed likewise, transferring the pSEVA212‐catA2 vector into the ΔcatA mutant. All pSEVA628 plasmids were cured by growing strains on Luria Bertani (LB) antibiotic‐free medium three consecutive times. When needed, antibiotics were supplied as follows: 50 μg ml–1 kanamycin, 30 μg ml–1 chloramphenicol, 150 μg ml–1 ampicillin and 15 μg ml–1 gentamycin for E. coli strains; 500 μg ml–1 kanamycin and 50 μg ml–1 gentamycin for strains of P. putida H.
Table 5.
Bacterial strains, plasmids and oligos employed in this study
| Strains and plasmids | Relevant features | Source/References |
|---|---|---|
| Pseudomonas putida | ||
| H | Wild‐type strain with a bifurcated aromatic degradation pathway | (Herrmann et al., 1987) |
| H‐catA | P. putida H‐catA knockout mutant strain | This study |
| H‐catA2 | P. putida H‐catA2 knockout mutant strain | This study |
| H‐Δ catAΔA2 | P. putida H double knockout mutant strain deficient in the expression of catA and catA2 | This study |
| Escherichia coli | ||
| DH5α | F– Φ80lacZΔM15 Δ(lacZYA‐argF) U169 recA1 endA1 hsdR17 (rK–, mK+) phoA supE44 λ– thi‐1 gyrA96 relA1 | ThermoFisher, Scientific, Darmstadt, Germany |
| DH5αλpir | sup E44, ΔlacU169 (ΦlacZΔM15), recA1, endA1, hsdR17, thi‐1, gyrA96, relA1, λpir phage lysogen | Biomedal, Seville, Spain |
| HB101 | Helper strain; F– λ– hsdS20(rB– mB–) recA13 leuB6(Am) araC14 Δ(gpt‐ proA)62 lacY1 galK2(Oc) xyl‐5 mtl‐1 thiE1 rpsL20 (SmR) glnX44(AS) | (Benedetti et al., 2016) |
| Plasmids | ||
| pJET1.2 | ApR; oriV (pMB1) Plasmid suitable for subcloning steps | ThermoFisher, Scientific, Darmstadt, Germany |
| pRK600 | CmR; oriV (ColE1), tra + mob + functions from plasmid RK2 | (Benedetti et al., 2016) |
| pSEVA212 | KmR; oriV (R6K), Sce‐I RS. Suicide vector | (Martínez‐García et al., 2015) |
| pSEVA628 | GmR; oriV (RK2), xylS‐Pm –> SceI | (Martínez‐García et al., 2015) |
| pJET1.2‐catAUPDW | ApR; pJET1.2 plasmid harbouring the fused up‐ and downstream regions of catA gene | This study |
| pJET1.2‐catA2UPDW | ApR; pJET1.2 plasmid harbouring the fused up‐ and downstream regions of catA2 gene | This study |
| pSEVA212‐catAUPDW | KmR; pSEVA212 harbouring the fused up‐ and downstream regions of catA gene | This study |
| pSEVA212‐catA2UPDW | KmR; pSEVA212 harbouring the fused up‐ and downstream regions of catA2 gene | This study |
CmR, chloramphenicol resistance; KmR, kanamycin resistance; GmR, gentamycin resistance; ApR, ampicillin resistance; I‐SceI, SceI endonuclease gene precursor; xylS‐Pm, genetic circuit inducible upon 3MB addition.
Media and growth conditions in shake flasks
Cells were plated onto LB agar plates and incubated for 24 h at 30°C. To assess growth profiles, a single colony from an LB plate was inoculated into a 50 ml flask with 10 ml M9 salt minimal medium, which contained 3 g l–1 Na2HPO4·7H2O, 12.8 g l–1 KH2PO4, 0.5 g l–1 NaCl, 1 g l–1 NH4Cl, 0.12 g l–1 MgSO4·7H2O and 1 ml l–1 trace element solution (2.7 g l–1 CaCO3, 6 g l–1 FeSO4·7H2O, 1.16 g l–1 MnSO4·H2O, 2.0 g l–1 ZnSO4·H2O, 0.33 g l–1 CuSO4·5H2O, 0.08 g l–1 H3BO3, 0.37 g l–1 CoSO4·7H2O). Sodium benzoate (5 mM) was added as sole carbon and energy source. Strains were grown at 30°C in a rotary shaker at 160 rpm (Ecotron; INFORS HT) using 500 mll baffled shake flasks with 100 ml medium. All cultures were started with an initial optical density OD600 of 0.05. For PHA synthesis, cultures were carried out in 500 ml shake flasks with 100 ml modified M9 medium, which contained 15 mM sodium benzoate and 0.2 g l–1 NH4Cl to trigger N limitation during the process.
Batch cultures in bioreactors
Cells were grown at 30°C using 1 l (0.8 l working volume) bioreactors (Labfors 5; INFORS HT, Switzerland). For PHA production, the modified M9 medium contained 15 mM sodium benzoate and 0.2 g l–1 NH4Cl. The aeration rate was set to 0.8 l min–1 (1 vvm), using a mass flow controller. The dissolved oxygen (DO) level was maintained at 20% of saturation by controlling the agitation speed up to a maximum of 900 rpm. The pH was automatically controlled at 6.9 ± 0.1 using 1 M NaOH and 1 M H2SO4.
Chemostat cultures in bioreactors
Continuous cultivation was carried out under aerobic conditions at a dilution rate of 0.09 h–1 using 1 l bioreactors (0.8 l working volume) (Labfors 5l INFORS HT, Switzerland) at 30°C and 900 rpm. The feed solution consisted of modified M9 minimal medium, supplemented with 15 mM sodium benzoate and 0.2 g l–1 NH4Cl. The pH value was controlled at 6.9 ± 0.1 by automatic addition of 1 M NaOH. The aeration rate was set to 1 l min–1 (1.25 vvm). The working volume was kept constant by removing culture broth through a peristaltic pump and controlling the weight with a balance placed under the reactor. Carbon dioxide formation and oxygen consumption was monitored online using a gas analyser (BlueInOne Cell; BlueSens gas sensor GmbH, Herten, Germany) coupled to the condenser outlet of the bioreactor.
Fed‐batch PHA production on benzoate
By taking an overnight‐grown cell suspension (LB medium), cells were transferred into a 1 l shake flask filled with 300 ml M9 minimal medium (containing 5 mM sodium benzoate and 1 g l–1 NH4Cl) and cultured in a rotary shaker for 24 h at 160 rpm (Ecotron; INFORS HT). The culture was then used as seed for the fed‐batch process which was operated in a Labfors 5 system (INFORS HT, Switzerland) equipped with a 6‐l vessel. The starting volume was 2 l in all experiments. The temperature was set to 30 °C and the pH was kept constant at 6.9 ± 0.1 by automatic addition of H3PO4 4% (w/v) and NaOH 10% (w/v). A modified M9 minimal medium was used for the batch phase, which contained 15 mM sodium benzoate, 1 g l–1 NH4Cl, and an elevated amount of trace elements (5 ml l–1 of the stock given above. The feed solution contained per litre: 3 M sodium benzoate, 12 g MgSO4∙7H2O and 0.5 g TEGO antifoam (Evonik, Essen, Germany). The airflow was set to 3 l min–1 (mixture of air and pure oxygen at a ratio of 5:1). The agitation speed was automatically adjusted in the range of 300–1200 rpm to set the DO level at 20% of saturation. A gas analyser (BlueInOne Cell; BlueSens gas sensor GmbH) was coupled to the exhaust gas of the bioreactor to record CO2 production and O2 consumption during the process. An exponential feeding strategy was applied during the biomass production phase, following an exponential function (Eq. 1).
| (1) |
Hereby, F was the feed rate (l h–1), μ set the desired specific growth rate (set to 0.15 h–1), S 0 the substrate concentration of the feed medium (3 M sodium benzoate), t the time after feed start (h), Yxs the biomass yield on sodium benzoate (taken from Table 1), V 0 the initial volume of the culture (l) and X 0 the initial biomass level (g cells l–1). A constant feed was employed during the following PHA accumulation phase, as given below.
Hydrothermal conversion of lignin
Kraft lignin (Indulin AT, Sigma‐Aldrich) was hydrolysed under supercritical conditions including a subsequent concentration step, as described previously (Kohlstedt et al., 2018; Bartonet al., 2018; van Duurenet al., 2020). The lignin concentrate contained a mixture of different aromatics with catechol (50 mM) as major (> 90%) compound and smaller levels of phenol, methylated and ethylated catechol.
Fed‐batch PHA production on Kraft lignin hydrolysate
For the synthesis of PHA from lignin, a fed‐batch process was carried out in a 100‐ml bioreactor (DASGIP, Jülich, Germany) at 30°C. The batch medium in the bioreactor was modified M9 minimal medium which contained 2 g l–1 NH4Cl and concentrated lignin hydrolysate (1.25 mM catechol). The feed was composed of concentrated Kraft lignin hydrolysate, which was enriched with catechol to a final concentration of 250 mM so that the fed‐batch process could be maintained for a longer time. The feed additionally contained 0.1 mM sodium benzoate, known as inducer of aromatic catabolism in P. putida (Kohlstedt et al., 2018). The feed was added to the bioreactor in a pulse‐wise fashion throughout the entire process. The DO level was kept above 20% saturation by suppling filtered air at a rate of 6 l h–1 and adjusting the stirrer speed between 200 and 1000 rpm. The pH value was kept constant at 6.9 ± 0.1 by automatic addition of 1.5 M NaOH. Pre‐cultures of strain H‐ΔcatA2 were grown overnight in shake flasks at 30°C and 180 rpm, using 5 mM sodium benzoate plus 2 mM catechol in minimal M9 medium. The process was inoculated to an initial OD600 of 0.3. Once catechol was consumed, the DO signal raised to a value above 80%. Then, a pulse was added to replenish the catechol level to 1.25 mM. This feed strategy was repeated through the entire fermentation process.
Biomass quantification
Cell growth was determined as optical density (OD600) using a spectrophotometer (UV‐Vis Optizen 3220UV, Daejeon, Republic of Korea). The cell dry weight (CDW) was determined gravimetrically after harvesting cells from 10 ml culture broth (10 min, 4°C, 9000 g) in pre‐weighed tubes, including a washing step with distilled water. The obtained cell pellet was dried at 100°C to constant weight.
Substrate and product quantification
Benzoate and pathway intermediates (catechol, cis,cis‐muconate, 2‐hydroxymuconic semialdehyde), were quantified by LC‐MS, using an HPLC (Eksigent ekspert system; AB Sciex Instruments, MA, USA) coupled to a triple quadrupole mass spectrometer (QTrap 4500; AB Sciex Instruments). Chromatographic separation was based on a mixture of solvent A (aqueous solution of 0.1% of formic acid) and solvent B (acetonitrile 100%) and a RP‐18 column (LiChropher100 Merck, Darmstadt, Germany), set to 40°C at a constant flow rate of 0.8 ml min–1. The column was eluted with a linear gradient of (80% A) 0–6 min, (20% A) 6‐7 min and (80% A) 7–10 min. Electrospray ionization was performed in negative mode. The most abundant fragment ions were chosen for selected reaction monitoring, and data were processed using the MultiQuant software. The quantification involved external standards. Ammonium was quantified using a photometric test (Spectroquant Ammonium Test; Merck Millipore, Darmstadt, Germany).
PHA characterization and quantification
Intracellular PHA was characterized and quantified after collecting 10 ml of culture broth (9000 g, 4°C, 10 min), freezing the cell pellet at −20°C for 24 h and freeze‐drying (Lyofilizer VirTis; SP Scientific, New York, NY, USA). The obtained lyophilized cell dry mass (5–10 mg) was subjected to methanolysis, involving incubation in a mixture of 2 ml chloroform, 2 ml methanol, 15% (v v–1), concentrated H2SO4 and 0.5 mg ml–1 3‐methylbenzoic acid for 4 h at 100°C. After cooling down the obtained lysate to room temperature, 1 ml deionized water was added. The mixture was vigorously mixed for 1 min and centrifuged (10 min, 7000 g, 20°C). The bottom phase, containing methyl esters of the PHA monomers, was collected and analysed using GC/MS (YL6900; Young Instruments, Anyang, Korea) (Borrero‐de Acuña et al., 2017), including calibration with purified PHB (Sigma‐Aldrich, MI, USA) and purified mcl‐PHA from previous work (Oliva‐Arancibia et al., 2017). The individual monomers were identified by their mass spectrum (NIST 17 Mass Spectral Library, MA, USA). The relative fraction of PHA in the cell (%) was defined as the amount (grams) of the biopolymer divided by the total cell dry mass (grams), multiplied by 100.
Enzymatic assays
Cells were harvested (40 ml), centrifuged (8000 g, 5 min, 4°C) and washed with 20 ml Tris–HCl buffer (TB) (50 mM, pH 8.0). The obtained cell pellet was resuspended in 1 ml TB. Cells were then disrupted by sonication (QSonica, Newtown, CT, USA) with 30‐sec intervals on ice in between (three cycles, 30 s). DNase I (1 mg ml–1) and RNase (0.25 mg ml–1) were added in between. Cell debris was removed by centrifugation (13 000 g, 4°C, 1 h). The obtained cell extract was immediately used for enzymatic analysis. The protein concentration in cell extract was quantified by the Bradford method using bovine serum albumin as the standard. For assaying the activity of catechol 1,2‐dioxygenase (E.C. 1.13.11.1) and catechol 2,3‐dioxygenase (E.C. 1.13.11.2), the reaction mixture (1 ml) contained 100 μl cell extract, 50 mM Tris‐HCl (pH 8.0) and 20 μM catechol. The enzymatic conversion of catechol into cis,cis‐muconate and 2‐hydroxymuconic semialdehyde (2‐HMS) was followed by measuring the change in absorbance at 30°C at 260 nm (ɛ = 16 800 M−1 cm−1) and 375 nm (ɛ = 46000 M−1 cm−1) respectively. Malic enzyme (MAE) activity (E.C. 1.1.1.40) was assayed at 30°C by monitoring the oxidative decarboxylation of l‐malic acid in a reaction mixture (3 ml) containing 300 µL cell extract, 67 mM Tris–HCl (pH 7.4), 3.3 mM l‐malic acid, 0.3 mM β‐nicotinamide adenine dinucleotide phosphate and 5.0 mM MnCl2. The reaction was monitored by recording the change in absorbance at 340 nm (ɛ = 62200 M−1 cm−1). Isocitrate lyase (ICL) activity (E.C. 4.1.3.1) was measured at 30°C in a 1 ml reaction mixture containing 30 mM imidazole (pH 6.8), 5 mM MgCl2, 1 mM EDTA, 4 mM phenylhydrazine, 1 mM DL‐isocitric acid and 100 µl cell extract. The formed glyoxylate‐phenylhydrazone was monitored spectrophotometrically at 324 nm (ɛ = 3200 M−1 cm−1). For all assays, one unit of enzyme activity (U) was defined as the amount of enzyme necessary to form 1 µmol product per min. Specific enzyme activity was defined as unit (U) per mg of protein.
Quantification of intracellular CoA thioesters
Sampling, sample processing and analysis of intracellular CoA thioesters were conducted as described recently for the related strain P. putida KT2440, involving simultaneous quenching and extraction (95% acetonitrile, 25 mM formic acid, −20 °C), sample clean up, CoA ester analysis by a triple quadrupole MS (QTRAP 6500+; AB Sciex, Darmstadt, Germany) coupled to an HPLC system (Agilent Infinity 1290 System; Agilent Waldbronn, Waldbronn, Germany) and absolute quantification against an internal 13C enriched standard (Gläser et al., 2020).
Flux balance and robustness analysis
Flux balance analysis was used to predict growth and carbon flux patterns during PHA‐producing conditions (Beckers et al., 2016). A draft metabolic model of the P. putida H strain was created based on the genome sequence of the wild type (Vizoso et al., 2015). Flux balance analysis used the COBRA Toolbox v2.0 (Schellenberger et al., 2011) within the MATLAB environment (The MathWorks Inc., MA, USA), using Gurobi Optimization (Gurobi GmbH, Berlin, Germany) for solving the linear programming problem. The constraint‐based model comprised 70 reactions, of which 16 reversible conversions in 8 exchange reactions (Supporting information). The precursor demand for biomass formation was taken from previous work (Poblete‐Castro et al., 2013). As usual in stoichiometric modelling, the reaction network was balanced regarding elemental composition, charge and degree of reduction (Roels, 1980).
Statistical analysis
All shake flask experiments were conducted as three biological replicates and average values were shown with deviation of the repetition as error bars. Experiments in bioreactors were carried out in duplicates. Using GraphPad Prism 5.0 (GraphPad Software, Inc., San Diego, CA, USA), we compared the resulting values of the groups via one‐way analysis of variance (ANOVA). Differences between groups were considered significant at a P value of < 0.05.
Conflict of interest
None declared.
Supporting information
Fig. S1. Robustness analysis of the catechol branch of P. putida H with a benzoate uptake rate set at 2.4 [mmol (gCDW×h)‐1].
Table S1. Oligos employed in this work.
Table S2. In‐silico model of Pseudomonas putida H.
Acknowledgments
Ignacio Poblete‐Castro acknowledges financial support from ANID (Fondecyt 11150174), (INACH RG_17_19), (ANID‐PIA‐Anillo INACH ACT192057). Carla Aravena‐Carrasco and Matias Orellana‐Saez acknowledge scholarships provided by Doctorado en Biotecnología (UNAB). Christoph Wittmann acknowledges support by the German Ministry for Education and Research (BMBF) through the grant LignoValue (FKZ 031B0344A) and by the German Research Foundation (FKZ INST 256/418‐1).
Microb. Biotechnol. (2021) 14(6), 2385–2402
Funding InformationIgnacio Poblete‐Castro acknowledges financial support from ANID (Fondecyt 11150174), (INACH RG_17_19), (ANID‐PIA‐Anillo INACH ACT192057). Carla Aravena‐Carrasco and Matias Orellana‐Saez acknowledge scholarships provided by Doctorado en Biotecnología (UNAB). Christoph Wittmann acknowledges support by the German Ministry for Education and Research (BMBF) through the grant LignoValue (FKZ 031B0344A) and by the German Research Foundation (FKZ INST 256/418‐1).
Contributor Information
Christoph Wittmann, Email: christoph.wittmann@uni-saarland.de.
Ignacio Poblete‐Castro, Email: ignacio.poblete@unab.cl.
References
- Barnsley, E.A. (1976) Role and regulation of the ortho and meta pathways of catechol metabolism in pseudomonads metabolizing naphthalene and salicylate. J Bacteriol 125: 404–408. [DOI] [PMC free article] [PubMed] [Google Scholar]
- Barton, N. , Horbal, L. , Starck, S. , Kohlstedt, M. , Luzhetskyy, A. , and Wittmann, C. (2018) Enabling the valorization of guaiacol‐based lignin: Integrated chemical and biochemical production of cis, cis‐muconic acid using metabolically engineered Amycolatopsis sp ATCC 39116. Metab Eng 45: 200–210. [DOI] [PubMed] [Google Scholar]
- Becker, J. , Kuhl, M. , Kohlstedt, M. , Starck, S. , and Wittmann, C. (2018) Metabolic engineering of Corynebacterium glutamicum for the production of cis, cis‐muconic acid from lignin. Microb Cell Fact 17: 115. [DOI] [PMC free article] [PubMed] [Google Scholar]
- Becker, J. , and Wittmann, C. (2019) A field of dreams: Lignin valorization into chemicals, materials, fuels, and health‐care products. Biotechnol Adv 37: 107360. [DOI] [PubMed] [Google Scholar]
- Beckers, V. , Poblete‐Castro, I. , Tomasch, J. , and Wittmann, C. (2016) Integrated analysis of gene expression and metabolic fluxes in PHA‐producing Pseudomonas putida grown on glycerol. Microb Cell Fact 15: 17. [DOI] [PMC free article] [PubMed] [Google Scholar]
- Benedetti, I. , de Lorenzo, V. , and Nikel, P. I. (2016) Genetic programming of catalytic Pseudomonas putida biofilms for boosting biodegradation of haloalkanes. Metab Eng 33: 109–118. [DOI] [PubMed] [Google Scholar]
- Bin, C. , and Kai‐Chee, L. (2008) Catabolic pathways and cellular responses of Pseudomonas putida P8 during growth on benzoate with a proteomics approach. Biotechnol Bioeng 101: 1297–1312. [DOI] [PubMed] [Google Scholar]
- Borrero‐de Acuña, J.M. , Aravena‐Carrasco, C. , Gutierrez‐Urrutia, I. , Duchens, D. , and Poblete‐Castro, I. (2019) Enhanced synthesis of medium‐chain‐length poly(3‐hydroxyalkanoates) by inactivating the tricarboxylate transport system of Pseudomonas putida KT2440 and process development using waste vegetable oil. Process Biochem 77: 23–30. [Google Scholar]
- Borrero‐de Acuña, J. . , Bielecka, A. , Häussler, S. , Schobert, M. , Jahn, M. , Wittmann, C. , et al. (2014) Production of medium chain length polyhydroxyalkanoate in metabolic flux optimized Pseudomonas putida . Microb Cell Fact 13: 88. [DOI] [PMC free article] [PubMed] [Google Scholar]
- Borrero‐de Acuña, J.M. , Hidalgo‐Dumont, C. , Pacheco, N. , Cabrera, A. , and Poblete‐Castro, I. (2017) A novel programmable lysozyme‐based lysis system in Pseudomonas putida for biopolymer production. Sci Rep 7: 4373. [DOI] [PMC free article] [PubMed] [Google Scholar]
- Castilho, L.R. , Mitchell, D.A. , and Freire, D.M.G. (2009) Production of polyhydroxyalkanoates (PHAs) from waste materials and by‐products by submerged and solid‐state fermentation. Bioresour Technol 100: 5996–6009. [DOI] [PubMed] [Google Scholar]
- Chen, G.‐Q. , and Jiang, X.‐R. (2018) Engineering microorganisms for improving polyhydroxyalkanoate biosynthesis. Curr Opin Biotechnol 53: 20–25. [DOI] [PubMed] [Google Scholar]
- Choi, S.Y. , Rhie, M.N. , Kim, H.T. , Joo, J.C. , Cho, I.J. , Son, J. , et al. (2019) Metabolic engineering for the synthesis of polyesters: A 100‐year journey from polyhydroxyalkanoates to non‐natural microbial polyesters. Metab Eng 58: 47–81. [DOI] [PubMed] [Google Scholar]
- Davis, R. , Duane, G. , Kenny, S.T. , Cerrone, F. , Guzik, M.W. , Babu, R.P. , et al. (2015) High cell density cultivation of Pseudomonas putida KT2440 using glucose without the need for oxygen enriched air supply. Biotechnol Bioeng 112: 725–733. [DOI] [PubMed] [Google Scholar]
- Dietrich, K. , Dumont, M.‐J. , Del Rio, L.F. , and Orsat, V. (2019) Sustainable PHA production in integrated lignocellulose biorefineries. N Biotechnol 49: 161–168. [DOI] [PubMed] [Google Scholar]
- van Duuren, J. , Puchalka, J. , Mars, A. , Bucker, R. , Eggink, G. , Wittmann, C. , and dos Santos, V.A.P. (2013) Reconciling in vivo and in silico key biological parameters of Pseudomonas putida KT2440 during growth on glucose under carbon‐limited condition. BMC Biotechnol 13: 93. [DOI] [PMC free article] [PubMed] [Google Scholar]
- van Duuren, J. , Wijte, D. , Leprince, A. , Karge, B. , Puchalka, J. , Wery, J. , et al. (2011) Generation of a catR deficient mutant of P. putida KT2440 that produces cis, cis‐muconate from benzoate at high rate and yield. J Biotechnol 156: 163–172. [DOI] [PubMed] [Google Scholar]
- van Duuren, J.B.J.H. , de Wild, P.J. , Starck, S. , Bradtmöller, C. , Selzer, M. , Mehlmann, K. , et al. (2020) Limited life cycle and cost assessment for the bioconversion of lignin‐derived aromatics into adipic acid. Biotechnol Bioeng 117: 1381–1393. [DOI] [PubMed] [Google Scholar]
- Edwards, J.S. , and Palsson, B.O. (2000) Robustness analysis of the Escherichia coli metabolic network. Biotechnol Prog 16: 927–939. [DOI] [PubMed] [Google Scholar]
- Gläser, L. , Kuhl, M. , Jovanovic, S. , Fritz, M. , Vögeli, B. , Erb, T.J. , et al. (2020) A common approach for absolute quantification of short chain CoA thioesters in prokaryotic and eukaryotic microbes. Microb Cell Fact 19: 160. [DOI] [PMC free article] [PubMed] [Google Scholar]
- Hamzah, R.Y. , and Al‐Baharna, B.S. (1994) Catechol ring‐cleavage in Pseudomonas cepacia: the simultaneous induction of ortho and meta pathways. Appl Microbiol Biotechnol 41: 250–256. [Google Scholar]
- Han, L. , Liu, P. , Sun, J. , Wu, Y. , Zhang, Y. , Chen, W. , et al. (2015) Engineering catechol 1, 2‐dioxygenase by design for improving the performance of the cis, cis‐muconic acid synthetic pathway in Escherichia coli . Sci Rep 5: 13435. [DOI] [PMC free article] [PubMed] [Google Scholar]
- Heipieper, H. , Diefenbach, R. , and Keweloh, H. (1992) Conversion of cis unsaturated fatty acids to trans, a possible mechanism for the protection of phenol‐degrading Pseudomonas putida P8 from substrate toxicity. Appl Environ Microbiol 58: 1847–1852. [DOI] [PMC free article] [PubMed] [Google Scholar]
- Herrmann, H. , Janke, D. , Krejsa, S. , and Kunze, I. (1987) Involvement of the plasmid pPGH1 in the phenol degradation of Pseudomonas putida strain H. FEMS Microbiol Lett 43: 133–137. [Google Scholar]
- Herrmann, H. , Müller, C. , Schmidt, I. , Mahnke, J. , Petruschka, L. , and Hahnke, K. (1995) Localization and organization of phenol degradation genes of Pseudomonas putida strain H. Mol Gen Genet MGG 247: 240–246. [DOI] [PubMed] [Google Scholar]
- Jiménez, J.I. , Miñambres, B. , García, J.L. , and Díaz, E. (2002) Genomic analysis of the aromatic catabolic pathways from Pseudomonas putida KT2440. Environ Microbiol 4: 824–841. [DOI] [PubMed] [Google Scholar]
- Jiménez, J.I. , Pérez‐Pantoja, D. , Chavarría, M. , Díaz, E. , and de Lorenzo, V. (2014) A second chromosomal copy of the catA gene endows Pseudomonas putida mt‐2 with an enzymatic safety valve for excess of catechol. Environ Microbiol 16: 1767–1778. [DOI] [PubMed] [Google Scholar]
- Johnson, C.W. , Abraham, P.E. , Linger, J.G. , Khanna, P. , Hettich, R.L. , and Beckham, G.T. (2017) Eliminating a global regulator of carbon catabolite repression enhances the conversion of aromatic lignin monomers to muconate in Pseudomonas putida KT2440. Metab Eng Commun 5: 19–25. [DOI] [PMC free article] [PubMed] [Google Scholar]
- Johnson, C.W. , and Beckham, G.T. (2015) Aromatic catabolic pathway selection for optimal production of pyruvate and lactate from lignin. Metab Eng 28: 240–247. [DOI] [PubMed] [Google Scholar]
- Kiesel, B. , and Müller, R.H. (2002) The meta pathway as a potential energy‐generating sequence and its effects on the growth rate during the utilisation of aromatics. Acta Biotechnol 22: 221–234. [Google Scholar]
- Kind, S. , Neubauer, S. , Becker, J. , Yamamoto, M. , Völkert, M. , von Abendroth, G. , et al. (2014) From zero to hero – Production of bio‐based nylon from renewable resources using engineered Corynebacterium glutamicum . Metab Eng 25: 113–123. [DOI] [PubMed] [Google Scholar]
- Klinke, S. , Dauner, M. , Scott, G. , Kessler, B. , and Witholt, B. (2000) Inactivation of isocitrate lyase leads to increased production of medium‐chain‐length poly(3‐hydroxyalkanoates) in Pseudomonas putida . Appl Env Microbiol 66: 909–913. [DOI] [PMC free article] [PubMed] [Google Scholar]
- Kohlstedt, M. , Starck, S. , Barton, N. , Stolzenberger, J. , Selzer, M. , Mehlmann, K. , et al. (2018) From lignin to nylon: Cascaded chemical and biochemical conversion using metabolically engineered Pseudomonas putida . Metab Eng 47: 279–293. [DOI] [PubMed] [Google Scholar]
- Kukurugya, M.A. , Mendonca, C.M. , Solhtalab, M. , Wilkes, R.A. , Thannhauser, T.W. , and Aristilde, L. (2019) Multi‐omics analysis unravels a segregated metabolic flux network that tunes co‐utilization of sugar and aromatic carbons in Pseudomonas putida . J Biol Chem 294: 8464–8479. [DOI] [PMC free article] [PubMed] [Google Scholar]
- Linger, J.G. , Vardon, D.R. , Guarnieri, M.T. , Karp, E.M. , Hunsinger, G.B. , Franden, M.A. , et al. (2014) Lignin valorization through integrated biological funneling and chemical catalysis. Proc Natl Acad Sci 111: 12013–12018. [DOI] [PMC free article] [PubMed] [Google Scholar]
- Liu, Z.‐H. , Olson, M.L. , Shinde, S. , Wang, X. , Hao, N. , Yoo, C.G. , et al. (2017) Synergistic maximization of the carbohydrate output and lignin processability by combinatorial pretreatment. Green Chem 19: 4939–4955. [Google Scholar]
- Madison, L.L. , and Huisman, G.W. (1999) Metabolic engineering of Poly(3‐Hydroxyalkanoates): From DNA to plastic. Microbiol Mol Biol Rev 63: 21–53. [DOI] [PMC free article] [PubMed] [Google Scholar]
- Martínez‐García, E. , Aparicio, T. , Goñi‐Moreno, A. , Fraile, S. , and de Lorenzo, V. (2015) SEVA 2.0: an update of the Standard European Vector Architecture for de‐/re‐construction of bacterial functionalities. Nucleic Acids Res 43: D1183–D1189. [DOI] [PMC free article] [PubMed] [Google Scholar]
- Martínez‐García, E. , and de Lorenzo, V. (2011) Engineering multiple genomic deletions in Gram‐negative bacteria: analysis of the multi‐resistant antibiotic profile of Pseudomonas putida KT2440. Environ Microbiol 13: 2702–2716. [DOI] [PubMed] [Google Scholar]
- Mrozik, A. , Łabużek, S. , and Piotrowska‐Seget, Z. (2005) Changes in fatty acid composition in Pseudomonas putida and Pseudomonas stutzeri during naphthalene degradation. Microbiol Res 160: 149–157. [DOI] [PubMed] [Google Scholar]
- Nikodinovic, J. , Kenny, S.T. , Babu, R.P. , Woods, T. , Blau, W.J. , and O’Connor, K.E. (2008) The conversion of BTEX compounds by single and defined mixed cultures to medium‐chain‐length polyhydroxyalkanoate. Appl Microbiol Biotechnol 80: 665–673. [DOI] [PubMed] [Google Scholar]
- Oliva‐Arancibia, B. , Órdenes‐Aenishanslins, N. , Bruna, N. , Ibarra, P.S. , Zacconi, F.C. , Pérez‐Donoso, J.M. , and Poblete‐Castro, I. (2017) Co‐synthesis of medium‐chain‐length polyhydroxyalkanoates and CdS quantum dots nanoparticles in Pseudomonas putida KT2440. J Biotechnol 264: 29–37. [DOI] [PubMed] [Google Scholar]
- Orellana‐Saez, M. , Pacheco, N. , Costa, J.I. , Mendez, K.N. , Miossec, M.J. , Meneses, C. , et al. (2019) In‐depth genomic and phenotypic characterization of the antarctic psychrotolerant strain Pseudomonas sp. MPC6 reveals unique metabolic features, plasticity, and biotechnological potential. Front Microbiol 10: 1154. [DOI] [PMC free article] [PubMed] [Google Scholar]
- Pacheco, N. , Orellana‐Saez, M. , Pepczynska, M. , Enrione, J. , Bassas‐Galia, M. , Borrero‐de Acuña, J.M. , et al. (2019) Exploiting the natural poly(3‐hydroxyalkanoates) production capacity of Antarctic Pseudomonas strains: from unique phenotypes to novel biopolymers. J Ind Microbiol Biotechnol 46: 1139–1153. [DOI] [PubMed] [Google Scholar]
- Poblete‐Castro, I. , Aravena‐Carrasco, C. , Orellana‐Saez, M. , Pacheco, N. , Cabrera, A. , and Borrero‐de Acuña, J.M. (2020) Engineering the osmotic state of Pseudomonas putida KT2440 for efficient cell disruption and downstream processing of Poly(3‐Hydroxyalkanoates). Front Bioeng Biotechnol 8: 161. [DOI] [PMC free article] [PubMed] [Google Scholar]
- Poblete‐Castro, I. , Binger, D. , Oehlert, R. , and Rohde, M. (2014) Comparison of mcl‐Poly(3‐hydroxyalkanoates) synthesis by different Pseudomonas putida strains from crude glycerol: citrate accumulates at high titer under PHA‐producing conditions. BMC Biotechnol 14: 962. [DOI] [PMC free article] [PubMed] [Google Scholar]
- Poblete‐Castro, I. , Binger, D. , Rodrigues, A. , Becker, J. , Martins Dos Santos, V.A.P. , and Wittmann, C. (2013) In‐silico‐driven metabolic engineering of Pseudomonas putida for enhanced production of poly‐hydroxyalkanoates. Metab Eng 15: 113–123. [DOI] [PubMed] [Google Scholar]
- Poblete‐Castro, I. , Borrero‐de Acuña, J.M. , Nikel, P.I. , Kohlstedt, M. , and Wittmann, C. (2017) Host organism: Pseudomonas putida . Indust Biotechnol 71:299–326. [Google Scholar]
- Poblete‐Castro, I. , Rodriguez, A.L. , Lam, C.M.C. , and Kessler, W. (2014) Improved production of medium‐chain‐length polyhydroxyalkanoates in glucose‐based fed‐batch cultivations of metabolically engineered Pseudomonas putida strains. J Microbiol Biotechnol 24: 59–69. [DOI] [PubMed] [Google Scholar]
- Poblete‐Castro, I. , Wittmann, C. , and Nikel, P.I. (2019) Biochemistry, genetics and biotechnology of glycerol utilization in Pseudomonas species. Microb Biotechnol 12: 98–124.. [DOI] [PMC free article] [PubMed] [Google Scholar]
- Prieto, A. , Escapa, I.F. , Martínez, V. , Dinjaski, N. , Herencias, C. , de la Peña, F. , et al. (2016) A holistic view of polyhydroxyalkanoate metabolism in Pseudomonas putida . Environ Microbiol 18: 341–357. [DOI] [PubMed] [Google Scholar]
- Reva, O.N. , Weinel, C. , Weinel, M. , Böhm, K. , Stjepandic, D. , Hoheisel, J.D. , and Tümmler, B. (2006) Functional genomics of stress response in Pseudomonas putida KT2440. J Bacteriol 188: 4079–4092. [DOI] [PMC free article] [PubMed] [Google Scholar]
- Roels, J.A. (1980) Application of macroscopic principles to microbial metabolism. Biotechnol Bioeng 22: 2457–2514. [DOI] [PubMed] [Google Scholar]
- Salvachúa, D. , Rydzak, T. , Auwae, R. , De Capite, A. , Black, B.A. , Bouvier, J.T. , et al. (2020) Metabolic engineering of Pseudomonas putida for increased polyhydroxyalkanoate production from lignin. Microb Biotechnol 13: 290–298. [DOI] [PMC free article] [PubMed] [Google Scholar]
- Schellenberger, J. , Que, R. , Fleming, R. M.T. , Thiele, I. , Orth, J.D. , Feist, A.M. , et al. (2011) Quantitative prediction of cellular metabolism with constraint‐based models: the COBRA Toolbox v2.0. Nat Protoc 6: 1290–1307. [DOI] [PMC free article] [PubMed] [Google Scholar]
- Shields‐Menard, S.A. , AmirSadeghi, M. , Green, M. , Womack, E. , Sparks, D.L. , Blake, J. , et al. (2017) The effects of model aromatic lignin compounds on growth and lipid accumulation of Rhodococcus rhodochrous . Int Biodeterior Biodegradation 121: 79–90. [Google Scholar]
- Silva‐Rocha, R. , and de Lorenzo, V. (2014) The pWW0 plasmid imposes a stochastic expression regime to the chromosomal ortho pathway for benzoate metabolism in Pseudomonas putida . FEMS Microbiol Lett 356: 176–183. [DOI] [PubMed] [Google Scholar]
- Vizoso, P. , Pacheco, N. , Bastias‐Molina, M. , Meneses, C. , and Poblete‐Castro, I. (2015) Draft genome sequence of the phenol‐degrading bacterium Pseudomonas putida H. Genome Announc 3: e00936‐15. [DOI] [PMC free article] [PubMed] [Google Scholar]
- Weimer, A. , Kohlstedt, M. , Volke, D.C. , Nikel, P.I. , and Wittmann, C. (2020) Industrial biotechnology of Pseudomonas putida: advances and prospects. Appl Microbiol Biotechnol 104: 7745–7766. [DOI] [PMC free article] [PubMed] [Google Scholar]
- Widdel, F. , and Pfennig, N. (1981) Studies on dissimilatory sulfate‐reducing bacteria that decompose fatty acids. Arch Microbiol 129: 395–400. [DOI] [PubMed] [Google Scholar]
- Xu, Z. , Li, X. , Hao, N. , Pan, C. , de la torre, L. , Ahamed, A. , et al. (2019) Kinetic understanding of nitrogen supply condition on biosynthesis of polyhydroxyalkanoate from benzoate by Pseudomonas putida KT2440. Bioresour Technol 273: 538–544. [DOI] [PubMed] [Google Scholar]
- Zhang, J. , Shishatskaya, E.I. , Volova, T.G. , da Silva, L.F. , and Chen, G.‐Q. (2018) Polyhydroxyalkanoates (PHA) for therapeutic applications. Mater Sci Eng C 86: 144–150. [DOI] [PubMed] [Google Scholar]
- Zobel, S. , Benedetti, I. , Eisenbach, L. , de Lorenzo, V. , Wierckx, N. , and Blank, L. M. (2015) Tn7‐based device for calibrated heterologous gene expression in Pseudomonas putida . ACS Synth Biol 4: 1341–1351. [DOI] [PubMed] [Google Scholar]
Associated Data
This section collects any data citations, data availability statements, or supplementary materials included in this article.
Supplementary Materials
Fig. S1. Robustness analysis of the catechol branch of P. putida H with a benzoate uptake rate set at 2.4 [mmol (gCDW×h)‐1].
Table S1. Oligos employed in this work.
Table S2. In‐silico model of Pseudomonas putida H.