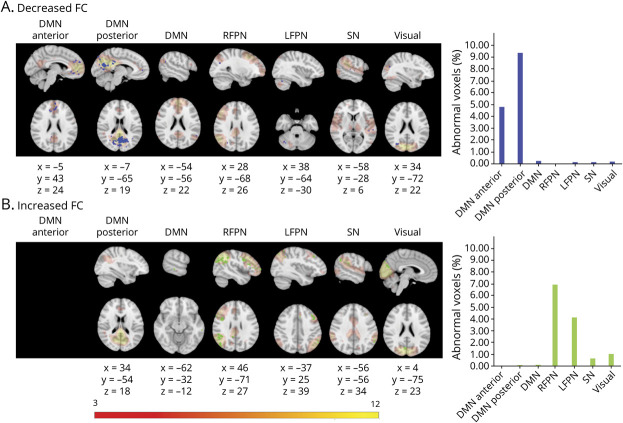
Figure 1. FC Abnormalities in CI Compared to CP Patients.
Figure shows voxels showing functional connectivity (FC) abnormalities in cognitively impaired (CI) compared to cognitively preserved (CP) patients overlaid onto the group average spatial map of each resting-state network (RSN) analyzed in red-yellow. First 7 columns in each panel show each of the RSNs investigated: default mode network (DMN) anterior, DMN posterior, DMN, right frontoparietal network (RFPN), left frontoparietal network (LFPN), salience network (SN), and primary visual network. For networks not displayed, no significant group differences were found. The 8 columns show graphs indicating the percentage of voxels showing abnormalities of the total number of voxels in the network. Rows show areas of (A) decreased FC in the CI group vs CP (in blue) and (B) increased FC in CI group (in green). Results were threshold-free cluster enhancement corrected at p ≤ 0.05, 2 sided. Montreal Neurological Institute coordinates are given for results displayed. Color bar shows signal intensity of RSNs.

