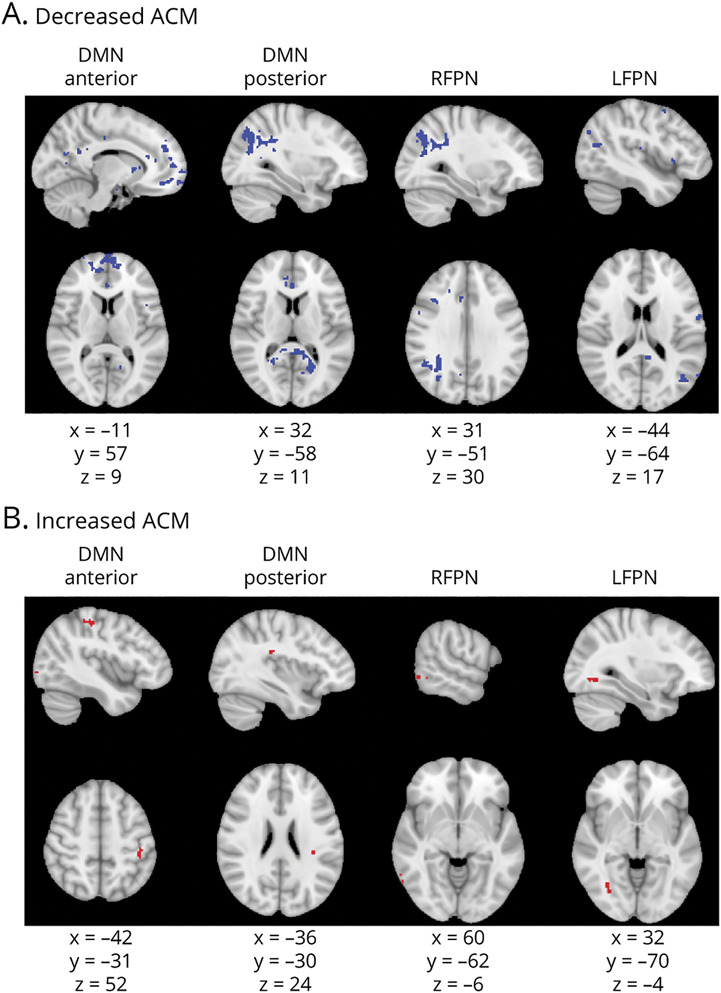
Figure 2. Anatomic Connectivity Changes in Cognitively Impaired Compared to Cognitively Preserved Patients Based on a Voxelwise Analysis of ACMs.

Figure shows voxels showing anatomic connectivity map (ACM) value abnormalities. Columns show each of the resting-state networks compared. First row (A) shows areas of decreased ACM values (in blue); second row (B) shows areas of increased ACM values (in red). Montreal Neurological Institute coordinates are given for the biggest voxel clusters displayed. Results were threshold-free cluster enhancement corrected at p ≤ 0.05, 2-sided. DMN = default mode network; LFPN = left frontoparietal network; RFPN = right frontoparietal network.
