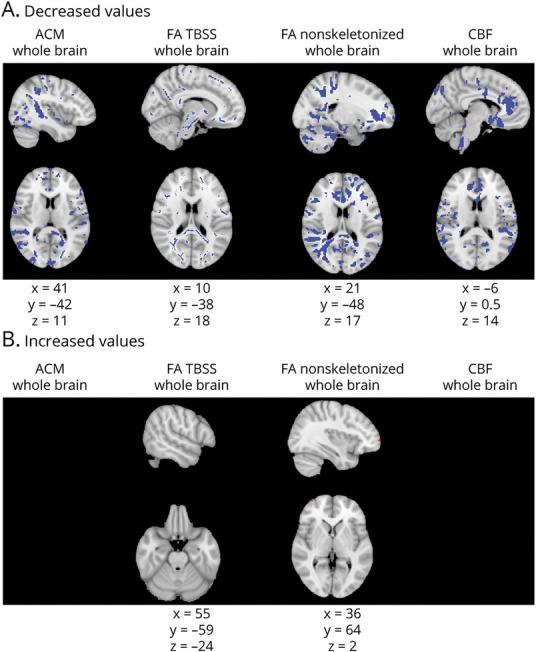
Figure 5. Diffuse ACM, FA, and CBF Changes Across the Whole Brain in CI Compared to CP Patients.

Figure shows anatomic connectivity map (ACM), fractional anisotropy (FA), and cerebral blood flow (CBF) abnormalities throughout the brain. Columns show each of the metrics assessed: ACM, FA from tract-based spatial statistics (TBSS), FA from analysis of nonskeletonized FA maps, and CBF, in that order. First row (A) shows areas of decreased values (in blue); second row (B) shows areas of increased values (in red). Montreal Neurological Institute coordinates are given for the biggest voxel clusters displayed. Results were threshold-free cluster enhancement corrected at p ≤ 0.05, 2 sided.
