

Abstract
Cryo-correlative light and electron microscopy (CLEM) is a technique that uses the spatiotemporal cues from fluorescence light microscopy (FLM) to investigate the high-resolution ultrastructure of biological samples by cryo-electron microscopy (cryo-EM). Cryo-CLEM provides advantages for identifying and distinguishing fluorescently labeled proteins, macromolecular complexes, and organelles from the cellular environment. Challenges remain on how correlation workflows and software tools are implemented on different microscope platforms to support automated cryo-EM data acquisition. Here, we present CorRelator: an open-source desktop application that bridges between cryo-FLM and real-time cryo-EM/ET automated data collection. CorRelator implements a pixel-coordinate-to-stage-position transformation for flexible, high accuracy on-the-fly and post-acquisition correlation. CorRelator can be integrated into cryo-CLEM workflows and easily adapted to standard fluorescence and transmission electron microscope (TEM) system configurations. CorRelator was benchmarked under live-cell and cryogenic conditions using several FLM and TEM instruments, demonstrating that CorRelator reliably supports real-time, automated correlative cryo-EM/ET acquisition, through a combination of software-aided and interactive alignment. CorRelator is a cross-platform software package featuring an intuitive Graphical User Interface (GUI) that guides the user through the correlation process. CorRelator source code is available at: https://github.com/wright-cemrc-projects/corr.
Keywords: Correlative light and electron microscopy, Cryo-fluorescence microscopy, Cryo-electron microscopy, Cryo-electron tomography, Alignment, Algorithm
1. Introduction
Correlative light and electron microscopy (CLEM), the coupling of fluorescent light microscopy (FLM) and transmission electron microscopy (TEM), adds temporal and spatial information from FLM to the high-resolution structural information of EM, facilitating identification of rare or dynamic events during host-virus interactions (Afzelius & Maunsbach, 2004; Bharat & Kukulski, 2019; Bykov et al., 2016; Ganeva & Kukulski, 2020; Laue, 2010; Romero-Brey, 2018). To preserve cellular structures and overall specimen integrity, biological samples undergo steps of fixation prior to EM imaging (McDonald, 2009; Passmore & Russo, 2016; Romero-Brey, 2018; Romero-Brey and Bartenschlager, 2015; Studer et al., 2008; Thompson et al., 2016). Conventional EM methods require chemical fixation or high-pressure freezing prior to resin embedding. These techniques have been used for EM studies of viral infection in cells where preservation of the ultrastructure of viral replication organelles and subcellular membrane structures is essential (Chatel-Chaix et al., 2016; Lee et al., 2019; Melia et al., 2017; Neufeldt et al., 2018; Romero-Brey et al., 2012; Rossignol et al., 2017, 2015). Rapid vitrification of biological specimens by plunge-freezing (Dubochet et al., 1988) helps minimize preparative artifacts typically associated with conventional EM procedures of chemical fixation, dehydration, resin-embedding, and pre or post heavy-metal staining (Baker et al., 2017; Dillard et al., 2018; Lučić et al., 2013; Romero-Brey and Bartenschlager, 2015). Sample vitrification followed by cryo-EM imaging allows for the direct visualization of macromolecular structures on the nanometer- to sub-nanometer-resolution levels in a native frozen-hydrated state (Ertel et al., 2017; Ke et al., 2020a, 2018b, 2018c; Koning et al., 2018; Li et al., 2016; Liu et al., 2020; Luque & Castón, 2020; Peukes et al., 2020; Riedel et al., 2017; Strauss et al., 2016; Sutton et al., 2020; Unchwaniwala et al., 2020; Wan et al., 2017; Zeev-Ben-Mordehai et al., 2016). Cryo-CLEM has proven to be a powerful method for in situ structural studies, including time-dependent events, especially those associated with viral entry, replication, and egress (Briegel et al., 2010; Carter et al., 2020; Hampton et al., 2017; Jun et al., 2011, 2019; Zhang, 2013). For samples that are too thick for direct cryo-EM imaging, cryo-sectioning (Al-Amoudi et al., 2004; Bharat et al., 2018; Chlanda & Sachse, 2014; Salje et al., 2009; Zuber et al., 2008) and/or cryo-focused-ion-beam (FIB) milling (Arnold et al., 2016; Gorelick et al., 2019; Hayles and De Winter, 2021; Hoffman et al., 2020; Hsieh et al., 2014; Mahamid et al., 2015; Marko et al., 2007; Rigort et al., 2012a, 2012b, 2010; Schaffer et al., 2019; Wagner et al., 2020; Wu et al., 2020; Zhu et al., 2021) may be used to expand the applicability of cryo-CLEM and cryo-ET.
In cryo-CLEM, sample vitrification can be performed either before or after fluorescence imaging (Briegel et al., 2010; Ganeva & Kukulski, 2020). Fluorescence imaging of a specimen prior to cryo-preservation is valuable because of the improved resolution of immersion-objective microscopes and options for dynamic, time-resolved imaging (Fu et al., 2019; Jun et al., 2011; Sartori-Rupp et al., 2019; Tao et al., 2018). However, specimen states observed prior to cryo-immobilization may change, be disrupted, or damaged by the vitrification process or sample manipulation, thereby limiting the correlation precision. Cryo-fluorescence light microscopes (cryo-FLM) equipped with dedicated ‘cryo-stages’ that maintain specimens well below −150 °C have made it possible to correlate biological events with cryo-EM/ET on identical samples. In recent years, various solutions have been introduced to optimize low-temperature imaging, to reduce the number of grid transfer steps, and to realize high-resolution cryo-FLM. These include the development and use of stable cryo-stages (Briegel et al., 2010; Jun et al., 2011; Li et al., 2018; Rigort et al., 2010, 2012a, 2012b; Sartori et al., 2007; Schellenberger et al., 2014; Schorb & Briggs, 2014; Schwartz et al., 2007; Tao et al., 2018; van Driel et al., 2009), integrated cryo-FLM and -EM systems (Agronskaia et al., 2008; Faas et al., 2013; Gorelick et al., 2019), high numerical-aperture (NA) cryo-objective lenses (Faoro et al., 2018; Le Gros et al., 2009; Li et al., 2018; Nahmani et al., 2017; Schorb et al., 2017; Wang et al., 2019), and cryogenic fluorescent labeling (Carter et al., 2018; Chang et al., 2014; Dahlberg et al., 2018; Liu et al., 2015; Moser et al., 2019; Schorb & Briggs, 2014; Schwartz et al., 2007; Tuijtel et al., 2019). In addition, super-resolution cryo-CLEM systems have also been explored, aiming to further bridge the resolution gap between LM and EM imaging modalities (Chang et al., 2014; Hoffman et al., 2020; Kaufmann et al., 2014; Liu et al., 2015; Moser et al., 2019; Nahmani et al., 2017; Tuijtel et al., 2019; Wang et al., 2019; Weisenburger et al., 2017; Wolff et al., 2016).
Cryo-correlation typically proceeds in two steps, on-the-fly targeting and post-acquisition superposition. On-the-fly correlation guides cryo-EM/ET data collection to regions of interest (ROI), while post-acquisition mapping allows for precise translation of fluorescent signals to reveal ultrastructural details of targeted or potentially unknown objects in acquired cryo-EM images or cryo-ET 3D volumes. In order to facilitate targeting, TEM grids may be marked with numbers and letters (i.e., finder grids) to aid in an initial rough correlation process. Application of fiducial markers to the sample before vitrification, such as fluorescent electron-dense microspheres, can support finer-scale correlations of approximately 10 to 100 nm (Fokkema et al., 2018; Fu et al., 2019; Fukuda et al., 2014; Kukulski et al., 2011; Li et al., 2018; Schellenberger et al., 2014; Schorb & Briggs, 2014; Schorb et al., 2017). A less common approach is to use EM grid support features, including holes and imperfections in the carbon film, to achieve marker-free correlative alignment (Anderson et al., 2018; Dahlberg et al., 2020; Sun et al., 2019). In all cases, there are still difficulties to overcome. First, the distribution of fiducial markers across the entire grid needs to be relatively uniform for alignments to be reliable. The optimized density must be high enough to provide good alignment, but low enough not to obscure fluorescent signals from ROIs. Second, bent, warped, or crinkled vitrified grids and uneven ice-thickness hinder automated detection of the holes in the carbon films, leading to poor matching and relocation of the same hole on both maps. Therefore, interactive alignment that integrates software-aided automation while including necessary user intervention is needed for quick and reliable registration.
A number of research groups have developed workflows, software or scripts to facilitate the coordinate transfer step (Anderson et al., 2018; Arnold et al., 2016; Fu et al., 2019; Fukuda et al., 2014; Gorelick et al., 2019; Jun et al., 2011; Kukulski et al., 2011; Paul-Gilloteaux et al., 2017; Rigort et al., 2010, 2012a, 2012b; Sartori et al., 2007; Schellenberger et al., 2014; Schorb & Briggs, 2014; Schorb et al., 2017; Schorb & Sieckmann, 2017; Schwartz et al., 2007; van Driel et al., 2009). Many tools for correlative microscopy are available to the community and support accurate translations of fluorescent ROIs across various microscopy systems. Several options either require access to licensed materials such as MATLAB (MathWorks, Natick, MA, USA) or experience with programming languages (Fu et al., 2019; Fukuda et al., 2014; Kukulski et al., 2011; Rigort et al., 2010; van Driel et al., 2009). Others are built for specific workflows and hardware configurations (Gorelick et al., 2019; Li et al., 2018; Tao et al., 2018), or focus on alignment accuracy to deal with multi-dimensional and complicated graphic distortions (Arnold et al., 2016; Paul-Gilloteaux et al., 2017). Previously, Fukuda et al. explored coordinate-based transformation in cryo-FLM to cryo-EM and cryo-FLM to cryo-FIB/SEM (Fukuda et al., 2014). However, the python script was not integrated with live automated data acquisition. Recently, the Py-EM package (Schorb et al., 2019) was developed to interface with the microscope-control platform SerialEM (Mastronarde, 2005) to provide coordinates for multi-target automated acquisition. Significant progress has been made towards real-time precise correlation. There is still a growing need for an “all-in-one” tool that is easy to set up, suitable for both accurate real-time cryo-correlative automated data collection and post-acquisition mapping, and open to adaptation for future multi-modal correlation schemes.
Here we present a cross-platform, user-friendly desktop application called “CorRelator” for feedback-based precise coordinate translation between cryo-FLM and cryo-EM/ET. CorRelator interfaces with SerialEM (Mastronarde, 2005) and employs robust registration and translation on the image pixel coordinate level while incorporating real-time microscope pixel-to-stage-position transformation (Fig. 1). Thus, all the transformations can be completed in CorRelator and saved until the user is ready for setting up automated data acquisition at the ROIs in SerialEM. The flexibility and system-independent nature of the tool for real-time cryo-CLEM data acquisition is validated in combination with SerialEM on live-cell and cryo-FLM of HeLa cells infected with respiratory syncytial virus (RSV). We demonstrate that a combination of software-aided approach and interactive user intervention optimizes alignment performance while accelerating the registration process. To support relocation accuracy, we show that lower lateral spatial resolutions that are commonly present in cryo-FLM data can be improved through advanced computational background cleaning and signal deconvolution processing. As more complex correlative strategies evolve and the demand for open-source system-independent cryo-CLEM setup increases, we believe that this tool will facilitate efforts in a broad-range of multi-modal correlative workflows. CorRelator is open-source and freely available for download at (https://github.com/wright-cemrc-projects/corr).
Fig. 1.
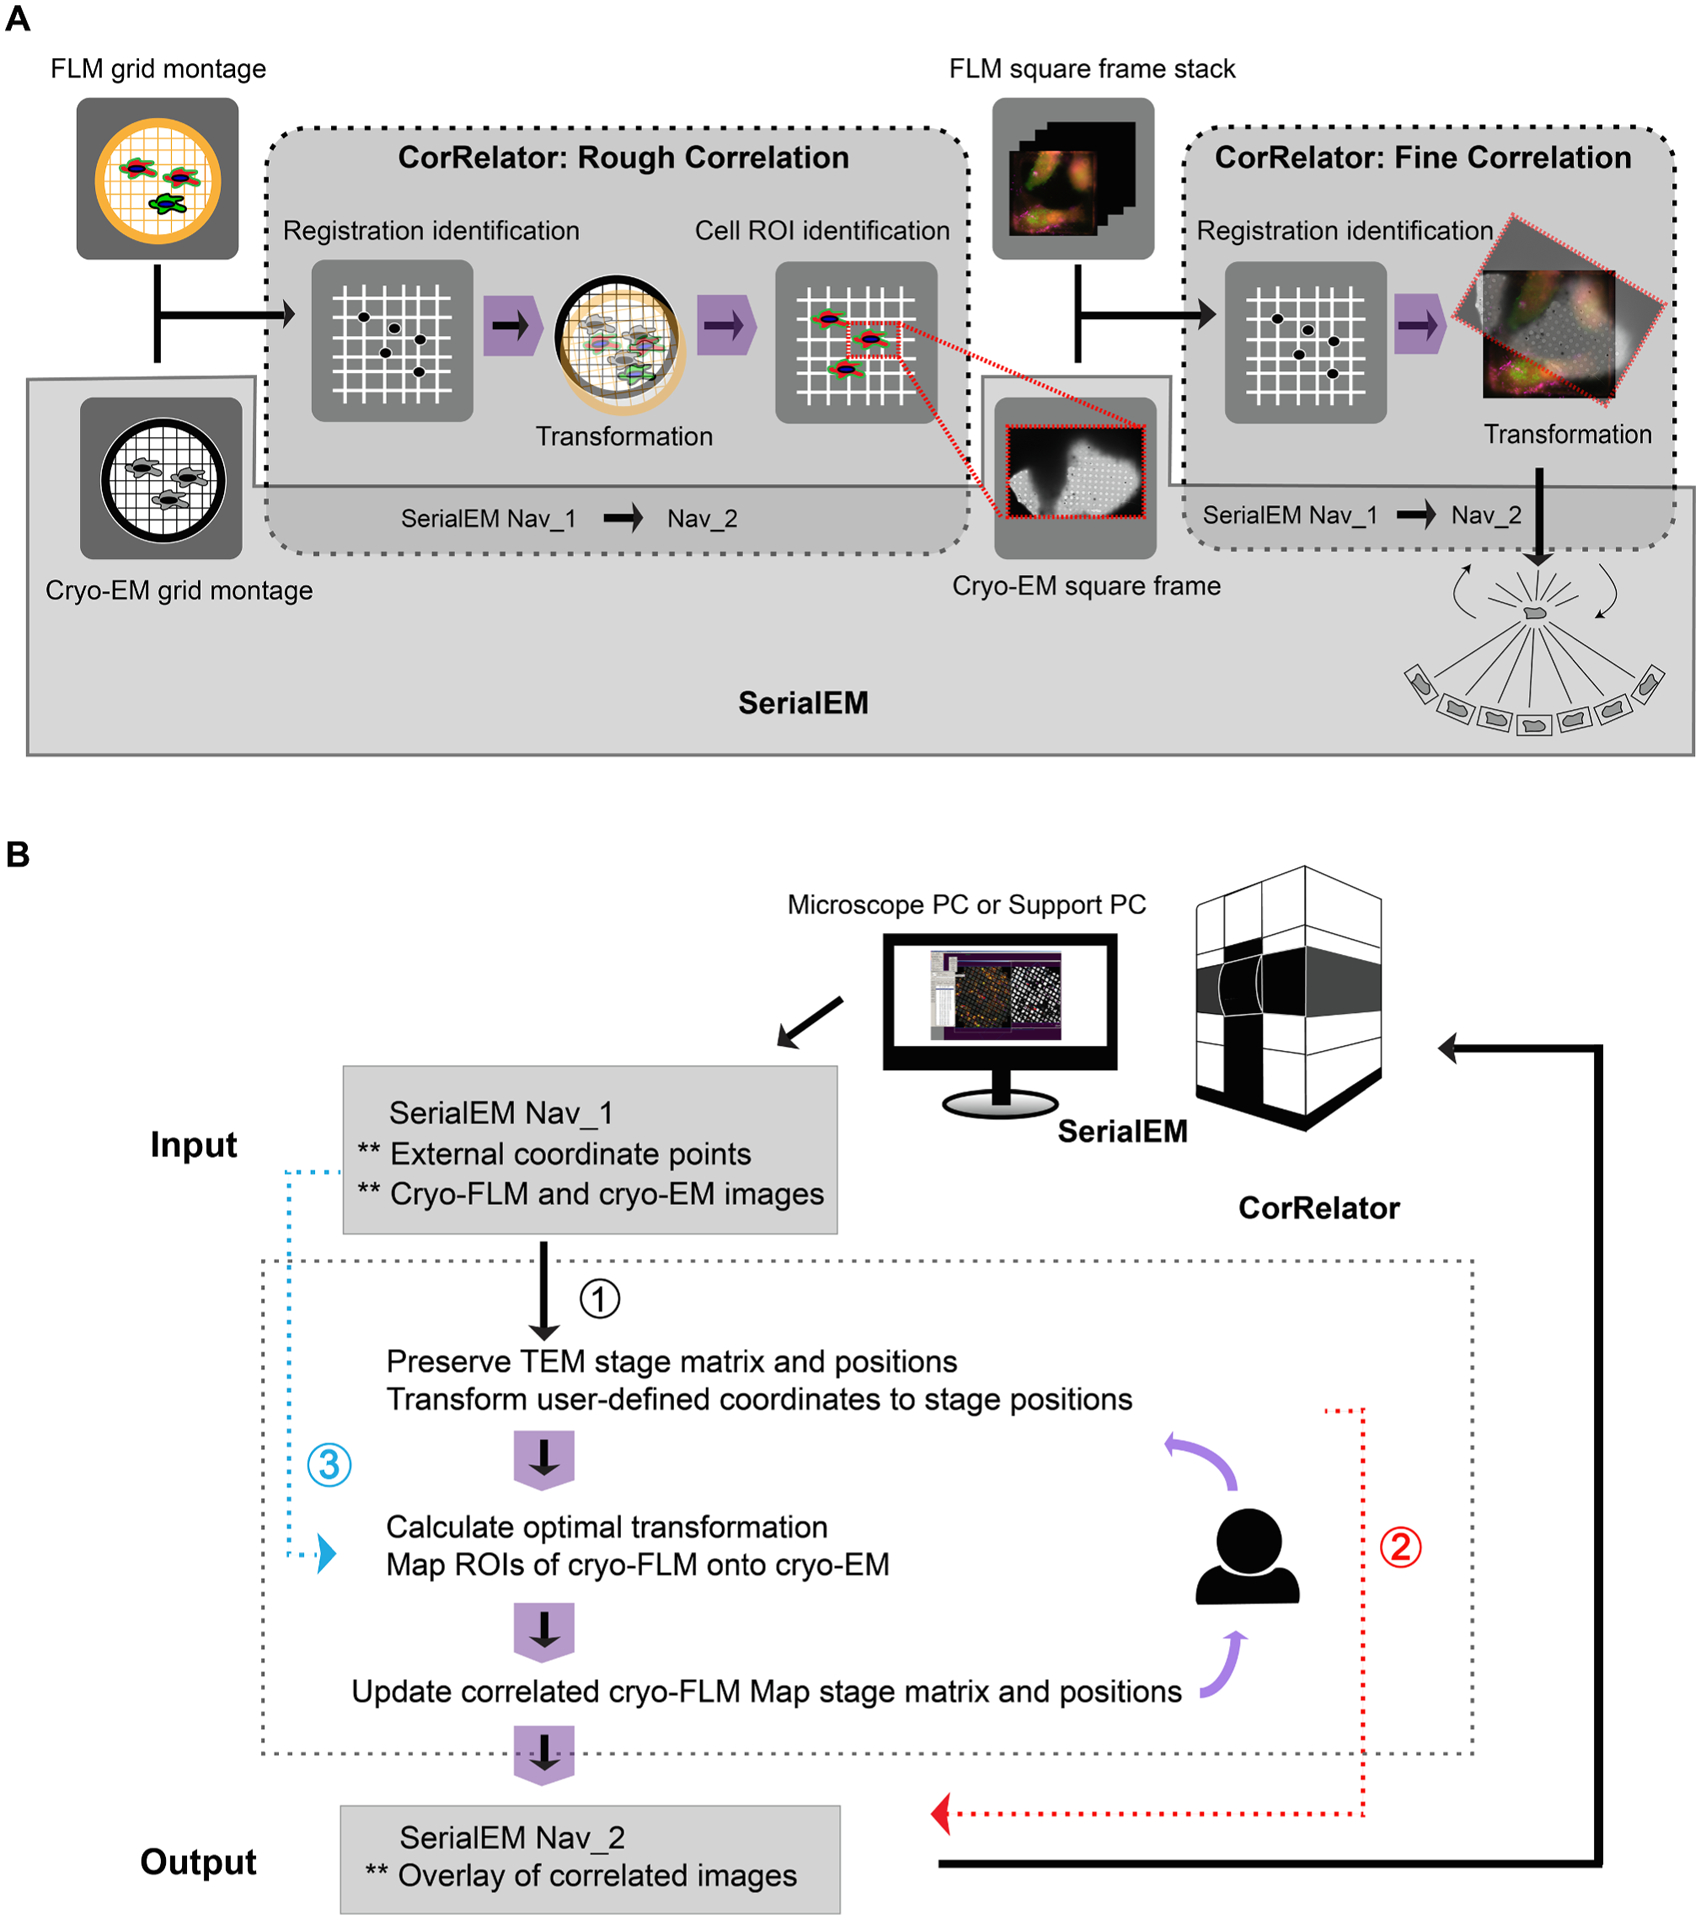
Overview of the cryo-CLEM workflow with CorRelator and SerialEM. (A) Integration of a feedback-based alignment loop in CorRelator with SerialEM. (B) Flowchart for the algorithm implemented in CorRelator that supports three applications for flexible correlations, labeled as ① or ② for on-the-fly cryo-CLEM operation, and ③ for post-acquisition correlation. ** is indicative of optional inputs (e.g., independent csv files, cryo-FLM/EM frames for post-acquisition correlation) and optional outputs (e.g., overlay of correlated cryo-FLM/EM images). The dashed grey box (A and B) highlights the main operations performed in CorRelator, the solid grey box (A) for the main operations in SerialEM, overlap areas for SerialEM navigator file 1(Nav_1) and file 2 (Nav_2) that link CorRelator and SerialEM. Purple arrows (A and B) indicate the iterative flow of user-in-the-loop alignment until an optimal accurate correlation is achieved.
2. Materials and methods
2.1. Cell culture and infection on TEM grids
Quantifoil grids (200 mesh Au R2/2 and Au Finder; Quantifoil Micro Tools GmbH, Großlöbichau, Germany) were coated with an extra layer of carbon for stabilization and then glow discharged for improved hydrophilicity. Some grids were subsequently coated with 100 nm, 200 nm, and 500 nm fluorescent microspheres (TetraSpeck Microspheres, Invitrogen T7279, T7281, USA) at a 500x or 1000x dilution for 5 min, followed with a washing step using 1x PBS. HeLa cells (ATCC CCL-2, ATCC, Manassas, VA, USA) were seeded on the bead-free or bead-coated grids at a density of 0.5–0.75 × 10⁵ cells/mL in glass-bottomed culture dishes (MatTek Corp., MA, USA) (Schellenberger et al., 2014). The grids and dishes seeded with HeLa cells were cultured overnight at 37 °C with 5% CO2 in DMEM complete medium supplemented with 10% fetal bovine serum (FBS), 1 μg/mL penicillin, streptomycin and amphotericin B (PSA) antibiotics. After overnight incubation, the cell-seeded grids were inoculated with the recombinant virus strain RSV rA2-mK+ (Hotard et al., 2012). Twenty-four hours post-infection, native immunogold labeling of RSV glycoprotein F was carried out as published previously (Yi et al., 2015), with a primary antibody (motavizumab, 4 μg/mL (gift from Larry J. Anderson’s Laboratory, Emory University)) and secondary antibody Alexa Fluor 488 Nanogold Goat anti-human IgG (Nanoprobes, NY, USA) (Cheutin et al., 2007). 4 μl of 10 nm gold fiducial beads (Aurion Gold Nanoparticles, Electron Microscopy Sciences, PA, USA) were applied to the RSV-infected cell EM grids to aid in image alignment during the tomogram reconstruction process. The grids with RSV-infected HeLa cells were plunge-frozen using a Gatan CryoPlunge3 system with GentleBlot blotters (Gatan, Inc., Pleasanton, CA, USA).
2.2. Correlative fluorescence microscopy
The CorRelator workflows were tested on a Leica DMi8 widefield fluorescence microscope under ambient environmental conditions or a Leica EM Cryo-CLEM microscope system under cryo-conditions (Leica MicroSystems, Germany). For room-temperature correlation, TetraSpeck-coated (100 nm) Au Quantifoil Finder EM grids were imaged at 40 × magnification (40 ×, 0.6NA lens, dry) and 63 × magnification (63 ×, 1.4NA lens, oil-immersion) in brightfield, GFP (emission, λ = 525 nm), and Texas Red (emission, λ = 619 nm) channels with Micro-Manager (Edelstein et al., 2014). For live-cell correlation, RSV-infected HeLa cells grown on Au Quantifoil EM grids were imaged at 20 × magnification (20 ×, 0.4NA lens, dry) and 63 × magnification (63 ×, 1.4NA lens, oil-immersion) in brightfield, GFP (emission, λ = 525 nm), Texas Red (emission, λ = 619 nm), and DAPI (emission, λ = 477 nm) channels with Micro-Manager (Edelstein et al., 2014). Cryo-FLM of grids with RSV-infected HeLa cells was performed using a Leica EM Cryo CLEM system (50 ×, ceramic-tipped, 0.90NA), with brightfield and the band pass filter cubes of 525 nm and 630 nm, using the dedicated Leica LAS X microscope software (Hampton et al., 2017; Schorb et al., 2017; Schorb & Sieckmann, 2017). Images combined to generate 12 to 15 μm Z-stack projections were collected of vitrified grids at a Nyquist sampling step of 350 nm to compensate for cell thickness and wavy or warped grids. The Small Volume Computational Clearance (SVCC) implemented in the Leica LAS X THUNDER package was applied to the post-acquisition image stacks to reduce image blurring and to restore weaker or lower signals. Images and mosaic tiles were exported and used as compressed lossless RGB TIFF format. We determined the point spread function (PSF) of the fluorescent signal (emission λ = 525 nm) of 500 nm TetraSpeck beads in the unprocessed and SVCC-processed cryo-FLM image stacks (n = 10). Additional image processing steps such as flipping, cropping, and contrast adjustment were performed in ImageJ/Fiji (Schindelin et al., 2012) and CorRelator.
2.3. Cryo-electron microscopy, cryo-electron tomography, and tomogram reconstruction
After FLM imaging at room temperature, the bead-coated Quantifoil Finder grids were imaged with a Tecnai T12 (ThermoScientific, Hillsboro, OR, USA) operated at 120 kV and equipped with a 4 k × 4 k Gatan OneView camera using SerialEM (Mastronarde, 2005). After cryo-FLM imaging, bare grids with immunolabeled RSV-infected HeLa cells were clipped and imaged using a Titan Krios (ThermoScientific, Hillsboro, OR, USA) at 300 kV. Images were acquired on a post-GIF Gatan K3 camera in EFTEM mode with a 20 eV slit. Images were recorded at magnification of 81 × (4,485 Å/pixel), 470 × (399 Å/pixel), 2,250 × (76 Å/pixel), and 19,500 × (4.47 Å/pixel). All grid TEM maps were collected in SerialEM.
Tilt series were collected bi-directionally with 2° increments covering a tilt range of −60° to 60° at a magnification of 19,500 × (4.47 Å/pixel) and nominal defocus of −8 μm with a total dose of 80 to 100 e−/Å2. Tilt series were aligned using 10 nm fiducial beads and reconstructed with weighted back-projection algorithm using the IMOD package (Kremer et al., 1996). The cryo-tomograms reconstructed in IMOD were denoised using the low pass Gaussian filter function on 3D volumes implemented in EMAN2 (Tang et al., 2007), followed by smooth filtering with a standard kernel of 3×3 in IMOD, to enhance contrast.
2.4. Identification of hole centers
To identify the center positions of the holes in the fluorescent TIFF images, we followed similar steps as described previously (Anderson et al., 2018). Briefly, the raw images were cropped based on ROI. Some images were downsized by a binning factor of 2 to increase the computational processing speed. The raw images had multiple channels including brightfield and fluorescent channels (e.g., GFP and Texas Red). The cropped fluorescent channel frame (usually with high noise) was subjected to iterative non-local mean filtering (Buades et al., 2005) to optimize efficiency in hole identification in the carbon film. Alternatively, brightfield frames may be used when the shift between frames of the different channels was tolerable (less than 1% of target identification exceeding 2-pixel difference). An iterative median filter of 2 to 6 iterations and optimal threshold for binarization were applied to preserve sharpness of the hole edges. Then, the binarized images were processed with the Canny edge detector function (Canny, 1986), followed by the circular Hough transform function (Illingworth & Kittler, 1987) to determine the optimal radius for hole detection and center coordinates of each detected hole. The whole procedure was carried out using the ImageJ/Fiji platform (Schindelin et al., 2012) where the Canny Edge Detector and circular Hough transform functions were loaded and run as plugins. The hole center coordinates (Px, Py) of a fluorescent TIFF image were exported in the comma-separated value (CSV) file format. For TEM image maps and montages collected in SerialEM, the hole centers were identified following the same procedure described above. SerialEM also has a built-in function to label a 2D grid of hole centers for TEM maps only (not applicable to FLM) in its Navigator module, “Add Grid of Points” function and software-aided algorithmic identification of circular hole centers (SerialEM 3.8). CorRelator also provides automated identification of circular hole centroids via Circular Hough Transform.
2.5. Registration of stage positions in CorRelator
Images or image maps are next imported into CorRelator. The default coordinate system in ImageJ/Fiji is left-handed with (0,0) defining the top left corner. Pixel coordinates in this system can be directly imported from CSV formats to be associated with an image or image map in CorRelator. Additional positions can be manually assigned or modified. CorRelator then facilitates iteratively importing and assigning pixel positions on maps and converting pixel coordinates to the stage positions. The stage positions are exportable as a Navigator file in autodoc format that can be directly read into SerialEM. Alternatively, CorRelator can solve for an affine transformation function that directly aligns the stage positions and maps.
2.6. Affine transformation in CorRelator
We adopted the closed-form solution to the least square problem for an overdetermined system to determine the optimal transformation matrix between two modalities (Horn, 1987). While at least 4 reference coordinate pairs are required to avoid the singular matrix problem, unlimited reference points can be added and incorporated into the solution. Due to the location error in the reference pair positioning, the calculated alignment will not satisfy or fit into all pairs. Instead, it is set to find the best-fitting solution that minimizes the sum of squared errors between targets and predicted outputs.
| (1) |
Where and are matching homogenous reference pairs of X- and Y- image coordinates in the fluorescent image and TEM image to which the fluorescent image is registered, M is the transformation matrix. To simplify the equation (3), set as matrix P ∈ Rn, as matrix Q ∈ Rn, then for an overdetermined system,
| (2) |
When is consistent, then the usual matrix solution. Matrix multiplication, transposition, and inverse calculations were implemented with the Java Apache Commons Math package (2014).
2.7. Alignment accuracy estimation
We validated the alignment accuracy of CorRelator and the transformation algorithms of several programs including MATLAB (MathWorks, Natick, MA, USA), eC-CLEM (Paul-Gilloteaux et al., 2017), and 3D Correlation Tool (Arnold et al., 2016), using a procedure called “Leave-one-out” that was described previously (Kukulski et al., 2011). Briefly, the hole centers in the carbon film within a square were used as alignment markers while either non-registered hole centroids that were unused and left out or TetraSpecks (100 or 500 nm) in the FLM image were treated as the ROIs whose positions were predicted in the registered EM image. The hole centroids were identified as described above. To select the bead signals, we used a two-dimensional Gaussian function in MATLAB (Kukulski et al., 2011; Schellenberger et al., 2014). The predicted position of ROIs was then compared to the actual position to estimate the individual prediction error by measuring the Euclidean distance or length between the two points. The deviation on X and Y axes was calibrated in a form of Euclidean vector. For cryo-CLEM, we followed a similar procedure using Quantifoil and Quantifoil Finder grids of infected HeLa cells. In this case, F glycoprotein labeling (green signal) was treated as the ROIs. To estimate the on-the-fly image acquisition accuracy based on CorRelator’s predictions, the image shift offsets between magnifications on a SerialEM-controlled TEM were corrected to avoid additional off-target variance introduced by the microscope lens performance. We then used the deviation between the ROI position (fluorescent viruses or TetraSpecks) and the center of the acquired image after moving to the predicted stage position.
3. Results
3.1. CorRelator development
CorRelator supports both on-the-fly and post-acquisition two-dimensional (2D) cryo-correlation. As shown in Fig. 1, the on-the-fly correlation and subsequent automated cryo-EM/ET data collection can be accomplished through integration with SerialEM (Mastronarde, 2005), a versatile software program that controls the TEM and image detectors. While SerialEM is capable of manual point matching transformations (Hampton et al., 2017; Schorb et al., 2017; Schwartz et al., 2007), the registration process can be time-consuming and less accurate due to limited guidance and assessment steps. To tackle this challenge, CorRelator uses an iterative approach to guide the user to define and evaluate registration points with integrated alignment algorithms, and subsequently translates external image coordinates into real-time TEM stage positions in SerialEM (Fig. 1A).
The key concept of CorRelator is to use image pixel coordinates for robust registration and incorporate microscope stage-position-to-pixel-coordinate matrices to achieve fast and reliable on-the-fly correlation. We decided to use SerialEM because (1) it is an open-source program extensively used in the microscopy community for automated data acquisition; (2) it is applicable to many existing TEM systems and imaging detectors; (3) the instrumentation-determined image-pixels-to-stage-position relationships are accessible and able to be updated live in its Navigator file, where each image or mosaic is considered as a Map entry (see Appendix-A). The transformation of image planar coordinates to stage planar coordinates can be determined by a 2D affine transformation represented in homogeneous form:
| (3) |
Where is the stage-to-pixel coordinate transform matrix, (Px, Py) ∈ R2 is the image planar coordinate, and (PtsX, PtsY) ∈ R2is the transformed TEM planar stage position. The reverse transform is:
| (4) |
Where is the pixel-to-stage coordinate transform matrix.
When a set of external XY coordinates (e.g., points for registration or ROIs) related to a FLM or TEM map entry in the navigator file, are provided, CorRelator reads and applies the matrices Mstage2pixel and Mpixel2stage of the associated map to these user-defined points. As a result, the offline-determined “external” coordinates are translated to recognizable “inherent” stage positions written out in an updated Navigator file. This essential feature allows the user to perform real-time FLM to cryo-EM correlation, use transformation results from other available tools and the user’s existing workflow, and update alignment if needed—all without leaving CorRelator.
Vitrification by plunge-freezing ensures preservation of biological samples in a near-native state and helps reduce physical deformations, such as non-linear warping of the sample that can occur during chemical fixation, freeze substitution, sectioning, embedding, and image acquisition (Fukuda et al., 2014; Romero-Brey and Bartenschlager, 2015; Sartori et al., 2007). An affine transformation that preserves co-linearity of all points and ratios of distance, is suitable for accurate 2D coordinate transfer for cryo-CLEM of plunge-frozen samples (Arnold et al., 2016; Fu et al., 2019; Fukuda et al., 2014; Hampton et al., 2017; Kuba et al., 2021; Kukulski et al., 2011; Rigort et al., 2010, 2012a, 2012b; Sartori et al., 2007; Schellenberger et al., 2014; Schorb & Briggs, 2014; Schorb et al., 2017; Schwartz et al., 2007; van Driel et al., 2009). The registration may not be accurate for all reference pairs due to possible errors in the point pair positioning. To accommodate outliers and handle alignment, the transformation matrix M between cryo-FLM and EM is calculated using closed-form ordinary least-squares solutions (OLS) in digital geometric image correlation (Castleman, 1995; Gonzalez & Woods, 2002; Horn, 1987). Following the pixel-to-stage transformation, the FLM-to-TEM matrix M accounts for changes in magnification, scaling, rotation, translation, and shearing between FLM and TEM. The transformation M is then applied to the coordinates of the fluorescent signal of interest, defining individual translated pixel and stage positions in the correlated TEM image.
A flow chart of the algorithm for CorRelator is shown in Fig. 1B. CorRelator first defines the Mstage2pixel of different maps in a baseline SerialEM navigator file (Nav_1). The map may be: (1) a whole grid cryo-EM montage at low magnification for rough correlation, (2) an intermediate magnification EM mosaic of squares of interest for fine correlation, (3) an imported image, e.g., a cryo-FLM frame from a wide range of commonly used microscope software solutions, open-source tools such as Micro-Manager (Edelstein et al., 2014) or commercial applications such as Leica LAS X, Nikon NIS-Elements, and Zeiss. CorRelator adopts an iterative and interactive registration approach, supporting (1) manual selection and (2) software-aided assignment through either importing comma-separated values (CSV) files of pixel coordinates from various external sources, or the integrated Circle Hough Transform feature in CorRelator. A csv file is a common file format exported by many image analysis tools such as ImageJ/Fiji (Schindelin et al., 2012), IMOD (Kremer et al., 1996), MATLAB (MathWorks, Natick, MA, USA), Chimera and ChimeraX (Pettersen et al., 2020; Yang et al., 2012), and other commercial graphic editors such as Adobe Photoshop (Adobe, San Jose, CA, USA). In this way, CorRelator supports interoperability with existing popular programs and retains its own portability and flexibility. When provided with two matching sets of pixel coordinate pairs for image registration, CorRelator converts them into stage positions and calculates the optimal transformation matrix M to align the FLM to TEM frame. The alignment performance can be visually and quantitatively assessed. As a result, the user will be able to quickly decide if another iteration of transformation is necessary. The output is an updated functional navigator file referred as to Nav_2. Based on the experimental design and workflow, Nav_2 may be: (1) exported at various stages, (2) used for direct automated cryo-EM/ET data acquisition at the transformed fluorescent ROIs (Fig. 1B Route 1), or (3) used for further manipulation and transformation in SerialEM (Fig. 1B Route 2). The tool is also suitable for post-acquisition correlation (Fig. 1B. Route 3). In this case, a matching set of x- and y- pixel coordinate pairs identifiable in FLM and EM images are direct registration points for matrix calculation.
3.2. CorRelator graphical user interface (GUI) design and workflow
Another component of CorRelator is the intuitive graphical user interface (GUI) that assembles robust and flexible correlation paths. The software tool is a microscope-independent Java desktop application that can be launched by double-clicking on the CorRelator application on a system with the Java SE Runtime Environment 8. CorRelator integrates the Apache Commons Math (2014) for matrix manipulations, the Java Advanced Imaging library for graphical format support, and JavaFX for GUI elements. The GUI supports multiple pathways for data management, including a Project view and a Wizard (Fig. 2 and Supplementary Fig. 1). The Wizard feature is a step-by-step workflow for performing guided on-the-fly or post-acquisition cryo-FLM to EM transformation. The Project view alternatively allows iterative operations for importing or adding more new maps and pixel positions, and performing subsequent 2D alignments. CorRelator is designed to allow the user to make the best of their available resources by the GUI Import feature. Thus, it can work in conjunction with images and pixel coordinate outputs from a wide library of automated functions and plugins from other image analysis tools. It currently supports common image formats of MRC, TIFF, PNG, JPEG. Meanwhile, manual selection options allow the user to interact and fine tune image and map registration if needed. The Project view may be used to open image viewers of individual or aligned images and labeled pixel locations for quick assessment of alignment errors (Fig. 2, Supplementary Fig. 1). A new project/session can be created that will record information about maps (File), positions (Import/Export), alignments (Alignment), and errors that might arise during transformation (Log). New projects can be saved as XML-formatted data to preserve pre-alignment and post-alignment results. The registration coordinates and corresponding stage position remain constant after transformation, allowing users to un-align and re-align the images if the transformation is unsatisfactory (Fig. 2, Supplementary Fig. 1, Video 1). Multiple cryo-FLM and cryo-EM square maps for fine correlation can be accessed and aligned at the same time. CorRelator can export navigator files (Nav-2) specific to an experimental workflow at any point and save aligned overlays for subsequent applications.
Fig. 2.
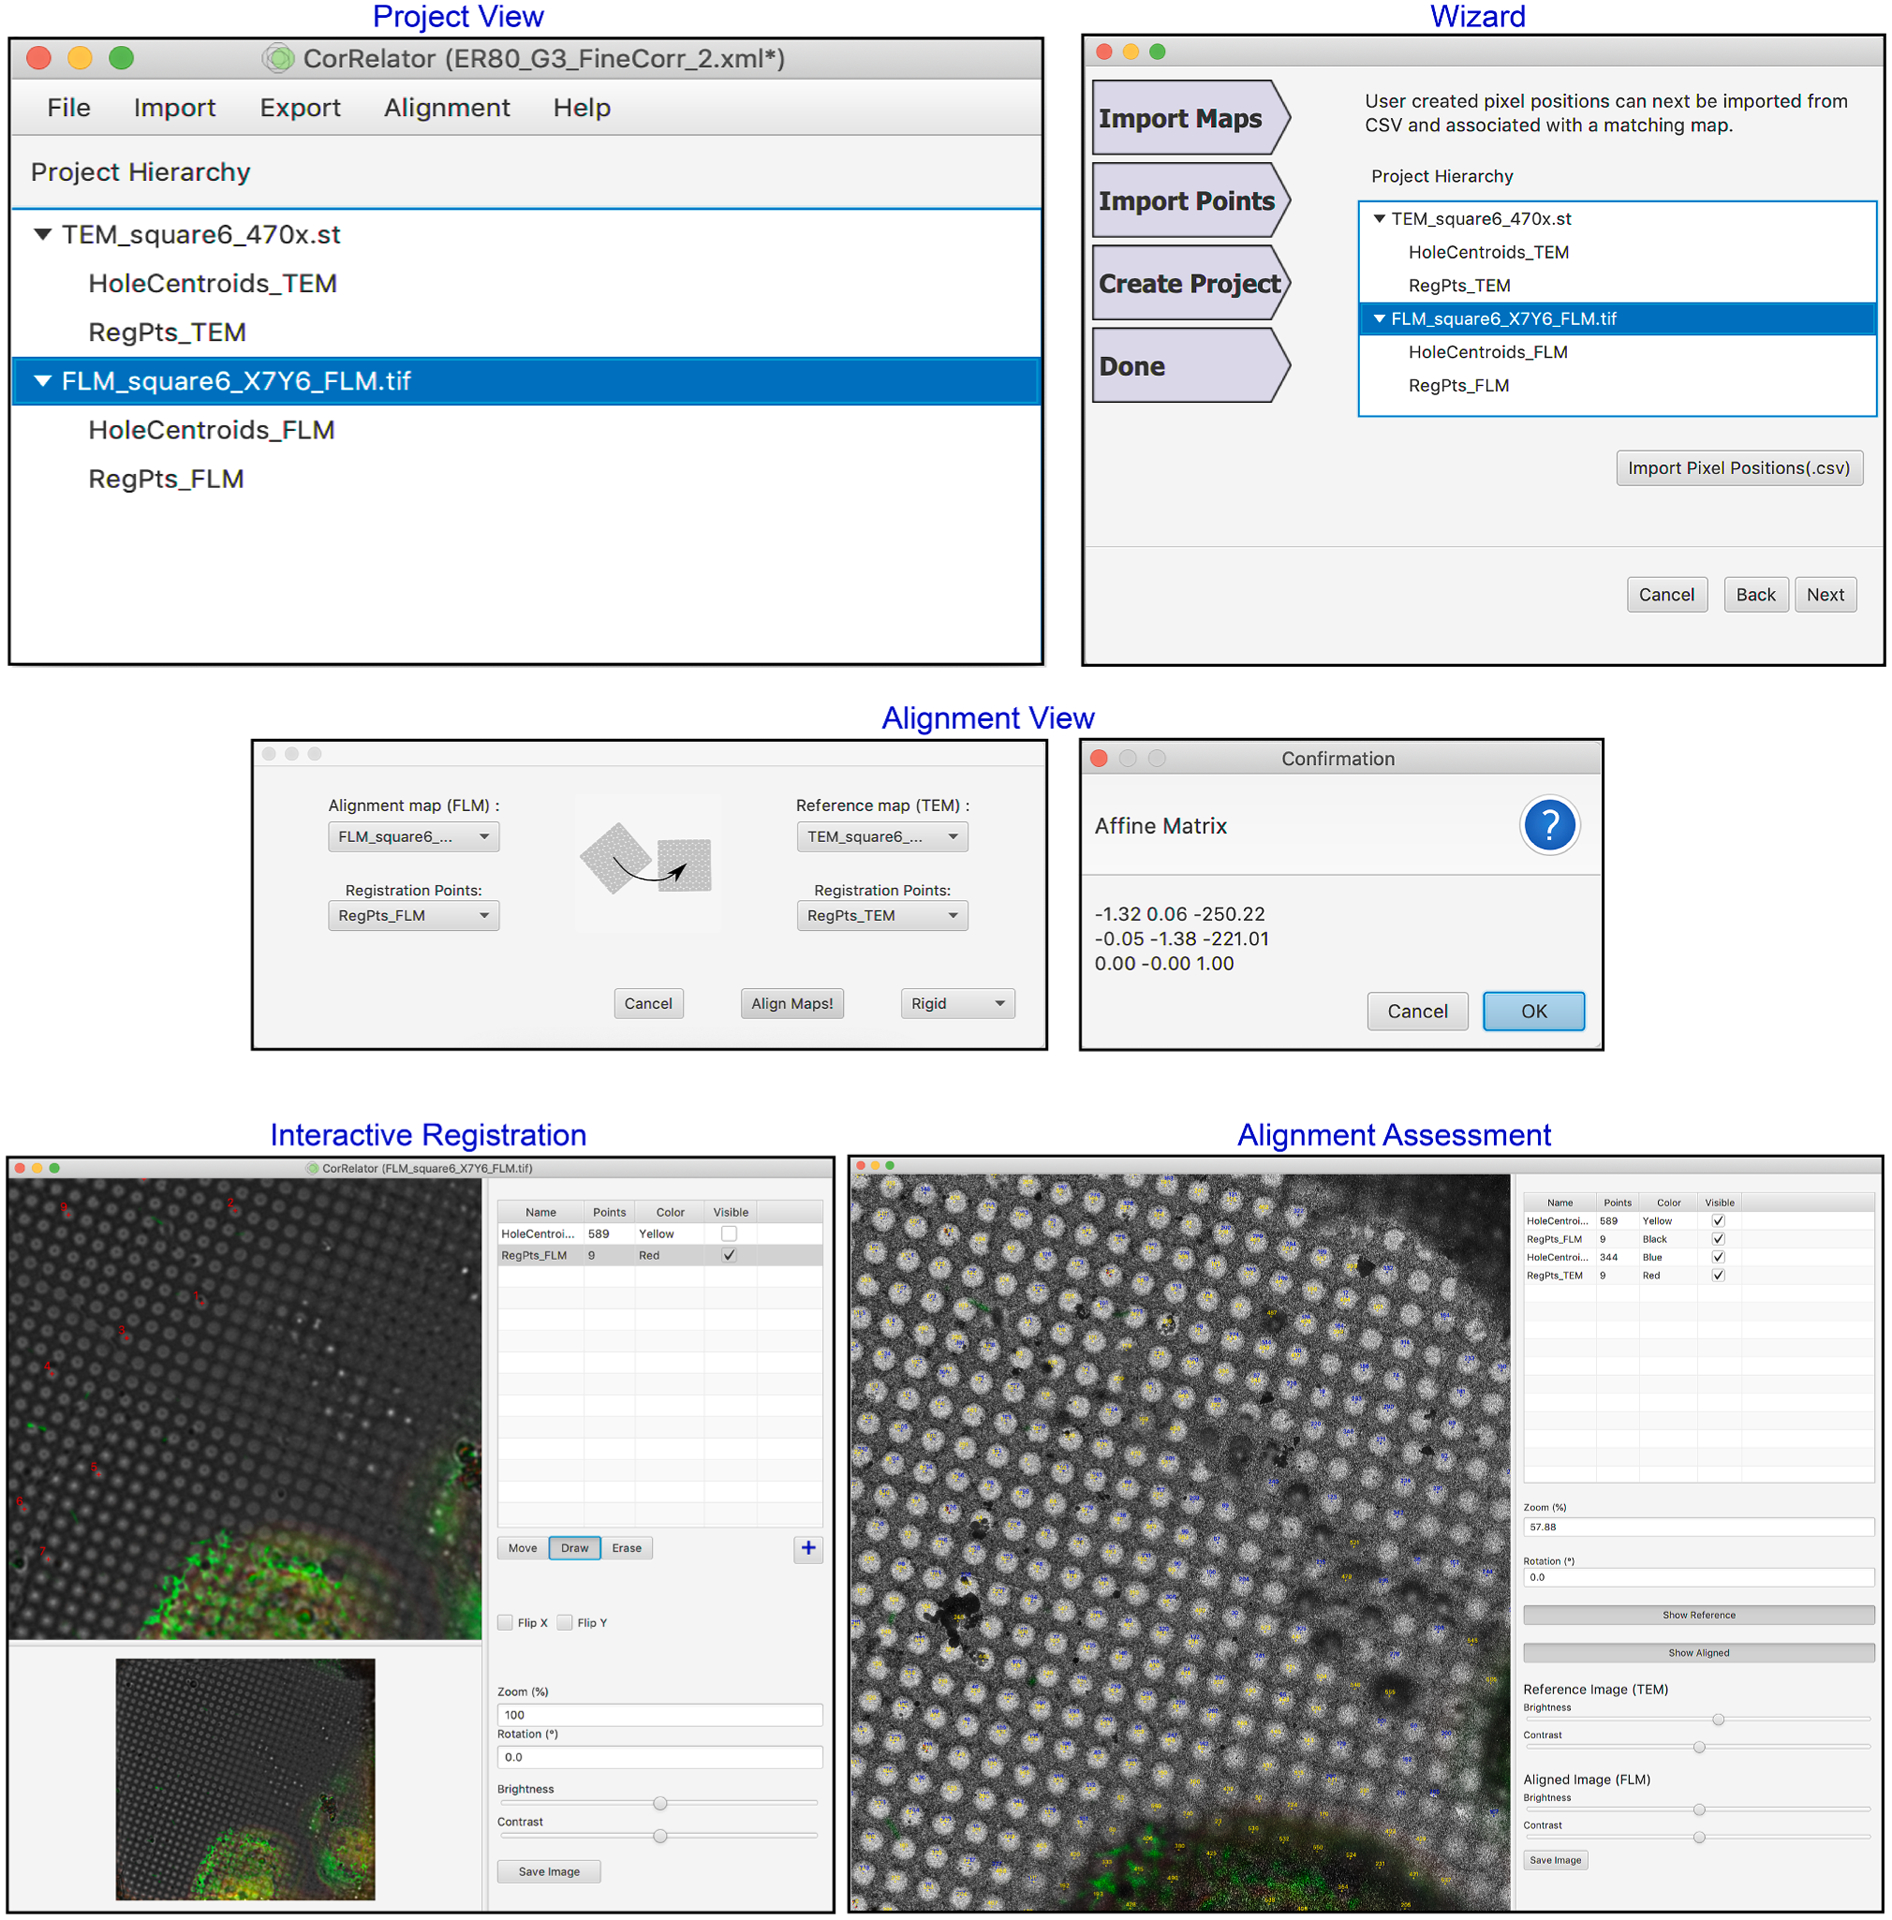
Intuitive graphical user interfaces (GUI) of CorRelator. The main GUI features include a Project view, Wizard view, Alignment windows, iterative registration and aligned image views. To start, the user can choose to begin the alignment either in the main Project window or through step-by-step Wizard route accessible in the Project window. Once import of images, navigator file and or coordinate files is done, the user can choose alignment algorithms and transform FLM to TEM. At any time, the user can edit, add, or delete new coordinates for registration reference or ROIs in an interactive image viewing window. The alignment results are quickly accessible for precision assessment and a new round of registration can be initiated until a satisfying transformation is reached.
3.3. High-accuracy cryo-CLEM applications with CorRelator
CorRelator fits into the classical two-step cryo-CLEM workflow for accurate on-the-fly correlation experiments with high flexibility (Figs. 1, 3, Supplementary Fig. 2). As published previously and detailed in the Materials and Methods (Hampton et al., 2017; Ke et al., 2018), HeLa cells grown on Au Quantifoil grids were infected by recombinant RSV strain rA2-mK+ (Hotard et al., 2012) expressing the far-red monomeric Katushka tag, followed by native immunogold-labeling of the RSV F glycoprotein (Fluro-nanogold) (Yi et al., 2015). We used a commercial Leica EM cryo-CLEM system and the LAS X CLEM software to scan entire grids to produce a series of multi-channel, multi-Z image stacks at each position (Hampton et al., 2017; Schorb et al., 2017). A final single stitched whole cryo-FLM grid image was then imported into SerialEM for ‘square-level’ rough correlation. Each local FLM image tile of the grid mosaic could be used later for fine correlation. Subsequent to FLM imaging, the same grid was loaded onto a Titan Krios microscope (ThermoScientific, Hillsboro, OR, USA) and a low magnification cryo-EM grid montage was collected with SerialEM (binning levels of between 4 to 8 were chosen for faster subsequent processing) for rough correlation (Fig. 3A–C). Blending/stiching of cryo-EM grid montages were performed in IMOD (Kremer et al., 1996). The recloation precision was sufficient to assign the grid squares/regions of interest for further fine correlation.
Fig. 3.
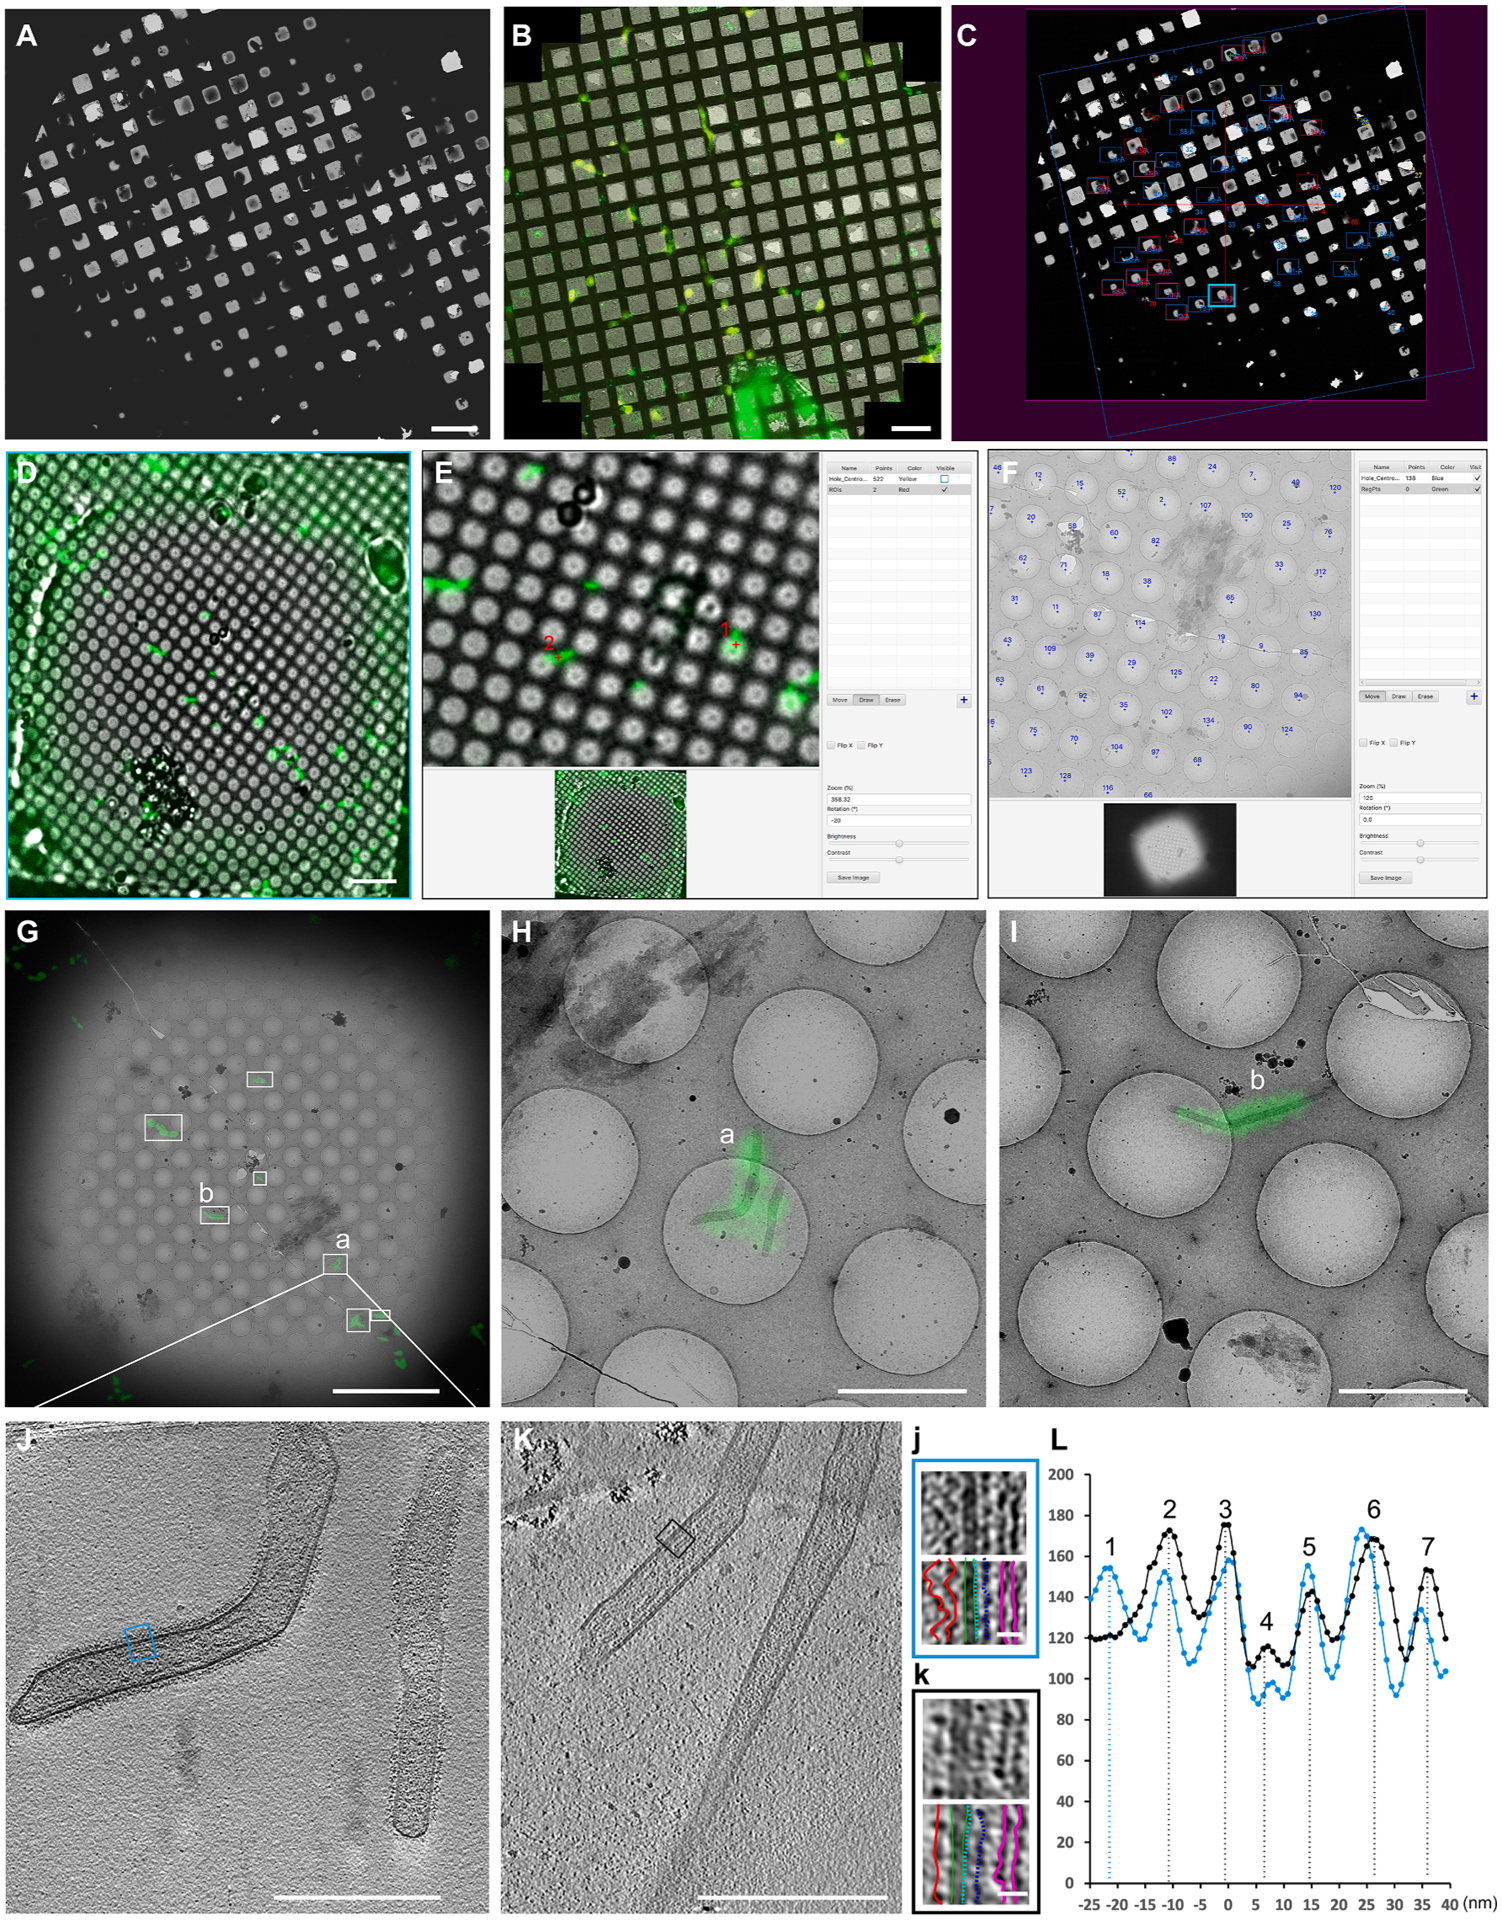
High accuracy cryo-CLEM with CorRelator. (A-C) Rough correlation: Cryo-EM grid map (A) was correlated with the Cryo-FLM mosaic (B) in CorRelator. (C) Screenshot of SerialEM after rough correlation. Squares of interest (blue and red boxes in C) were acquired TEM square maps. (D-G) Fine correlation: In CorRelator, representative cryo-FLM (D, cyan boxed in C) of a square was correlated with the TEM square map using hole centroids (visible in blue, F) for registration. (G) Superposition of the two correlated images. White boxed areas (a and b) indicate the transformed fluorescent ROIs corresponding to red numbers 1 and 2 in E, respectively. High magnification images and cryo-tilt series were recorded. (H-I) Higher magnification correlated overlays of a and b in (G). (J-K) A tomographic slice view (thickness of ~ 9 nm, J) of the position a in (G) and (H), and slice view of an un-labeled RSV particle (thickness of ~ 9 nm, K). (j) and (k) are a magnified view of the blue- and black-boxed areas in J and K. (L) The linear profiles of j (blue line) and k (black line) that highlight various RSV structural components. Scale bars: 200 μm in A, B, D, 10 μm in E, G, 2 μm in H, I, 500 nm in J, K, 20 nm in j and k.
A SerialEM navigator file (Nav_1) was created to store both TEM and the imported FLM map and point entries. Recognizable grid-level landmarks visible in both FLM and cryo-EM such as torn and broken squares, cells, and letters or numbers (like those on an EM finder grid), were used as rough registration points. Alignment may be difficult and time-consuming when dark regions were present in the EM image because of thick ice or when the post-FLM imaged grid was flipped or rotated during sample handling. In CorRelator, we used the cryo-EM grid map as a reference (Fig. 3A), to transform the raw FLM grid mosaic counterpart by flipping, rotating, and adjusting its contrast offline for easy visualization (Fig. 3B). We recommend keeping TEM images as unchanged references during on-the-fly correlation in order to preserve the live pixel-to-stage-position transformation. Changes in pixel coordinates of the TEM map such as cropping, rotating, and flipping, could lead to marginal misplacement of landmarks and a subsequent misalignment of the two imaging modalities. The rough transformation enabled us to identify squares of interest for fine alignment (Fig. 3C). To minimize pixel changes introduced by imprecise stage shift movements, we recorded the TEM square maps at an intermediate low magnification (470 ×, 399 Å/pixel, EFTEM mode, Krios) where a single frame covered the entire field of view of the square of interest and the holes on the support film were clearly visible (Fig. 3F, G). Thus, no additional blending or stitching of multiple image tiles was necessary, ensuring accurate transformation.
Bead-free alignment based on sample support features visible by lower magnification imaging modes has been explored (Anderson et al., 2018; Dahlberg et al., 2020; Sun et al., 2019). The use of hole centroids (Fig. 3E, F) as registration references has several advantages: 1) multiple independent image analysis tools such as ImageJ/Fiji, MATLAB, SerialEM, and CorRelator incorporate automated algorithmic hole finding functions to detect the edge and centroid of a hole, allowing faster and accurate point assignment; 2) hole centroids are abundant, readily identifiable in lower magnification TEM frames where individual fluorescent fiducial beads (200 nm or smaller in diameter) are poorly resolved; (3) determination of hole centroid coordinates is less prone to pixel misassignment introduced by image acquisition and processing, e. g., the centroids may endure few changes in pixel given that the user may set the binarization threshold higher or lower depending on the frame’s noise level. The hole centroid identification process may be completed in the same fluorescent channel as the ROIs, e.g., the GFP channel for labeled RSV particles, to minimize misalignments and shifts between multiple frames (Schellenberger et al., 2014). Non-local means filtering can be used to increase the contrast in FLM images with high background signal (Anderson et al., 2018; Buades et al., 2005). To examine possible deviations in alignment between brightfield and fluorescence image frames, we performed the hole identification procedure on filtered fluorescence and brightfield images acquired from the same area. We found that the deviation of the hole centroid coordinates for the same hole between the two modes was tolerable (Supplementary Fig. 3E), with less than 1% of holes exceeding 2-pixel difference (399 Å/pixel). A larger number of usable center coordinates were identified in the brightfield frame (Supplementary Fig. 3D). Following the rough correlation, CorRelator then treated the Nav_2 as the new Nav_1 to reinitiate a round of fine alignment process (Fig. 1A, 3D–F). Here, out of the user-provided hole centroid coordinates (Fig. 3F, blue points), a set of matching reference points (n = 9) were selected to calculate the matrix M between the two modalities. After one or several rounds of iterative registration and assessment, an overlay of the cryo-FLM and -EM images was generated for a reliable identification of the ROIs (Fig. 3G).
CorRelator mapping of ROIs from FLM to EM can provide updated stage positions for direct automated cryo-ET tilt series collection on labeled RSV particles as ROIs (Fig. 3G–J). Consistent with previous reports (Hampton et al., 2017; Ke et al., 2018; Kiss et al., 2014; Liljeroos et al., 2013), tomographic slices of the RSV particles (Fig. 3J) showed that the virus was predominantly filamentous and likely infectious. Regular organization of the surface glycoproteins (peak 2), matrix protein (M) (peak 4), M2-1(peak 5), and the ribonucleoprotein complex (RNP, peak 6, 7) relative to the viral membrane (peak 3) were revealed in linear density profile analysis (Fig. 3L). Of note, the nanogold-Alexa488 labeled RSV particles (Fig. 3J, blue line in Fig. 3L) appeared fuzzier than un-labeled RSV (Fig. 3K, black line in Fig. 3L) released from HeLa cells infected under the same conditions (MOI = 10, 24-hours post infection). An extra layer of density ~ 23 nm (peak 1) from the viral membrane was observed above the densities attributed to the glycoproteins (~12 nm, peak 2) (Fig. 3j–k, L). The extra density was likely due to the secondary antibody nanogold-Alexa 488 anti-human IgG (~12 to 15 nm in length) and contributed to the diffuse appearance.
All map images were loaded through relative path names indicated in a navigator file. CorRelator operates on the image pixel coordinates for registration and alignment. It is possible to use noisy unprocessed fluorescence images that have holes visible for hole-centroid registration, and then to swap with and load a processed fluorescence frame for on-the-fly target identification in SerialEM. Of note, there might be uncertain minor changes in pixels between pre- and post- processed images. When an object is irregular and pleomorphic, such as filamentous viral particles (Fig. 3G–I), locating fluorescent objects precisely by wide-field imaging is difficult. It is common that fluorescent signal from adjacent focal planes may result in an image with out-of-focus blur that limits details from being observed. To improve image contrast and resolution, we applied Leica’s THUNDER technology to remove background out-of-focus signal and enhance image contrast. An automated adaptive three-dimensional (3D) deconvolution method was applied to improve image resolution by restoring the point spread function (PSF). Here, we investigated RSV assembly sites on the plasma membrane of the infected cells (Harrison et al., 2010; Ke et al., 2018; Oomens et al., 2006). Labeled RSV F was resolved along the host plasma membrane and was present on the exterior of released viral particles (Harrison et al., 2010; Ke et al., 2018; Oomens et al., 2006; Yi et al., 2015). After small volume computational clearance (SVCC), the image contrast and resolution were improved (Supplementary Fig. 4A–D). As a result, previously undistinguishable viral filaments (Fig. 4A–C) close to infected cells were observed (Fig. 4D–F). We registered and transformed unprocessed cryo-FLM (Fig. 4A) and EM images in CorRelator using paired hole centers, followed by swapping to a post-SVCC frame (Fig. 4D). SVCC processing did not introduce detectable pixel changes to the original coordinate system of the raw frame (Supplementary Fig. 4C–E). Correlation between the post-SVCC fluorescent image and the cryo-EM square map revealed extended viral filaments along the cell plasma membrane (Fig. 4F, G, Supplementary Fig. 4). Cryo-ET of the same targets (red and orange stars in Fig. 4G) highlight the spatial organization of viral components inside the RSV filament at the cell edge (Fig. 4H, I). The RNP is noted by white arrowheads and the F glycoprotein along the viral membrane by black arrowheads (Fig. 4H, I). The full-width at half-maximum (FWHM) of the PSF in the lateral X and Y directions was improved by 1.5 (n = 10), consistently with the narrower X-axial intensity distribution (cyan boxed signal in Supplementary Fig. 4C–D, F).
Fig. 4.
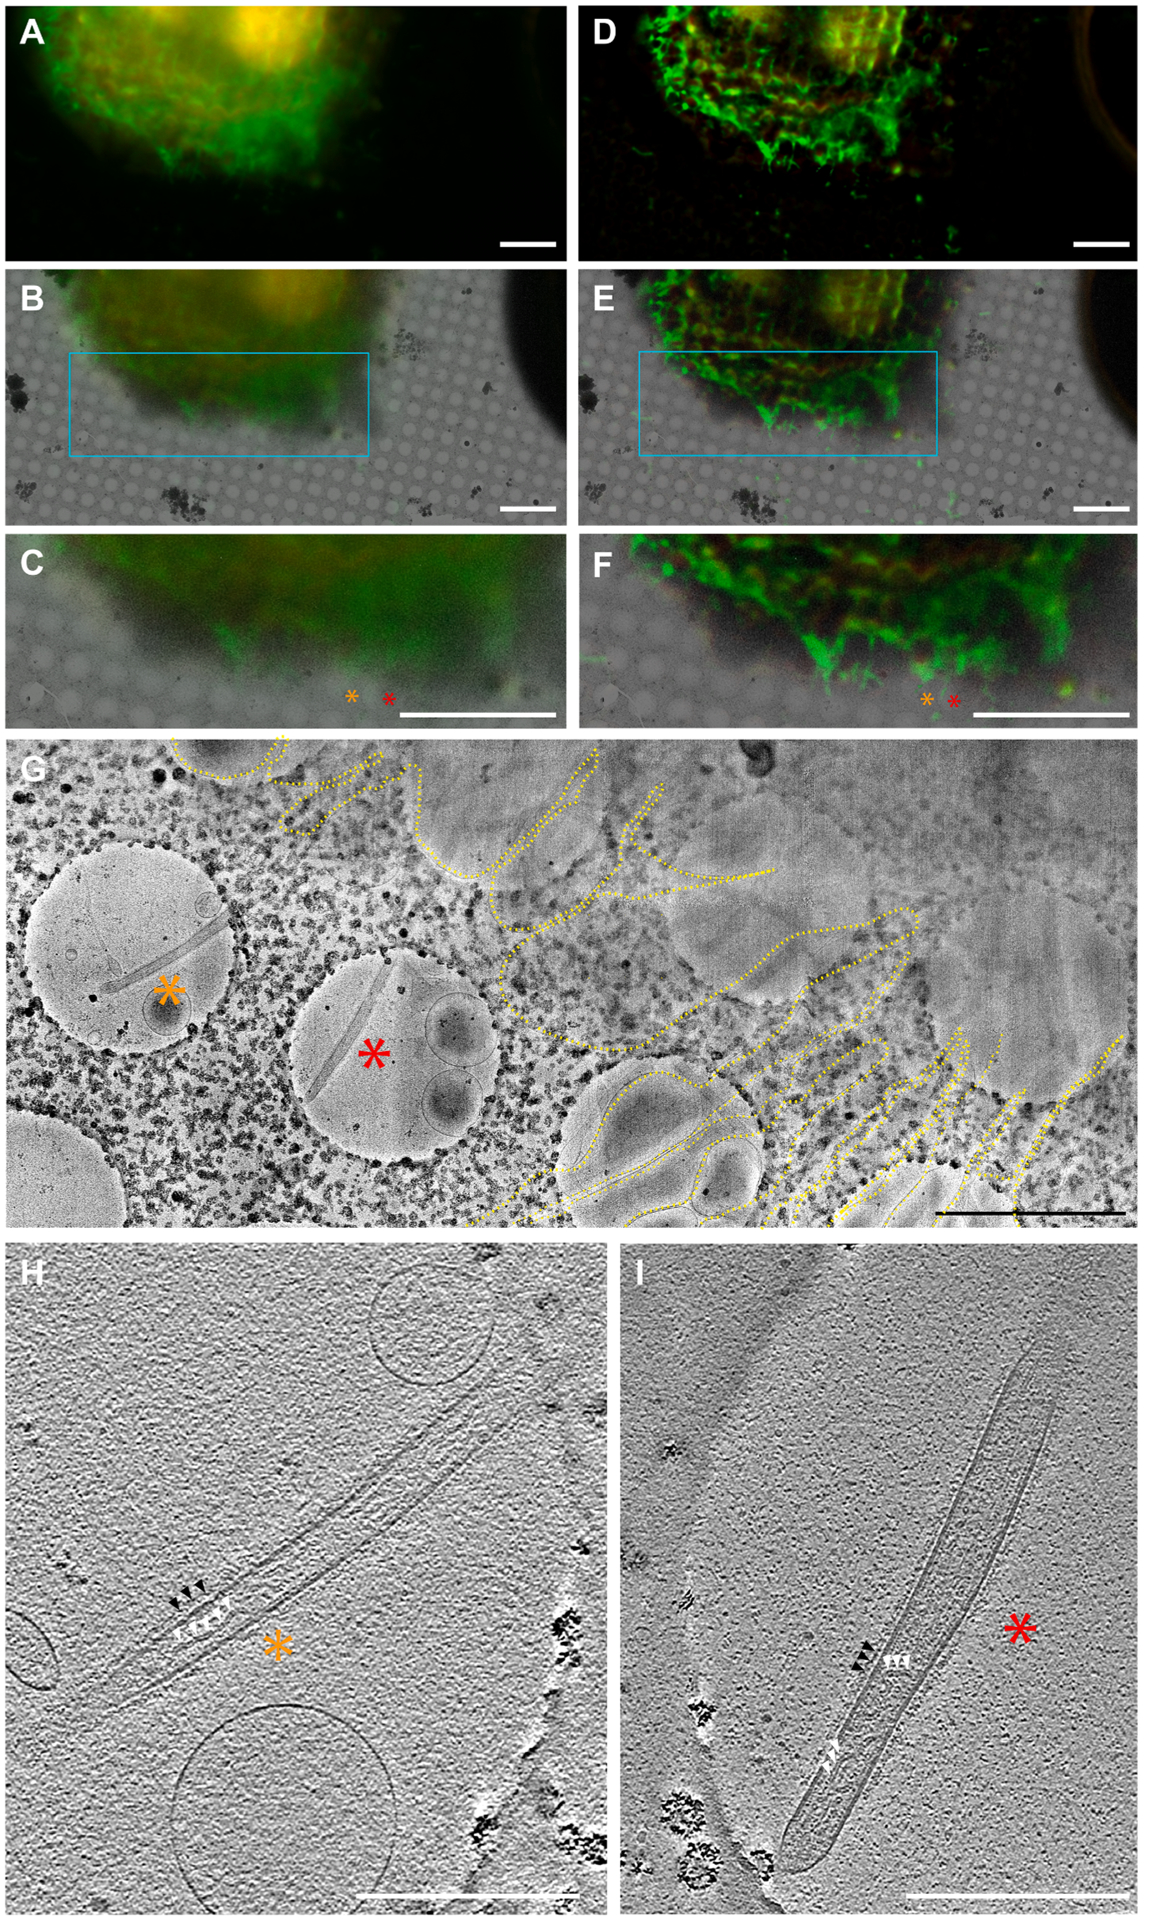
Cryo-CLEM-CorRelator with THUNDER-processed cryo-FLM images. (A) Raw widefield cryo-FLM image of a RSV-infected cell displaying a fluorescent reporter gene in RSV-infected cells (red) and labeled RSV F glycoprotein (green). (B) Overlay of a cryo-EM image and the transformed fluorescence image. (C) Magnified view of the cyan boxed area marked in B. (D-F) the same images (A-C) processed with THUNDER Small Volume Computational Clearance (SVCC). The orange and red asterisks indicate RSV glycoprotein fluorescent signals marked as ROIs on pre- and post-SVCC. (G) Magnified cryo-EM montage view of the star ROIs in E and F of the immuno-labeled RSV particles (green). The RSV filaments extend from the cell plasma membrane and cell protrusions (dashed yellow line). (H-I) Central sections (thickness of ~ 9 nm) through the tomograms collected at the marked ROIs. White triangles indicate the RSV ribonucleoprotein (RNP) inside the RSV filament. The black arrows note the RSV glycoproteins bound to antibodies and 6-nm gold (peak 1 in Fig. 3I). Scale bars: 10 μm in A-F, 2 μm in G, 500 nm in H and I.
3.4. Accuracy of on-the-fly and post-acquisition correlation by CorRelator
It has been reported that on-the-fly relocation precision of 0.1 to 1 μm may be possible when microscope stage movements are taken into consideration (Fu et al., 2019; Schorb et al., 2017). Post-acquisition correlation in the range of 20 to 100 nm is achievable using TetraSpeck or FluoSphere fiducials combined with the linear transformation function (Fu et al., 2019; Fukuda et al., 2014; Kukulski et al., 2011; Paul-Gilloteaux et al., 2017; Rigort et al., 2010; Schellenberger et al., 2014; Schorb & Briggs, 2014; Schorb et al., 2017). To validate the performance of CorRelator, we first assessed the on-the-fly target prediction on pleomorphic RSV particles for real-time automated acquisition. To demonstrate the image acquisition procedure, we applied a similar methodology (Schorb et al., 2017) and analyzed a set of 50 images acquired at magnifications of 2,250 × (76 Å/pixel, EFTEM) and 19,500 × (4.47 Å/pixel, EFTEM). After aligning the cryo-FLM square frames (Fig. 5A) to the 470 × (399 Å/pixel, EFTEM) TEM images, we moved to the stage positions of the transformed fluorescent signal and recorded images at 2,250 × and 19,500 ×. For more reliable results, the image magnification offset calibration in SerialEM could be performed ahead between the registration magnification (470 ×, EFTEM), medium magnification (2,250 ×, EFTEM), and acquisition magnification (19,500 ×, EFTEM). Taking into account variations in stage movement, the Euclidian distance between the actual position of the fluorescent viral particle (pink cross, Fig. 5C–F) and the center of the images (or predicted position, yellow cross, Fig. 5C–F) was used to estimate the on-the-fly alignment accuracy, as described previously (Schorb et al., 2017). The mean error of Euclidian distance was 218.9 nm with a standard deviation of 109 nm, with an average of 160.7 nm in X and 148.6 nm in Y axis (n = 50, Fig. 5N, Table 1), comparable to previous reports (Fu et al., 2019; Schorb et al., 2017). A maximum prediction error of 605 nm was observed when the hole centroids of damaged support films were used for image registration (Fig. 5E). The error for positioning pleomorphic objects fell well within a previously reported cryo-EM imaging tolerance range of ~ 1.4 × 1.4 μm (pixel size of 3 ~ 8 Å) on a Gatan K3 direct electron detector (Fu et al., 2019). The approximate normal distribution of prediction errors indicated that data acquisition could be conducted with a field of view as small as 700 nm while still expecting a less than 5% off-target rate (Fig. 5N). We noted that on-the-fly accuracy depended on multiple factors, including registration point selection, stage and image calibrations between magnifications on the TEM, the intensity and resolution of the fluorescent signals in FLM images, and the limit in recording magnification/pixel size in TEM. On a modern 4 k × 4 k camera, the field of view that the relocation error of 500 nm can have a minimal pixel size of 3 Å to ensure relocation robustness and ROIs (200 nm in diameter) in the view. In addition, we obtained consistent targeting precision when stage and image shifts were calibrated at the magnifications used for correlation in SerialEM.
Fig. 5.
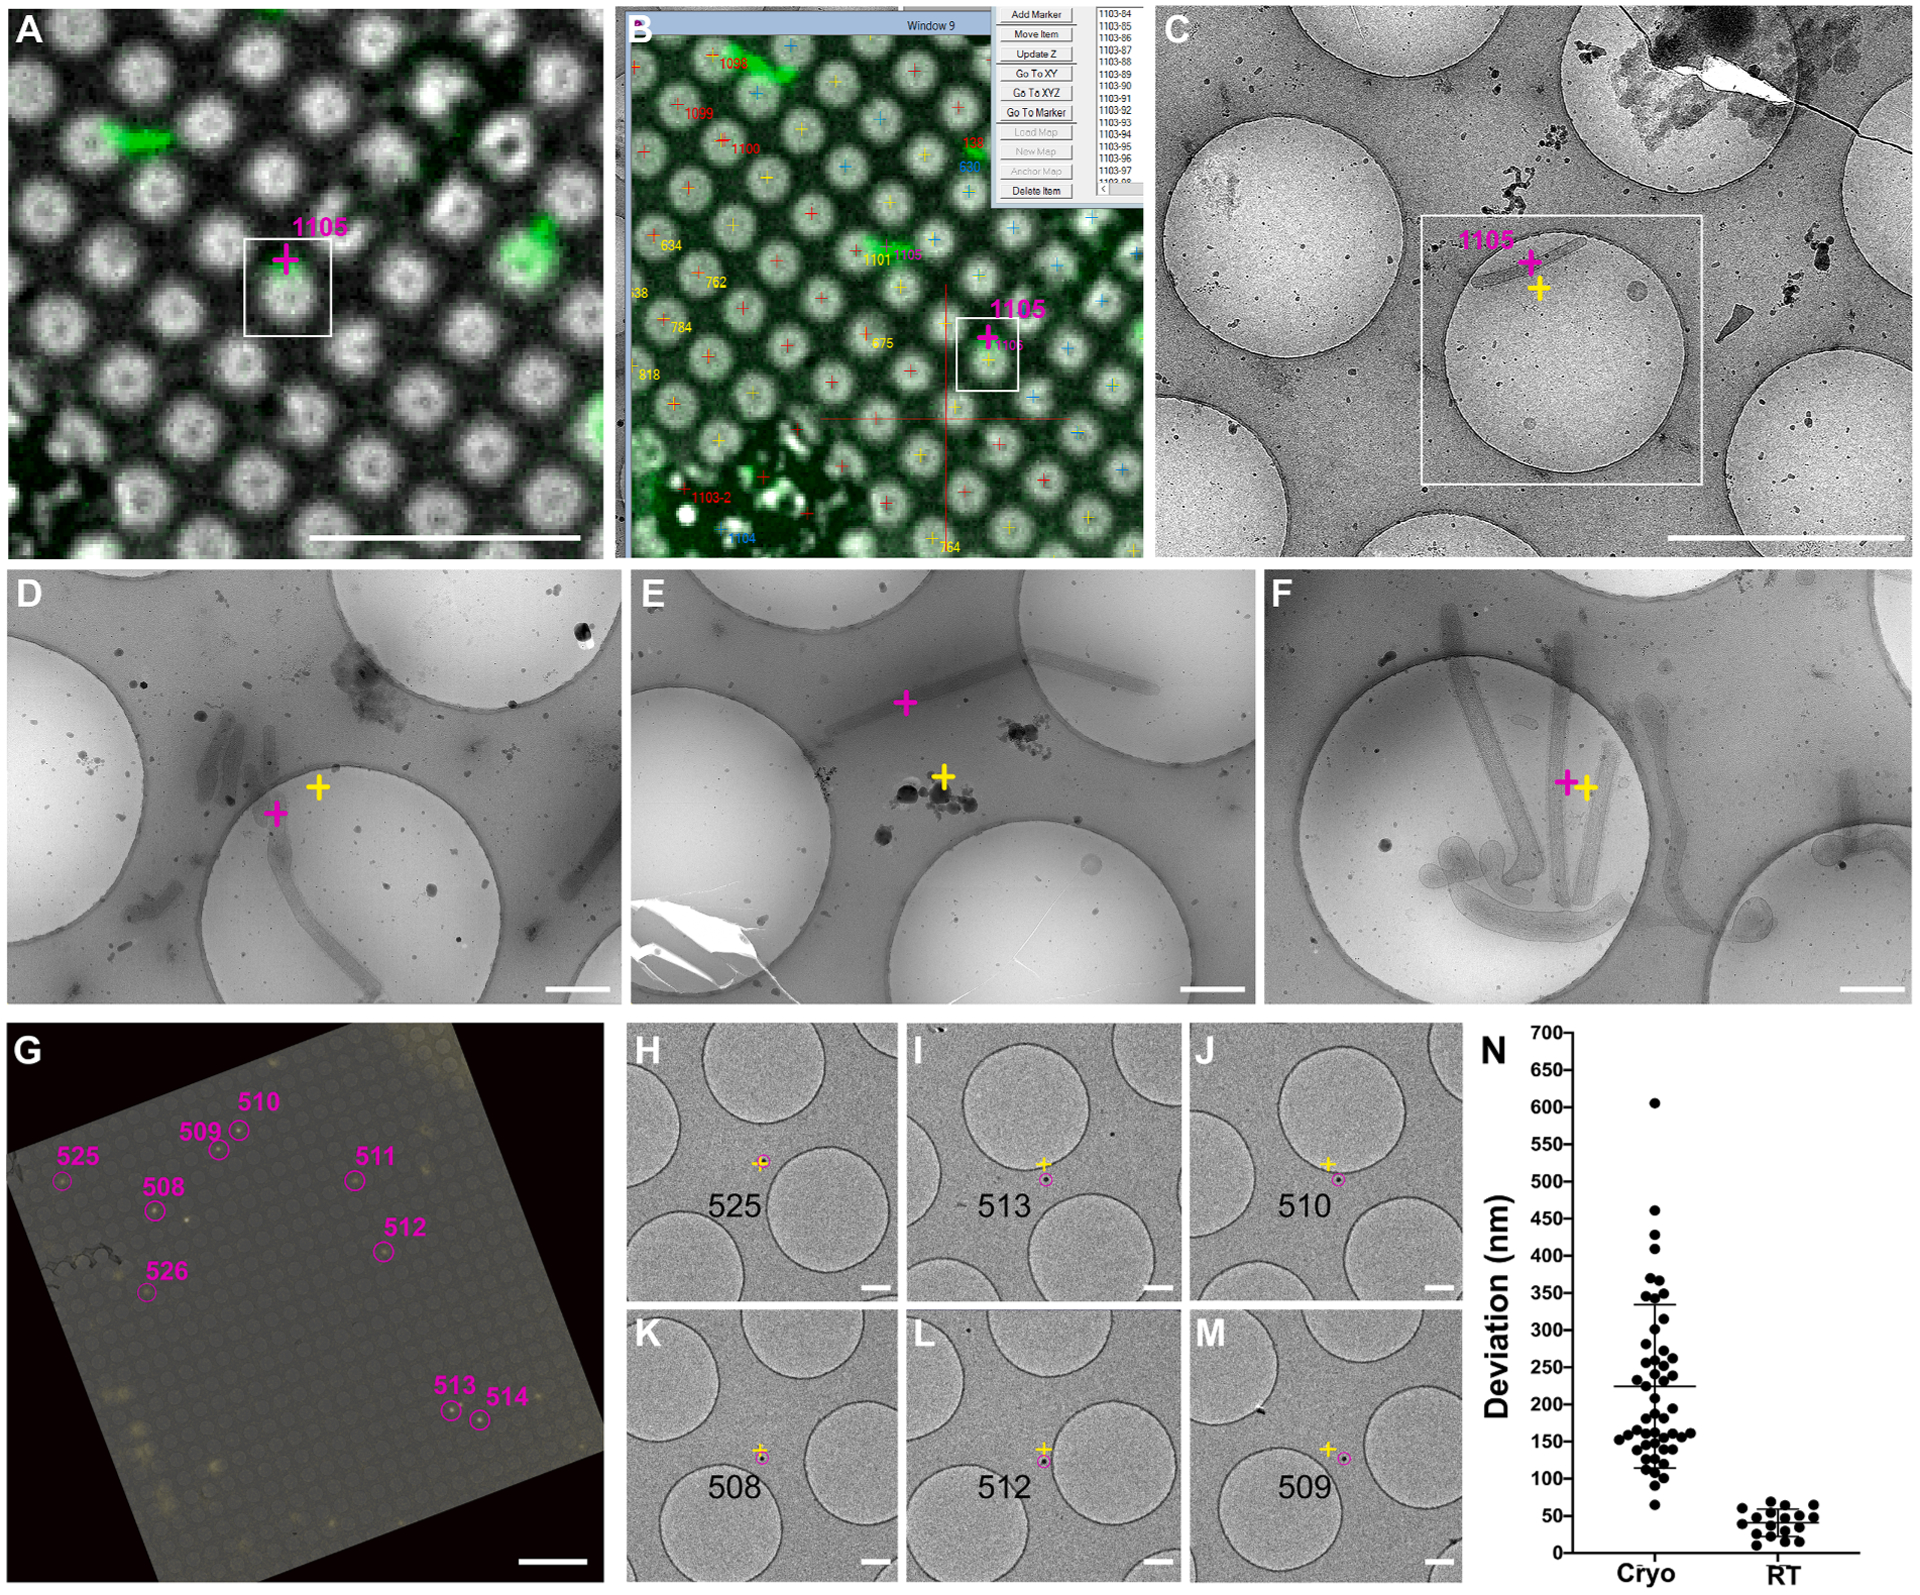
Accuracy performance of on-the-fly (Cryo)-CLEM with CorRelator. (A-G) Cryo-CLEM-CorRelator application on vitrified HeLa cells infected by RSV viral particles. (A) Bright-field and fluorescent channel merged FLM map used to provide a representative ROI (pink cross in the white box). The labeled RSV filaments appear green. (B) SerialEM screenshot of the post-correlated FLM map of (A) after reloading the Nav_2. (C) Higher magnification cryo-EM image of the ROI after moving the TEM stage to the identified ROI (pink cross in A and B). (D-F) For three other areas, the center coordinate (yellow cross in D-F) of each TEM frame corresponds to the predicted stage position by CorRelator (pink across) after moving the stage. (G-M) RT-CLEM-CorRelator application on Tetraspeck beads. (G) Superposition of the correlated TEM and FLM map. (H-M) Acquired high-magnification images at the pink ROIs in (G) after moving the stage to the predicted positions (yellow cross). The pink circle was centered on the actual ROIs using the 2D Gaussian fit. (L) Distribution plot of the coordinate deviation by CorRelator between the actual ROIs (pink) and predicated positions (yellow) under cryogenic (n = 50) and ambient conditions (n = 19). Scale bars: 10 μm in A and a, 2 μm in C-D, 500 nm in E-G, 10 μm in H, 500 nm in I-N.
Table 1.
| Data Sets | On the fly deviation (nm) | Post-acquisition deviation (nm) | ||||
|---|---|---|---|---|---|---|
| RSV particles (Sample 1 and 2) or TetraSpeck (Sample 3) | Hole Centroids (2 μm) | TetraSpeck (500 nm) | ||||
| Sample 1: Cryo-CLEM, nanogold-Alexa labeled RSV on a Quantifoil grid | X | X | Y | X | Y | Y |
| 147.9 (27) |
141.7 (27) |
69.8 (20) |
72.5 (20) |
46.2 (12) |
54.2 (12) |
|
| Sample 2: Cryo-CLEM nanogold-Alexa labeled RSV on a Quantifoil Finder grid | 173.5 (23) |
155.6 (23) |
67.3 (24) |
61.2 (24) |
49.9 (12) |
30.8 (12) |
| Sample 3: RT-CLEM, TetraSpeck of 100 nm on a Quantifoil Finder grid | 28.4 (19) |
29.0 (19) |
14.1 (12) |
16.7 (12) |
4.8 (12) |
5.7 (12) |
Measurements of alignment accuracy for cryo-FLM to cryo-EM and RT-FLM to TEM by CorRelator. Two independent data sets (sample 1 and 2) of vitrified HeLa cells infected by RSV growing on two types of grids and one independent data set of TetraSpeck beads on Quantifoil Finder grid were used. The hole centroid pairs (n = 9) picked through automated Circular Hough Transform function were used for registration. The non-registration hole centers (leave-outone method) and TetraSpeck beads were considered as ROIs and used to calculate predicted errors in the application of post-acquisition deviation (left). The mean relocation error in X and Y after TEM stage movement during on-the-fly TEM relocation of ROIs was calculated.
Following similar procedures (Anderson et al., 2018; Kukulski et al., 2011; Schellenberger et al., 2014), the post-acquisition alignment accuracy using paired hole center registration (n ≥ 7 pairs) in CorRelator was measured on experimental cryo-CLEM data sets. CorRelator predicted errors of transformation were between 20 and 100 nm. We found that average prediction errors in X/Y axial directions were 68.6 nm (±42) and 66.8 nm (± 52) when hole centers were treated as ROIs (Supplementary Fig. 5A, Table 1), and 48.1 nm (± 43) and 42.8 nm (±34) for 500 nm TetraSpeck targets as ROIs (Table 1). The slight improvement seen in TetraSpeck prediction, was likely due to the application of a 2D Gaussian fitting model to detect precise coordinates of the point-like fluorescent signal (Kukulski et al., 2011; Schellenberger et al., 2014; Schorb & Briggs, 2014).
Furthermore, we used TetraSpeck-coated EM Finder grids and conducted room-temperature (RT) FLM-EM correlation to assess alignment accuracy through hole center registration in the absence of cryogenic handling and thermal stage drift observed with cryo-FLM systems (Briegel et al., 2010; Fu et al., 2019; Li, S. et al., 2018; Rigort et al., 2010, 2012a, 2012b; Sartori et al., 2007; Schellenberger et al., 2014; Schorb & Briggs, 2014; van Driel et al., 2009). The number of 100 nm TetraSpeck beads was optimized to roughly 5 ~ 15 beads per square of an EM Finder grid (Schellenberger et al., 2014). A multi-channel automated scan of the whole grid was performed by Micro-Manager (Edelstein et al., 2014) on an inverted DMi8 microscope at 40 × (40 ×, 0.6NA, dry, Leica). A higher NA oil-immersion objective (63 ×, 1.4NA, oil-immersion, Leica) was used to record single square frames of areas with a good bead distribution. The GFP signal (emission, λ = 525 nm) of TetraSpeck beads (100 nm) precisely identified through 2D Gaussian fitting were treated as ROIs. The hole centers for registration were identified algorithmically through circular Hough transform plugin in Fiji and fine-tuned in CorRelator. Likewise, we verified the precision of on-the-fly correlation by analyzing the acquired image sets after moving the stage to the predicted position of ROIs (Fig. 5G–H). Overall, the on-the-fly correlation performance achieved within 100 nm Euclidian deviation of the positions of the beads from the center of the images (Fig. 5N), a significant decrease compared to cryo-FLM to cryo-EM (p < 0.05, Student’s T-Test). The mean displacement was 40.8 nm (n = 19, Fig. 5. H–M, Table 1). Consistent with cryo-CLEM CorRelator applications, the post-acquisition correlation of either TetraSpeck beads or ‘leave-one-out’ hole centroids as ROIs displayed prediction errors of 10 to 100 nm (Table 1).
3.5. Comparison of transformation performance
We compared the transformation performance of CorRelator to standard MATLAB affine and projective geometric functions that have been used for consistent high accuracy correlation (Fu et al., 2019; Kukulski et al., 2011; Schellenberger et al., 2014; Schorb et al., 2017), rigid-transformation in eC-CLEM/ICY (Paul-Gilloteaux et al., 2017), and 2D-2D transformation in 3D Correlation Tool, 3DCT (Arnold et al., 2016). An identical set of paired hole centroids (n = 7 to 10) on cryo-FLM and cryo-EM images were used for registration while the prediction errors were measured through the standard ‘Leave-one-out’ method (Kukulski et al., 2011). CorRelator performed equivalently to the MATLAB Affine Transformation, eC-CLEM/ICY Rigid Transformation, and 3DCT that corrects translation, rotation, scaling, and shearing, the performance of which was better than the MATLAB’s Projective Transformation function (Fig. 6, Supplementary Fig. 5B).
Fig. 6.
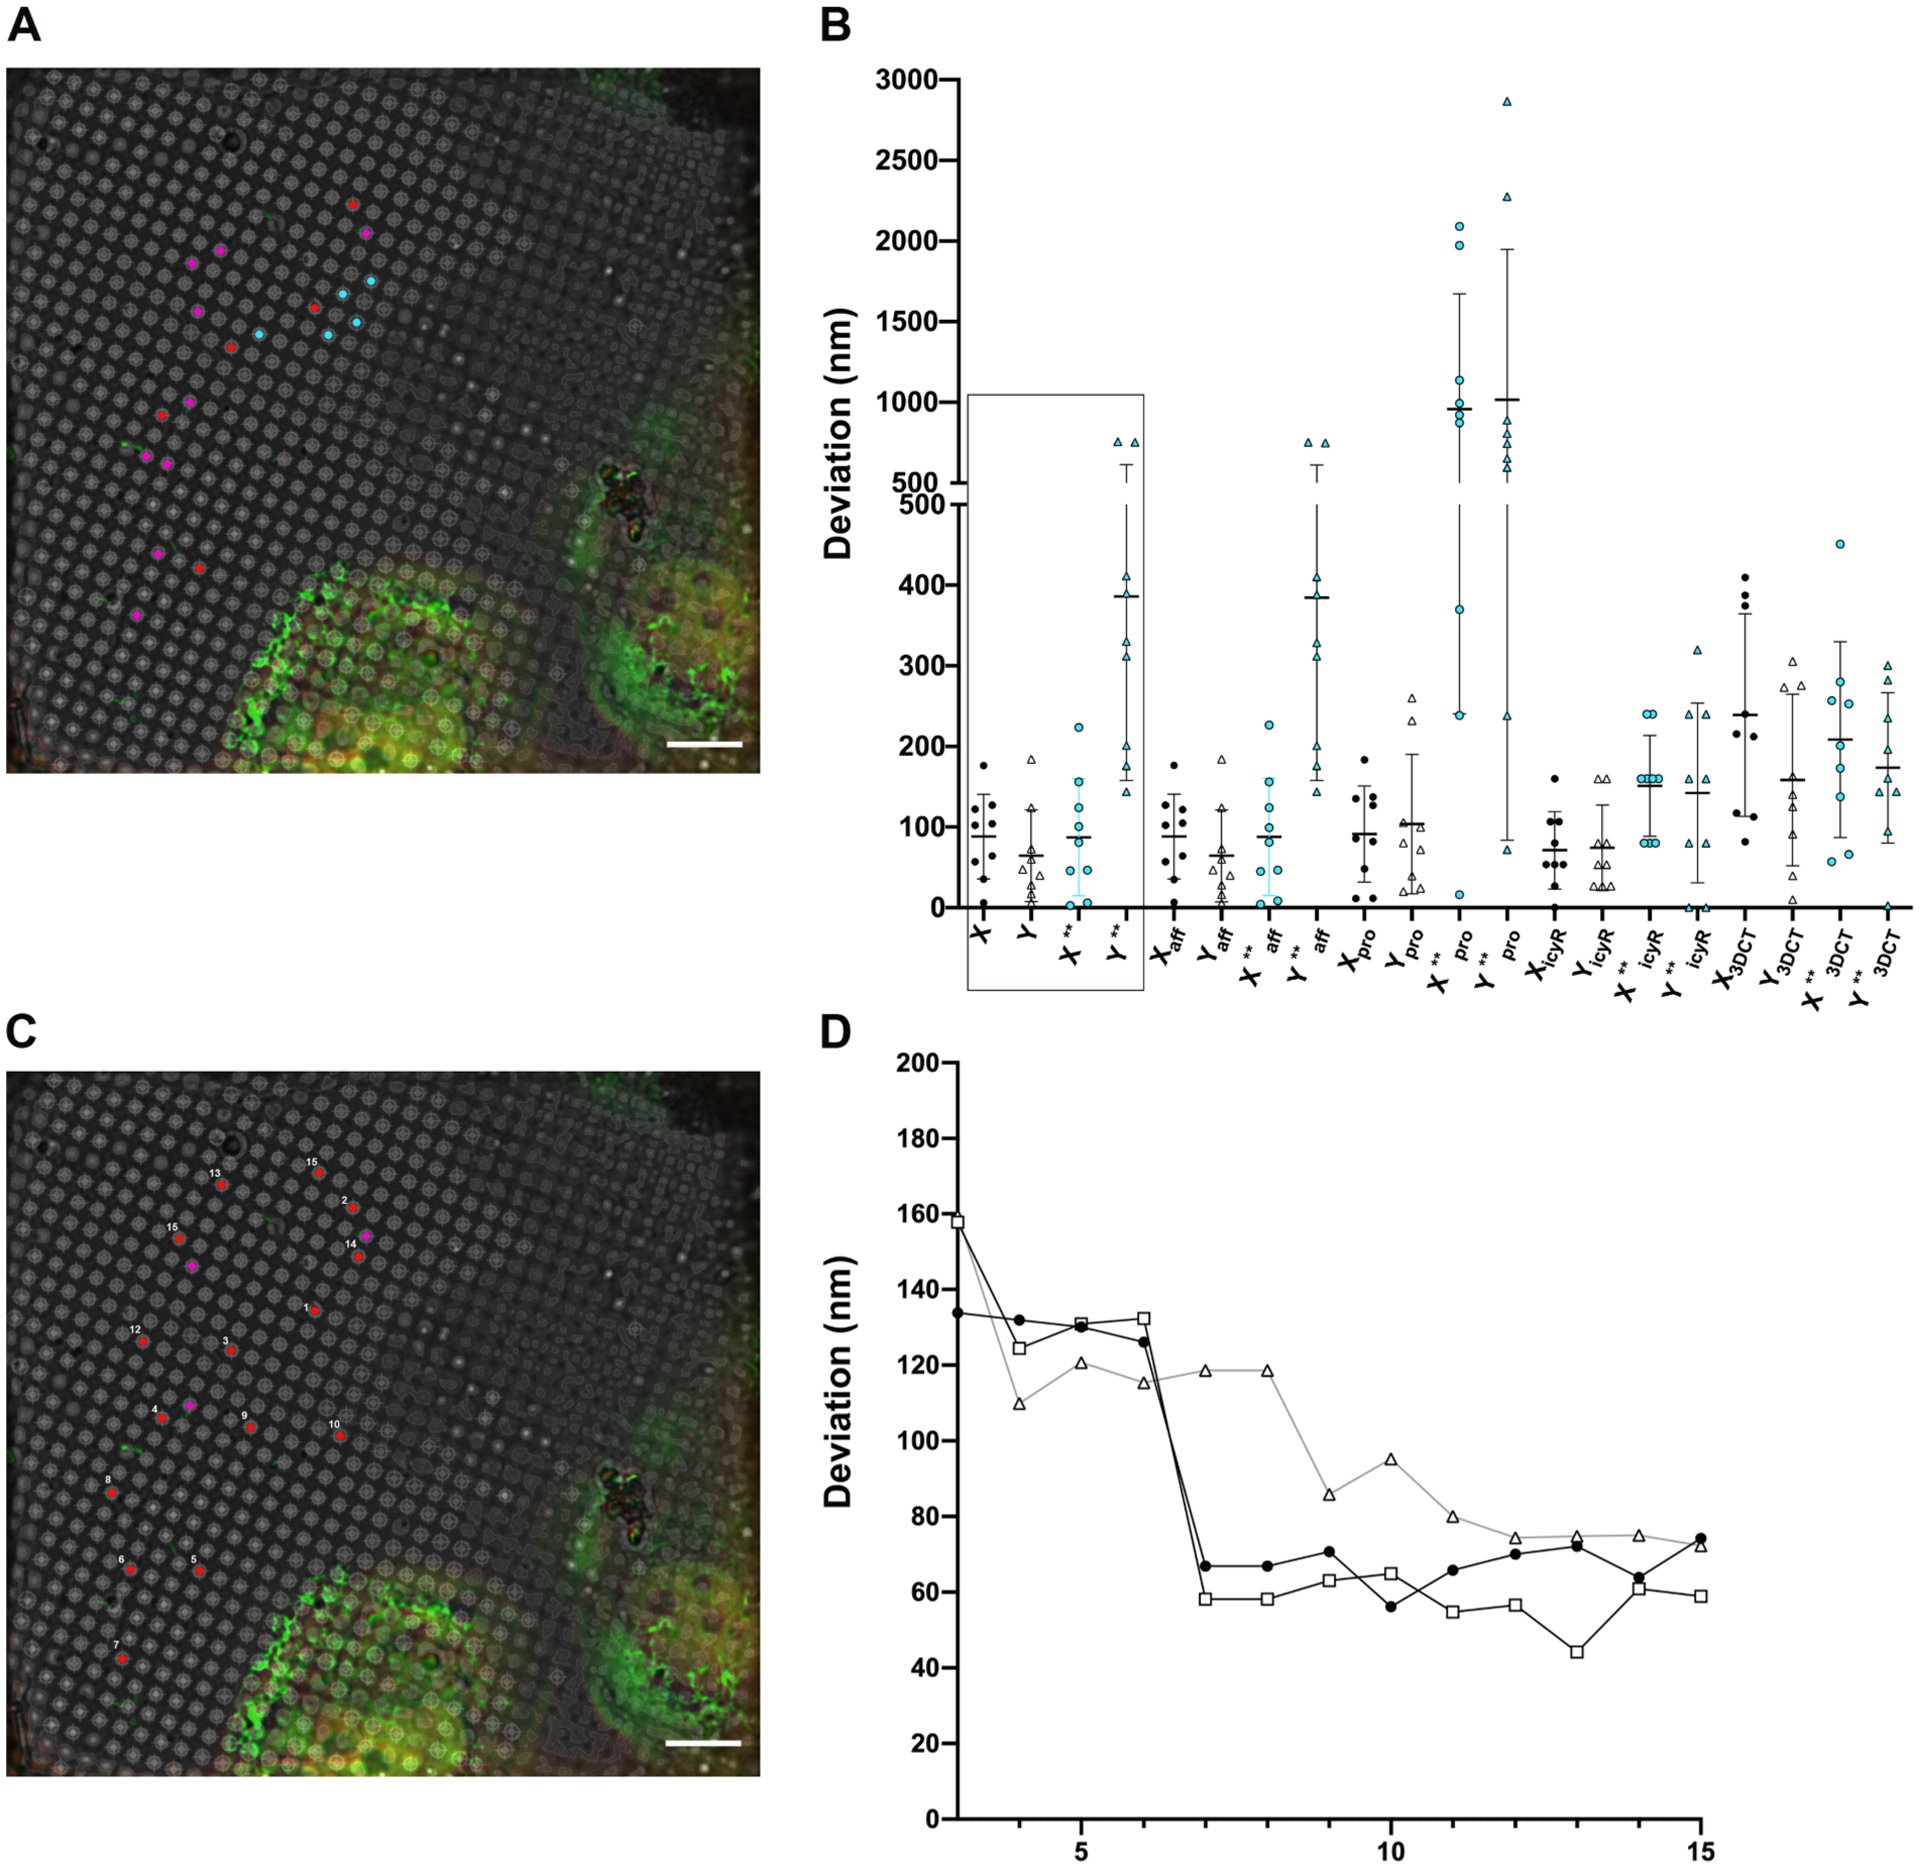
Comparison of registration point selections on the alignment accuracy of different algorithms. (A) Five registration points and nine target points (leave-oneout method) picked on a 2D cryo-FLM image of vitrified cells and used for comparison of predicted errors shown (B). Adequately dispersed reference points are red (n = 5); locally clustered reference points are cyan (n = 5); target points are magenta (n = 9). (B) Comparison of predicted errors of the picked targets (magenta, A) in X and Y by several software tools. From left to right: X/Y and X**/Y** (black boxed) are errors predicted by CorRelator using dispersed (white) and locally clustered (blue, **) registration points, Xaff /Yaff and Xaff**/ Yaff** by MATLAB affine transformation, Xpro/Ypro and Xproc**/Yproc** by MATLAB projective transformation, XicyR/YicyR and XicyR**/YicyR** by eC-CLEM (ICY package) transformation, X3DCT/Y3DCT and X3DCT**/Y3DCT** by 3DCT (3D Correlation Toolbox). (C) Adequately dispersed reference points (red, numbered) and targets (magenta) picked to monitor the predicted error as the reference points increase. (D) Predicted errors on monitored three magenta targets (represented by circles, hollow circles, and triangles, repectively) in (C). The X axis is number of points used for the reference, labeled in (C). Scale bars = 10 μm.
The closed-form solution and non-linear product transformation require at least four reference points to avoid a singular/coplanar matrix, as is always the case when there are only three reference coordinates between two coordinate systems (Horn, 1987). To evaluate the variance in transformation performance caused by selection of alignment markers, we used a set of five reference coordinate pairs of hole centroids, defined either locally within a bounding area of ~ 3% of the entire field of view (cyan points), or across the entire image spanning roughly 50% (red points), to calculate the subsequent transformation matrices in CorRelator, MATLAB (affine and projective transformation), rigid eC-CLEM/ICY, and 3DCT (Fig. 6A). The calculated matrices were then applied to the same set of ROIs (Leave-out-one, non-registration hole centroids) to obtain the prediction errors. Using either adequately dispersed or locally clustered registration points, linear transformation performed better than non-linear projective transformation (Fig. 6B). Reference coordinate pairs (n ≥ 5) were able to achieve an overall high-accuracy cryo-FLM-to-cryo-EM coordinate correlation when the registration pairs were roughly distributed across 50% of the entire image (Fig. 6D). The prediction error for ROIs that were closer to the picked reference coordinates were smaller than those located farther away. Increasing the number of local reference coordinates marginally improved the prediction error. We note that more uniformly distributed reference coordinates help obtain an optimum cryo-FLM to cryo-EM correlation. Compared to fluorescent bead-aided alignment, the distribution of holes is regular, uniform, and abundant by nature, and therefore more tolerant of prediction error caused by mispositioning reference pairs.
3.6. Adaptability of the CorRelator workflow
One of the major strengths of CorRelator is its flexibility and adaptability in cryo-CLEM applications. Provided the file format is supported, CorRelator can import images from any existing fluorescent microscope systems and perform 2D linear transformation and correlation with cryo-EM. While correlating cryo-FLM and cryo-EM on identical vitrified samples maximizes the alignment accuracy, live-cell fluorescent microscopy captures dynamic biological behaviors and allows for high NA and oil immersion objective lens imaging for a much higher resolution (Fu et al., 2019; 2011; Jun et al., 2013; Sartori-Rupp et al., 2019). Here, to study dynamic RSV viral budding process, we adapted the cryo-CLEM-CorRelator routine and developed an integrated live-cell-FLM-plunge-freezing-cryo-FLM-cryo-EM/ET workflow that takes advantages of both approaches. The procedure illustrated in Fig. 7A, used CorRelator to align to cryo-EM data live-cell-FLM images (Fig. 7E, H) acquired on a DMi8 Leica wide-field microscope or cryo-FLM images (Fig. 7F, I) from a Leica cryo-CLEM system of the same RSV-infected HeLa cells prior to and after plunge-freezing (Fig. 7G). Both light microscopy systems revealed unique fluorescent ROIs. Following the grid-level rough correlation of the cryo-EM map (Fig. 7B) and live-cell-FLM grid mosaic (Fig. 7C), the use of the high NA and oil immersion objective (63 ×, 1.4NA) distinguished clear green signals of a budding virus (red box in Fig. 7H, J) from the crowded background in raw unprocessed data, which was barely identifiable even in the SVCC-processed correlated cryo-FLM-cryo-EM image (red box, Fig. 7I). Similar relocation errors of both fluorescent microscopy systems (260 nm ± 131 in live-cell-FLM-cryo-EM versus 283 nm ± 158 in cryo-FLM-cryo-EM) suggest a reliable hole-centroid registration and alignment performance by CorRelator both in the presence and absence of ice (Supplementary Fig. 6). In addition, three-channel live-cell FLM imaging was performed (Fig. 7E). We noticed that the limit to the number of fluorescent channels used is mainly determined by the filter cube accommodation/suitability for different chromophores in (cryo-) FLM, and considerations for the inevitable effects of spectral bleed-through. The accurate ROI assignment may suffer from bleed-through or misidentification of probe species and further image processing correction may be necessary (Kim et al., 2013). Overall, our results demonstrate the adaptability and flexibility of CorRelator and the workflow to other microscope systems for accurate correlative cryo-EM/ET applications.
Fig. 7.
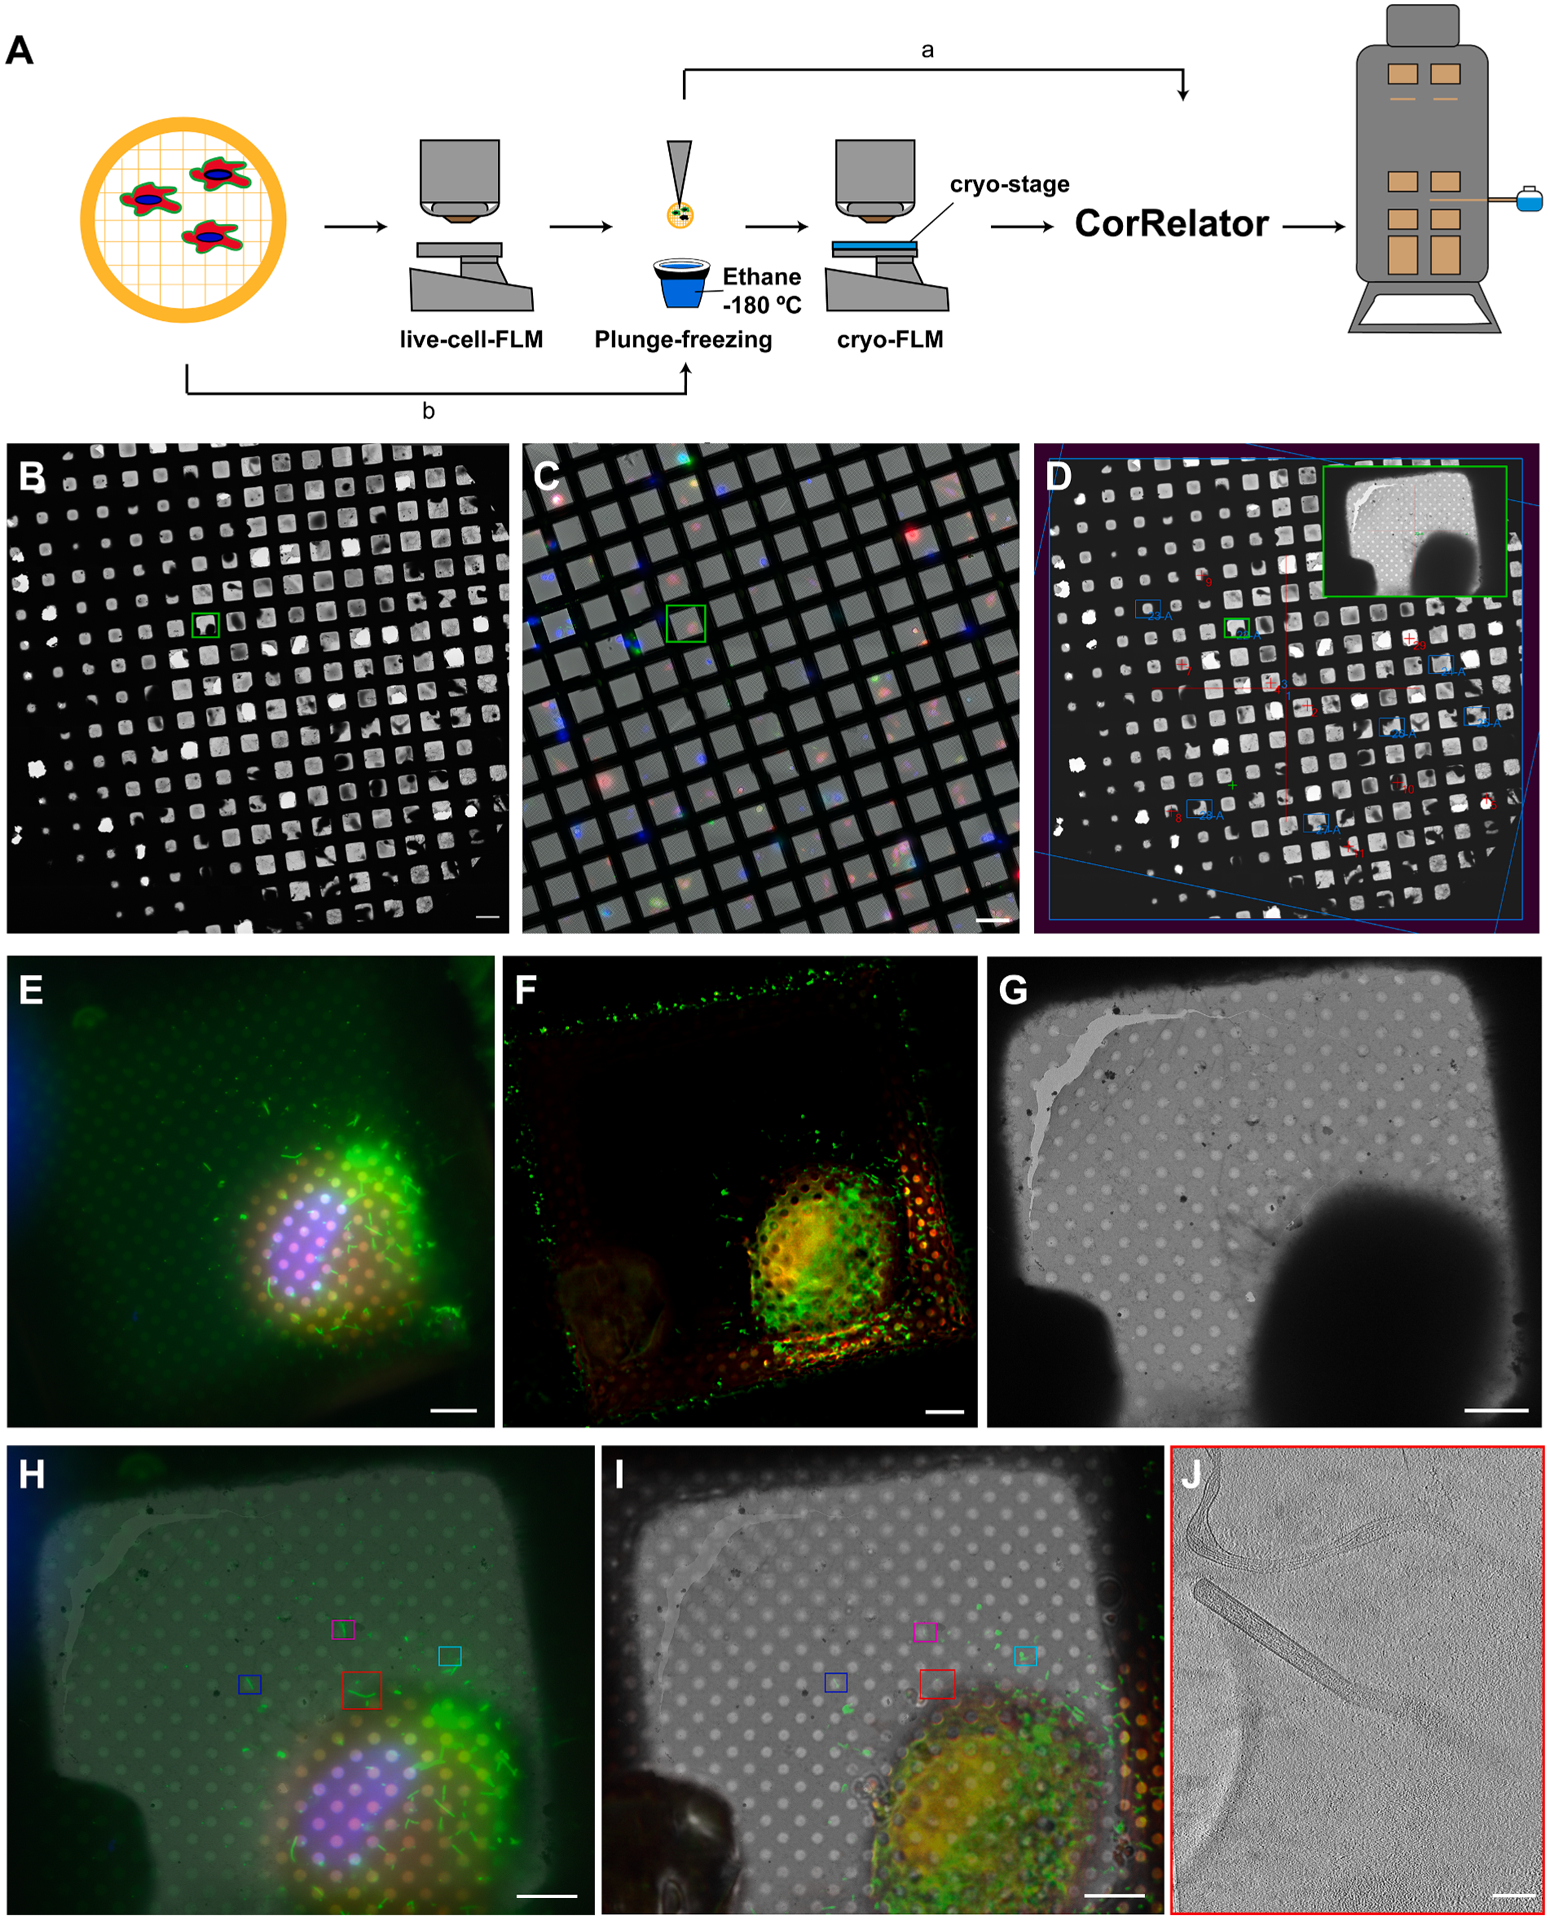
CorRelator adaptability for cryo-CLEM imaging of RSV. (A) A schematic diagram to apply both (a) ambient oil immersion objective lens at magnification of 63 × (live-cell-FLM) prior to plunge-freezing, and (b) cryogenic objective lens at magnification of 50 × and cryo-stage (cryo-FLM) to study vitrified RSV-infected cells on a gold TEM grid. (B) Cryo-EM grid map. (C) Live-cell-FLM mosaic (workflow a in A) of the same whole grid, fluorescent signals from RSV-infected cells (red), the RSV F glycoprotein on RSV-infected cells or released particles (green), and cellular DNA Hoechst stain (blue). (D) SerialEM screenshot of cryo-TEM map of (B) after being correlated with live-cell-FLM map of (C) in CorRelator. The maps for ROI squares were identified and collected (blue box). (E-G) live-cell-FLM square image (workflow a), SVCC-processed cryo-FLM image (workflow b), and cryo-EM map of 470 × of the region (G) corresponding to the green boxed and zoomed-in square in D. (H-I) Superimpositions of the correlated live-cell-FLM image (E, H) and processed cryo-FLM image (F, I) with EM map in G, respectively. The same ROIs of RSV particles were present and identified in both FLM modalities, highlighted in matching colored boxes. (J) Central section (thickness of ~ 9 nm) through the tomogram of RSV collected at the red boxed region. Scale bars: 100 μm in B-C, 10 μm in E-I, 200 nm in J.
4. Discussion
The application of diverse FLM and cryo-FLM approaches in combination with cryo-EM has led to advances in workflow and software development (Supplementary Table 1). There is an increasing need for easy and accurate correlative alignment for real-time cryo-CLEM. Here, we introduce a new system-independent and user-friendly cryo-CLEM application, CorRelator (Fig. 1, Supplementary Fig. 2), that can be coupled with SerialEM for real-time automated cryo-EM/ET data collection. CorRelator provides software-aided and feedback-based registration to achieve and improve the standard bead-aided prediction error of 20 to 100 nm for 2D post-acquisition cryo-correlation, and 100 to 700 nm relocation precision for real time cryo-EM/ET acquisition using hole centers of a support film as registration references. Integration of advanced image processing steps in cryo-CLEM improved ROI assignment and subsequent correlation accuracy. CorRelator has proven to be adaptable to existing live-cell-FLM, cryo-FLM, or cryo-EM systems for cryogenic correlative imaging applications, expanding the scope of system-independent operation. CorRelator aims to bridge between live-cell- and cryo-FLM and cryo-EM/ET for a smooth transition during real-time registration, alignment, and automated cryo-EM/ET data collection.
No specialized hardware requirements are needed for the FLM and TEM microscopes and cameras to achieve high-accuracy correlation with CorRelator. In general, minimizing microscope lens misalignment improves the nonradical transformation estimation from 3-D to 2-D, from the real object space (to camera coordinates) to image-space, then to pixel coordinates displayed on the screen (Gonzalez & Woods, 2002; Szeliski, 2011). SerialEM calibrations on the TEM that support Navigator usage and improve image alignment between various magnifications, makes stage movement and automated image acquisition more robust. The performance evaluations shown were from a range of TEM instrumentation including two Titan Krios instruments, a Talos L120C, a Tecnai TF30, and a Tecnai T12.
Because geometrical distortions are normally considered negligible at cryogenic conditions, rigid linear transformation has proven to accurately transform plunge-frozen ROIs across multiple modalities from cryo-FLM to cryo-FIB/SEM, then to cryo-EM/ET (Arnold et al., 2016; Fu et al., 2019; Fukuda et al., 2014; Kukulski et al., 2011; Li et al., 2018; Rigort et al., 2010; Sartori et al., 2007; Schellenberger et al., 2014; Schorb & Briggs, 2014; Schorb et al., 2017; Schwartz et al., 2007; van Driel et al., 2009). Here, we adopted the linear closed-form ordinary least squares (OLS) solution to an overdetermined system (Horn, 1987) in CorRelator. The use of OLS method has two main advantages. It is preferred over manual and semi-automated point-matching registration where a “smaller” set of paired reference points are usually provided, speeding up the matrix computing and calculation, as well as being robust to outliers. Second, it limits unnecessary liberty in a non-rigid, non-linear transform that could warp and distort images that lead to increased target registration error during correlation (Paul-Gilloteaux et al., 2017). Using the same set of registration references and ROIs, CorRelator is able to achieve comparable and reliable transformation in both live-cell- and cryo-FLM to cryo-EM schemes (Fig. 6, Supplementary Fig. 5).
EM data quality can be highly variable due to many factors, such as sample preparation steps, ice inhomogeneity from plunge-freezing, and routine grid transfer and handling. As a result, non-linear distortion might be present in FLM and cryo-EM imaging, under which case non-rigid transformation is required. Thus, we further evaluated the performance of the non-rigid transformation algorithm—thin plate spline (TPS) (Bookstein, 1989) on both live-cell-FLM to cryo-TEM and cryo-FLM to cryo-EM workflows. The TPS is chosen because it is a well-studied spline model in geometric mapping that can be cleanly decomposed into affine and non-affine subspaces while minimize a bending energy for correction (Gonzalez & Woods, 2002; Holden, 2008; Zhou et al., 2018). Previously, the TPS algorithm has shown success in correcting non-linear, warping and stretching deformation in CLEM (Paul-Gilloteaux et al., 2017). We found no significant difference in prediction errors of identical ROIs between two algorithms, when the same set of registration references were used (Supplementary Fig. 5). Here, the reliable and consistent performance of the OLS algorithm confirmed that little deformative artifacts and geometric distortions arose from plunge-freezing, careful grid handling, or cryogenic imaging (Fukuda et al., 2014; Sartori et al., 2007; Thompson et al., 2016) in cryo-CLEM. This highlights that linear and rigid transformations have superior performance under cryogenic conditions when the specimen is usually “rigid” (Arnold et al., 2016). CorRelator has not been tested on plastic-embedded (chemical fixation) or high-pressure frozen (resin-embedded or vitreous sectioning) samples (Kukulski et al., 2011; Paul-Gilloteaux et al., 2017) where larger structural changes and sample distortions can occur. Such scenarios may require non-rigid, dedicated transformation parameter selections (Paul-Gilloteaux et al., 2017).
Another possible variable in alignment performance might be the thickness of ice in which the ROIs are embedded. In cryo-FLM, the emitted light travels through a thin layer of vitrified ice, immersion media such as cold air (Schorb et al., 2017) or low-freezing point cryo-fluid (Nahmani et al., 2017), and possibly a glass coverslip (Rigort et al., 2012a, 2012b; Sartori et al., 2007) before entering the front objective lens. The change in refractive index and thickness of the ice could act as a prism to deflect the light, possibly introducing small errors in target assignment (Nahmani et al., 2017). With the existing cryo-CLEM (50 ×, 0.9NA) and RT-FLM (40 ×, 0.6NA) systems, we evaluated the impact of the ice layer by plotting the embedding ice thickness against the prediction errors of TetraSpeck beads (200 nm) using the “Leave-one-out” approach (Supplementary Fig. 6). We observed an undetectable difference in prediction accuracy of thicker-ice (above 500 nm) and thinner-ice (below 100 nm) embedded ROIs (Supplementary Fig. 6C, D). Our results did reconfirm the importance of registration point selection and assignment on transformation accuracy when the estimated resolution of the cryo-FLM system is 400 to 600 nm (Supplementary Fig. 4, (Schorb et al., 2017)). Embedding ice thickness might be a considerable factor in the case of super-resolution cryo-FLM where the resolving power could reliably reach below 20 nm (Wang et al., 2019).
We validated the potential improvements that CorRelator can provide for robust real-time registration and ROI mapping using the combination of a hole identifying algorithmic approach with sufficient expert user intervention. A recent report on cryo-super resolution CLEM has shown that the most robust and accurate registrations are from manual hole center identifications, as opposed to purely automated approaches (Dahlberg et al., 2020), indicating the necessity for human intervention. While great efforts have been put into developing automated correlative workflows (Fu et al., 2019; Paul-Gilloteaux et al., 2017; Schorb et al., 2019), the registration process remains tedious and potentially challenging. On-going development will continue to improve interactive approaches that iteratively converge on registration references while allowing for expert intervention when an alignment error threshold is reached. Integration of 3D multi-modal correlative microscopy, e.g., cryo-FLM-FIB-SEM-ET (Arnold et al., 2016; Fukuda et al., 2014; Gorelick et al., 2019; Hoffman et al., 2020; Kuba et al., 2021; Rigort et al., 2010; Wu et al., 2020), will be pursued for CorRelator development and subsequent software releases. CorRelator supports interoperability with other imaging tools and provides utility by lowering the barrier for cross-platform workflows and entry of new users to cryo-CLEM imaging. CorRelator is a flexible solution for high-precision correlative cryo-TEM and FLM workflows independently or when coupled with SerialEM for real-time automated cryo-EM/ET data acquisition and is freely available to the community.
Supplementary Material
Acknowledgements
We thank Dr. Larry J. Anderson and Dr. Binh Ha in the Department of Pediatrics, Emory University for generously sharing motavizumab (primary antibody against respiratory syncytial virus glycoprotein F). We thank Dr. Louise Bertrand and Dr. Vikram Kohli for sharing light microscopy and cryo-FLM experience and supporting the Leica THUNDER SVCC hardware. This work was supported in part by the University of Wisconsin, Madison, the Department of Biochemistry at the University of Wisconsin, Madison, and public health service grants R01 GM114561, R01 GM104540, R01 GM104540-03 W1, and U24 GM139168 to E.R.W. from the NIH. The authors gratefully acknowledge use of facilities and instrumentation at the UW-Madison Wisconsin Centers for Nanoscale Technology (wcnt.wisc.edu), which is partially supported by the NSF through the University of Wisconsin Materials Research Science and Engineering Center (DMR-1720415). A portion of this research was supported by NIH grant U24 GM129547 and performed at the PNCC at OHSU and accessed through EMSL (grid.436923.9), a DOE Office of Science User Facility sponsored by the Office of Biological and Environmental Research. We are also grateful for the use of facilities and instrumentation at the Cryo-EM Research Center in the Department of Biochemistry at the University of Wisconsin, Madison during CorRelator’s performance optimization.
Abbreviations:
- CLEM
correlative light and electron microscopy
- CSV
comma-separated value
- EM
electron microscopy
- ET
electron tomography
- FIB-SEM
focused ion-beam scanning electron microscopy
- FLM
fluorescence light microscopy
- FWHM
full-width at half-maximum
- GUI
graphic user interface
- NA
numeric aperture
- OLS
closed-form ordinary least-squares solutions
- PSF
point spread function
- ROI
region of interest
- RSV
respiratory syncytial virus
- RT
room temperature
- SVCC
small volume computational clearance
- TEM
transmission electron microscopy
- TPS
thin plate spline
- 2D/3D
two-/three-dimensional
Appendix-A.
The Navigator module is one of the key functions in SerialEM to save entry metadata, link microscope stage positions and image coordinates, mark positions of interests on map images, guide the stage movements, and to track and reload map images through relative paths. The Navigator maintains a list of Item entries including points and maps. A map is a specialized single-frame image or multi-tile montage that serves as a canvas and defines an area with its four corner stage positions. A point is a single stage location made on a Map. Users start a Navigator file by generating a map that could be collected at a suitable magnification. Targets of interest are made as single points on one map. Under each Item are an organized block of sections, among which values of MapScaleMat, RawStageXYZ, and MapHeightWidth store pixel-to-stage-position matrix information to transform points in pixel positions made on an image to corresponding stage positions. The transformation Mstage2pixel is determined by stage shift calibration (the relationship between stage movements and position on the camera at a particular magnification) in SerialEM, and reported in the map item entries of PtsX and PtsY (X- and Y- stage coordinates of points), MapScaleMat (Stage to pixel scale and rotation matrix for drawing, based on pixels of initial map image), MapWidthHeight (size of initial map image in pixels) and RawStageXY (raw stage position before adjustment for translation). The 2D transformation must fit in:
Where is the stage position and is the corresponding image coordinate pair.
Appendix B. Supplementary data
Supplementary data to this article can be found online at https://doi.org/10.1016/j.jsb.2021.107709.
Footnotes
Declaration of Competing Interest
The authors declare that they have no known competing financial interests or personal relationships that could have appeared to influence the work reported in this paper.
References
- Afzelius BA, Maunsbach AB, 2004. Biological ultrastructure research; the first 50 years. Tissue and Cell 36 (2), 83–94. 10.1016/j.tice:2003.11.001. [DOI] [PubMed] [Google Scholar]
- Agronskaia AV, Valentijn JA, van Driel LF, Schneijdenberg CTWM, Humbel BM, van Bergen en Henegouwen PMP, Verkleij AJ, Koster AJ, Gerritsen HC, 2008. Integrated fluorescence and transmission electron microscopy. Journal of Structural Biology 164 (2), 183–189. 10.1016/j.jsb:2008.07.003. [DOI] [PubMed] [Google Scholar]
- Al-Amoudi A, Chang J-J, Leforestier A, McDowall A, Salamin LM, Norlén LPO, Richter K, Blanc NS, Studer D, Dubochet J, 2004. Cryo-electron microscopy of vitreous sections. EMBO J 23 (18), 3583–3588. 10.1038/sj.emboj.7600366. [DOI] [PMC free article] [PubMed] [Google Scholar]
- Anderson KL, Page C, Swift MF, Hanein D, Volkmann N, 2018. Marker-free method for accurate alignment between correlated light, cryo-light, and electron cryo-microscopy data using sample support features. Journal of Structural Biology 201 (1), 46–51. 10.1016/j.jsb:2017.11.001. [DOI] [PMC free article] [PubMed] [Google Scholar]
- Arnold J, Mahamid J, Lucic V, de Marco A, Fernandez J-J, Laugks T, Mayer T, Hyman AA, Baumeister W, Plitzko Jürgen.M., 2016. Site-Specific Cryo-focused Ion Beam Sample Preparation Guided by 3D Correlative Microscopy. Biophys. J 110 (4), 860–869. 10.1016/j.bpj.2015.10.053. [DOI] [PMC free article] [PubMed] [Google Scholar]
- Baker LA, Grange M, Grünewald K, 2017. Electron cryo-tomography captures macromolecular complexes in native environments. Current Opinion in Structural Biology 46, 149–156. 10.1016/j.sbi.2017.08.005. [DOI] [PubMed] [Google Scholar]
- Bharat TAM, Hoffmann PC, Kukulski W, 2018. Correlative Microscopy of Vitreous Sections Provides Insights into BAR-Domain Organization In Situ. Structure 26 (6), 879–886.e3. 10.1016/j.str.2018.03.015. [DOI] [PMC free article] [PubMed] [Google Scholar]
- Bharat TAM, Kukulski W, 2019. Cryo-Correlative Light and Electron Microscopy: Toward in situ Structural Biology. In: Verkade P, Collinson L (Eds.), Correlative Imaging: Focusing on the Future. Royal Microscopical Society, England, United Kingdom, pp. 137–147. [Google Scholar]
- Bookstein FL, 1989. Principal Warps: Thin-Plate Splines and the Decomposition of Deformations. IEEE Trans. Pattern Anal. Mach. Intell 11 (6), 567–585. 10.1109/34.24792. [DOI] [Google Scholar]
- Briegel A, Chen S, Koster AJ, Plitzko JM, Schwartz CL, Jensen GJ, 2010. Correlated Light and Electron Cryo-Microscopy. Methods Enzymol. Elsevier; 317–341. [DOI] [PubMed] [Google Scholar]
- Buades A, Coll B, Morel JM, 2005. A Non-Local Algorithm for Image Denoising. 2005 IEEE Computer Society Conference on Computer Vision and Pattern Recognition (CVPR’05). [Google Scholar]
- Bykov YS, Cortese M, Briggs JAG, Bartenschlager R, 2016. Correlative light and electron microscopy methods for the study of virus–cell interactions. FEBS Letters. 590 (13), 1877–1895. 10.1002/1873-3468.12153. [DOI] [PubMed] [Google Scholar]
- Commons math: The apache commons mathematics library. 3.6.1. Published 2014, Updated 2015-04-17. https://commons.apache.org/proper/commons-math/.
- Canny J, 1986. A Computational Approach to Edge Detection. IEEE Trans. Pattern Anal. Mach. Intell PAMI-8 (6), 679–698. 10.1109/TPAMI.1986.4767851. [DOI] [PubMed] [Google Scholar]
- Carter SD, Mageswaran SK, Farino ZJ, Mamede JI, Oikonomou CM, Hope TJ, Freyberg Z, Jensen GJ, 2018. Distinguishing signal from autofluorescence in cryogenic correlated light and electron microscopy of mammalian cells. Journal of Structural Biology 201 (1), 15–25. 10.1016/j.jsb:2017.10.009. [DOI] [PMC free article] [PubMed] [Google Scholar]
- Carter SD, Mamede JI, Hope TJ, Jensen GJ, 2020. Correlated cryogenic fluorescence microscopy and electron cryo-tomography shows that exogenous TRIM5α can form hexagonal lattices or autophagy aggregates in vivo. Proc Natl Acad Sci USA 117 (47), 29702–29711. 10.1073/pnas.1920323117. [DOI] [PMC free article] [PubMed] [Google Scholar]
- Castleman KR 1995. Digital Image Processing (Third ed.). [Google Scholar]
- Chang Y-W, Chen S, Tocheva EI, Treuner-Lange A, Löbach S, Søgaard-Andersen L, Jensen GJ, 2014. Correlated cryogenic photoactivated localization microscopy and cryo-electron tomography. Nat Methods 11 (7), 737–739. 10.1038/nmeth.2961. [DOI] [PMC free article] [PubMed] [Google Scholar]
- Chatel-Chaix L, Cortese M, Romero-Brey I, Bender S, Neufeldt CJ, Fischl W, Scaturro P, Schieber N, Schwab Y, Fischer B, Ruggieri A, Bartenschlager R, 2016. Dengue Virus Perturbs Mitochondrial Morphodynamics to Dampen Innate Immune Responses. Cell Host & Microbe 20 (3), 342–356. 10.1016/j.chom.2016.07.008. [DOI] [PMC free article] [PubMed] [Google Scholar]
- Cheutin T, Sauvage C, Tchélidzé P, O’Donohue MF, Kaplan H, Beorchia A, Ploton D, 2007. Visualizing Macromolecules with Fluoronanogold: From Photon Microscopy to Electron Tomography. Methods Cell Biol. Elsevier 559–574. [DOI] [PubMed] [Google Scholar]
- Chlanda P, Sachse M, 2014. Cryo-electron microscopy of vitreous sections. Methods Mol. Biol 1117, 193–214. 10.1007/978-1-62703-776-1_10. [DOI] [PubMed] [Google Scholar]
- Dahlberg PD, Sartor AM, Wang J, Saurabh S, Shapiro L, Moerner WE, 2018. Identification of PAmKate as a Red Photoactivatable Fluorescent Protein for Cryogenic Super-Resolution Imaging. J. Am. Chem. Soc 140 (39), 12310–12313. 10.1021/jacs.8b05960.s003. [DOI] [PMC free article] [PubMed] [Google Scholar]
- Dahlberg PD, Saurabh S, Sartor AM, Wang J, Mitchell PG, Chiu W, Shapiro L, Moerner WE, 2020. Cryogenic single-molecule fluorescence annotations for electron tomography reveal in situ organization of key proteins in Caulobacter. Proc Natl Acad Sci USA 202001849. 10.1073/pnas.2001849117. [DOI] [PMC free article] [PubMed] [Google Scholar]
- Dillard RS, Hampton CM, Strauss JD, Ke Z, Altomara D, Guerrero-Ferreira RC, Kiss G, Wright ER, 2018. Biological Applications at the Cutting Edge of Cryo-Electron Microscopy. Microsc Microanal 24 (4), 406–419. 10.1017/S1431927618012382. [DOI] [PMC free article] [PubMed] [Google Scholar]
- Dubochet J, Adrian M, Chang J-J, Homo J-C, Lepault J, McDowall AW, Schultz P, 1988. Cryo-electron microscopy of vitrified specimens. Quart. Rev. Biophys 21 (2), 129–228. 10.1017/S0033583500004297. [DOI] [PubMed] [Google Scholar]
- Edelstein A, Tsuchida MA, Amodaj N, Pinkard H, Vale RD, Stuurman N, 2014. Advanced methods of microscope control using μManager software. J Biol Methods. 1 (2), 10. 10.14440/jbm.2014.36. [DOI] [PMC free article] [PubMed] [Google Scholar]
- Ertel KJ, Benefield D, Castaño-Diez D, Pennington JG, Horswill M, den Boon JA, Otegui MS, Ahlquist P, 2017. Cryo-electron tomography reveals novel features of a viral RNA replication compartment. eLife 6. 10.7554/eLife.25940. [DOI] [PMC free article] [PubMed] [Google Scholar]
- Faas FGA, Bárcena M, Agronskaia AV, Gerritsen HC, Moscicka KB, Diebolder CA, van Driel LF, Limpens RWAL, Bos E, Ravelli RBG, Koning RI, Koster AJ, 2013. Localization of fluorescently labeled structures in frozen-hydrated samples using integrated light electron microscopy. Journal of Structural Biology 181 (3), 283–290. 10.1016/j.jsb:2012.12.004. [DOI] [PubMed] [Google Scholar]
- Faoro R, Bassu M, Mejia YX, Stephan T, Dudani N, Boeker C, Jakobs S, Burg TP, 2018. Aberration-corrected cryoimmersion light microscopy. Proc Natl Acad Sci USA 115 (6), 1204–1209. 10.1073/pnas.1717282115. [DOI] [PMC free article] [PubMed] [Google Scholar]
- Fokkema J, Fermie J, Liv N, van den Heuvel DJ, Konings TOM, Blab GA, Meijerink A, Klumperman J, Gerritsen HC, 2018. Fluorescently Labelled Silica Coated Gold Nanoparticles as Fiducial Markers for Correlative Light and Electron Microscopy. Sci Rep. 8 (1), 13625. 10.1038/s41598-018-31836-1. [DOI] [PMC free article] [PubMed] [Google Scholar]
- Fu X, Ning J, Zhong Z, Ambrose Z, Charles Watkins S, Zhang P, 2019. AutoCLEM: An Automated Workflow for Correlative Live-Cell Fluorescence Microscopy and Cryo-Electron Tomography. Sci Rep. 9 (1), 19207. 10.1038/s41598-019-55766-8. [DOI] [PMC free article] [PubMed] [Google Scholar]
- Fukuda Y, Schrod N, Schaffer M, Feng LR, Baumeister W, Lucic V, 2014. Coordinate transformation based cryo-correlative methods for electron tomography and focused ion beam milling. Ultramicroscopy 143, 15–23. 10.1016/j.ultramic.2013.11.008. [DOI] [PubMed] [Google Scholar]
- Ganeva I, Kukulski W, 2020. Membrane Architecture in the Spotlight of Correlative Microscopy. Trends in Cell Biology 30 (7), 577–587. 10.1016/j.tcb.2020.04.003. [DOI] [PubMed] [Google Scholar]
- Gonzalez RC, Woods RE, 2002. Digital Image Processing, Second ed. Prentice Hall. [Google Scholar]
- Gorelick S, Buckley G, Gervinskas G, Johnson TK, Handley A, Caggiano MP, Whisstock JC, Pocock R, de Marco A, 2019. PIE-scope, integrated cryo-correlative light and FIB/SEM microscopy. eLife 8. 10.7554/eLife.45919. [DOI] [PMC free article] [PubMed] [Google Scholar]
- Hampton CM, Strauss JD, Ke Z, Dillard RS, Hammonds JE, Alonas E, Desai TM, Marin M, Storms RE, Leon F, Melikyan GB, Santangelo PJ, Spearman PW, Wright ER, 2017. Correlated fluorescence microscopy and cryo-electron tomography of virus-infected or transfected mammalian cells. Nat Protoc 12 (1), 150–167. 10.1038/nprot.2016.168. [DOI] [PMC free article] [PubMed] [Google Scholar]
- Harrison MS, Sakaguchi T, Schmitt AP, 2010. Paramyxovirus assembly and budding: Building particles that transmit infections. The International Journal of Biochemistry & Cell Biology 42 (9), 1416–1429. 10.1016/j.biocel.2010.04.005. [DOI] [PMC free article] [PubMed] [Google Scholar]
- Hayles MF, DAM DEW, 2021. An introduction to cryo-FIB-SEM cross-sectioning of frozen, hydrated Life Science samples. J Microsc 10.1111/jmi.12951. [DOI] [PMC free article] [PubMed] [Google Scholar]
- Hoffman DP, Shtengel G, Xu CS, Campbell KR, Freeman M, Wang L, Milkie DE, Pasolli HA, Iyer N, Bogovic JA, Stabley DR, Shirinifard A, Pang S, Peale D, Schaefer K, Pomp W, Chang C-L, Lippincott-Schwartz J, Kirchhausen T, Solecki DJ, Betzig E, Hess HF, 2020. Correlative three-dimensional super-resolution and block-face electron microscopy of whole vitreously frozen cells. Science 367 (6475), eaaz5357. 10.1126/science:aaz5357. [DOI] [PMC free article] [PubMed] [Google Scholar]
- Holden M, 2008. A Review of Geometric Transformations for Nonrigid Body Registration. IEEE Trans. Med. Imaging 27 (1), 111–128. 10.1109/TMI.2007.904691. [DOI] [PubMed] [Google Scholar]
- Horn BKP, 1987. Closed-form solution of absolute orientation using unit quaternions. J. Opt. Soc. Am. A 4 (4), 629. 10.1364/JOSAA.4.000629. [DOI] [Google Scholar]
- Hotard AL, Shaikh FY, Lee S, Yan D, Teng MN, Plemper RK, Crowe JE Jr., Moore ML, 2012. A stabilized respiratory syncytial virus reverse genetics system amenable to recombination-mediated mutagenesis. Virology 434 (1), 129–136. 10.1016/j.virol.2012.09.022. [DOI] [PMC free article] [PubMed] [Google Scholar]
- Hsieh C, Schmelzer T, Kishchenko G, Wagenknecht T, Marko M, 2014. Practical workflow for cryo focused-ion-beam milling of tissues and cells for cryo-TEM tomography. Journal of Structural Biology 185 (1), 32–41. 10.1016/j.jsb:2013.10.019. [DOI] [PMC free article] [PubMed] [Google Scholar]
- Illingworth J, Kittler J, 1987. The Adaptive Hough Transform. IEEE Trans. Pattern Anal. Mach. Intell PAMI-9 (5), 690–698. 10.1109/TPAMI.1987.4767964. [DOI] [PubMed] [Google Scholar]
- Jun S, Ke D, Debiec K, Zhao G, Meng X, Ambrose Z, Gibson G, Watkins S, Zhang P, 2011. Direct Visualization of HIV-1 with Correlative Live-Cell Microscopy and Cryo-Electron Tomography. Structure 19 (11), 1573–1581. 10.1016/j.str.2011.09.006. [DOI] [PMC free article] [PubMed] [Google Scholar]
- Jun S, Ro H-J, Bharda A, Kim SI, Jeoung D, Jung HS, 2019. Advances in Cryo- Correlative Light and Electron Microscopy: Applications for Studying Molecular and Cellular Events. Protein J 38 (6), 609–615. 10.1007/s10930-019-09856-1. [DOI] [PubMed] [Google Scholar]
- Jun S, Zhao G, Ning J, Gibson GA, Watkins SC, Zhang P, 2013. Correlative Microscopy for 3D Structural Analysis of Dynamic Interactions. JoVE. 76, 50386. 10.3791/50386. [DOI] [PMC free article] [PubMed] [Google Scholar]
- Kaufmann R, Schellenberger P, Seiradake E, Dobbie IM, Jones EY, Davis I, Hagen C, Grünewald K, 2014. Super-Resolution Microscopy Using Standard Fluorescent Proteins in Intact Cells under Cryo-Conditions. Nano Lett. 14 (7), 4171–4175. 10.1021/nl501870p. [DOI] [PMC free article] [PubMed] [Google Scholar]
- Ke Z, Dillard RS, Chirkova T, Leon F, Stobart CC, Hampton CM, Strauss JD, Rajan D, Rostad CA, Taylor JV, Yi H, Shah R, Jin M, Hartert TV, Peebles RS, Graham BS, Moore ML, Anderson LJ, Wright ER, 2018. The Morphology and Assembly of Respiratory Syncytial Virus Revealed by Cryo-Electron Tomography. Viruses 10 (8). 10.3390/v10080446. [DOI] [PMC free article] [PubMed] [Google Scholar]
- Ke Z, Oton J, Qu K, Cortese M, Zila V, McKeane L, Nakane T, Zivanov J, Neufeldt CJ, Cerikan B, Lu JM, Peukes J, Xiong X, Kräusslich H-G, Scheres SHW, Bartenschlager R, Briggs JAG, 2020. Structures and distributions of SARS-CoV-2 spike proteins on intact virions. Nature 588 (7838), 498–502. 10.1038/s41586-020-2665-2. [DOI] [PMC free article] [PubMed] [Google Scholar]
- Ke Z, Strauss JD, Hampton CM, Brindley MA, Dillard RS, Leon F, Lamb KM, Plemper RK, Wright ER, 2018. Promotion of virus assembly and organization by the measles virus matrix protein. Nat. Commun 9 (1), 1736. 10.1038/s41467-018-04058-2. [DOI] [PMC free article] [PubMed] [Google Scholar]
- Kim D, Curthoys NM, Parent MT, Hess ST, 2013. Bleed-through correction for rendering and correlation analysis in multi-colour localization microscopy. J. Opt 15 (9), 094011. 10.1088/2040-8978/15/9/094011. [DOI] [PMC free article] [PubMed] [Google Scholar]
- Kiss G, Holl JM, Williams GM, Alonas E, Vanover D, Lifland AW, Gudheti M, Guerrero-Ferreira RC, Nair V, Yi H, Graham BS, Santangelo PJ, Wright ER, 2014. Structural Analysis of Respiratory Syncytial Virus Reveals the Position of M2–1 between the Matrix Protein and the Ribonucleoprotein Complex. Journal of Virology 88 (13), 7602–7617. 10.1128/JVI.00256-14. [DOI] [PMC free article] [PubMed] [Google Scholar]
- Koning RI, Koster AJ, Sharp TH, 2018. Advances in cryo-electron tomography for biology and medicine. Annals of Anatomy - Anatomischer Anzeiger 217, 82–96. 10.1016/j.aanat.2018.02.004. [DOI] [PubMed] [Google Scholar]
- Kremer JR, Mastronarde DN, McIntosh JR, 1996. Computer Visualization of Three-Dimensional Image Data Using IMOD. Journal of Structural Biology 116 (1), 71–76. 10.1006/jsbi.1996.0013. [DOI] [PubMed] [Google Scholar]
- Kuba J, Mitchels J, Hovorka M, Erdmann P, Berka L, Kirmse R, König J, De Bock J, Goetze B, Rigort A, 2021. Advanced cryo-tomography workflow developments – correlative microscopy, milling automation and cryo-lift-out. Journal of Microscopy 281 (2), 112–124. 10.1111/jmi.12939. [DOI] [PubMed] [Google Scholar]
- Kukulski W, Schorb M, Welsch S, Picco A, Kaksonen M, Briggs JAG, 2011. Correlated fluorescence and 3D electron microscopy with high sensitivity and spatial precision. J Cell Biol. 192 (1), 111–119. 10.1083/jcb.201009037. [DOI] [PMC free article] [PubMed] [Google Scholar]
- Laue M, 2010. Electron microscopy of viruses. Methods Cell Biol. 96, 1–20. 10.1016/s0091-679x(10)96001-9. [DOI] [PubMed] [Google Scholar]
- Le Gros MA, McDermott G, Uchida M, Knoechel CG, Larabell CA, 2009. High-aperture cryogenic light microscopy. J Microsc. 235 (1), 1–8. 10.1111/j.1365-2818.2009.03184.x. [DOI] [PMC free article] [PubMed] [Google Scholar]
- Lee J-Y, Cortese M, Haselmann U, Tabata K, Romero-Brey I, Funaya C, Schieber NL, Qiang Y.u., Bartenschlager M, Kallis S, Ritter C, Rohr K, Schwab Y, Ruggieri A, Bartenschlager R, 2019. Spatiotemporal Coupling of the Hepatitis C Virus Replication Cycle by Creating a Lipid Droplet- Proximal Membranous Replication Compartment. Cell Reports 27 (12), 3602–3617.e5. 10.1016/j.celrep.2019.05.063. [DOI] [PubMed] [Google Scholar]
- Li S, Ji G, Shi Y, Klausen LH, Niu T, Wang S, Huang X, Ding W, Zhang X, Dong M, Xu W, Sun F, 2018. High-vacuum optical platform for cryo-CLEM (HOPE): A new solution for non-integrated multiscale correlative light and electron microscopy. Journal of Structural Biology 201 (1), 63–75. 10.1016/j.jsb:2017.11.002. [DOI] [PubMed] [Google Scholar]
- Li Y-L, Chandrasekaran V, Carter SD, Woodward CL, Christensen DE, Dryden KA, Pornillos O, Yeager M, Ganser-Pornillos BK, Jensen GJ, Sundquist WI, 2016. Primate TRIM5 proteins form hexagonal nets on HIV-1 capsids. eLife 5. 10.7554/eLife.16269. [DOI] [PMC free article] [PubMed] [Google Scholar]
- Liljeroos L, Krzyzaniak MA, Helenius A, Butcher SJ, 2013. Architecture of respiratory syncytial virus revealed by electron cryotomography. Proceedings of the National Academy of Sciences 110 (27), 11133–11138. 10.1073/pnas.1309070110. [DOI] [PMC free article] [PubMed] [Google Scholar]
- Liu B, Xue Y, Zhao W, Chen Y, Fan C, Gu L, Zhang Y, Zhang X, Sun L, Huang X, Ding W, Sun F, Ji W, Xu T, 2015. Three-dimensional super-resolution protein localization correlated with vitrified cellular context. Sci Rep. 5 (1), 13017. 10.1038/srep13017. [DOI] [PMC free article] [PubMed] [Google Scholar]
- Liu C, Mendonça L, Yang Y, Gao Y, Shen C, Liu J, Ni T, Ju B, Liu C, Tang X, Wei J, Ma X, Zhu Y, Liu W, Xu S, Liu Y, Yuan J, Wu J, Liu Z, Zhang Z, Liu L, Wang P, Zhang P, 2020. The Architecture of Inactivated SARS-CoV-2 with Postfusion Spikes Revealed by Cryo-EM and Cryo-ET. Structure 28 (11), 1218–1224. e4. 10.1016/j.str.2020.10.001. [DOI] [PMC free article] [PubMed] [Google Scholar]
- Lučíc V, Rigort A, Baumeister W, 2013. Cryo-electron tomography: The challenge of doing structural biology in situ. J Cell Biol. 202 (3), 407–419. 10.1083/jcb.201304193. [DOI] [PMC free article] [PubMed] [Google Scholar]
- Luque D, Castón JR, 2020. Cryo-electron microscopy for the study of virus assembly. Nat Chem Biol 16 (3), 231–239. 10.1038/s41589-020-0477-1. [DOI] [PubMed] [Google Scholar]
- Mahamid J, Schampers R, Persoon H, Hyman AA, Baumeister W, Plitzko JM, 2015. A focused ion beam milling and lift-out approach for site-specific preparation of frozen-hydrated lamellas from multicellular organisms. Journal of Structural Biology 192 (2), 262–269. 10.1016/j.jsb:2015.07.012. [DOI] [PubMed] [Google Scholar]
- Marko M, Hsieh C, Schalek R, Frank J, Mannella C, 2007. Focused-ion-beam thinning of frozen-hydrated biological specimens for cryo-electron microscopy. Nat Methods 4 (3), 215–217. 10.1038/nmeth1014. [DOI] [PubMed] [Google Scholar]
- Mastronarde DN, 2005. Automated electron microscope tomography using robust prediction of specimen movements. Journal of Structural Biology 152 (1), 36–51. 10.1016/j.jsb:2005.07.007. [DOI] [PubMed] [Google Scholar]
- McDonald KL, 2009. A review of high-pressure freezing preparation techniques for correlative light and electron microscopy of the same cells and tissues. J Microsc. 235 (3), 273–281. 10.1111/j.1365-2818.2009.03218.x. [DOI] [PubMed] [Google Scholar]
- Melia CE, van der Schaar HM, Lyoo H, Limpens RWAL, Feng Q, Wahedi M, Overheul GJ, van Rij RP, Snijder EJ, Koster AJ, Bárcena M, van Kuppeveld FJM, 2017. Escaping Host Factor PI4KB Inhibition: Enterovirus Genomic RNA Replication in the Absence of Replication Organelles. Cell Reports 21 (3), 587–599. 10.1016/j.celrep.2017.09.068. [DOI] [PMC free article] [PubMed] [Google Scholar]
- Moser F, Pražák V, Mordhorst V, Andrade DM, Baker LA, Hagen C, Grünewald K, Kaufmann R, 2019. Cryo-SOFI enabling low-dose super-resolution correlative light and electron cryo-microscopy. Proc Natl Acad Sci USA 116 (11), 4804–4809. 10.1073/pnas.1810690116. [DOI] [PMC free article] [PubMed] [Google Scholar]
- Nahmani M, Lanahan C, DeRosier D, Turrigiano GG, 2017. High-numerical-aperture cryogenic light microscopy for increased precision of superresolution reconstructions. Proc Natl Acad Sci USA 114 (15), 3832–3836. 10.1073/pnas.1618206114. [DOI] [PMC free article] [PubMed] [Google Scholar]
- Neufeldt CJ, Cortese M, Acosta EG, Bartenschlager R, 2018. Rewiring cellular networks by members of the Flaviviridae family. Nat Rev Microbiol 16 (3), 125–142. 10.1038/nrmicro.2017.170. [DOI] [PMC free article] [PubMed] [Google Scholar]
- Oomens AGP, Bevis KP, Wertz GW, 2006. The Cytoplasmic Tail of the Human Respiratory Syncytial Virus F Protein Plays Critical Roles in Cellular Localization of the F Protein and Infectious Progeny Production. JVI 80 (21), 10465–10477. 10.1128/JVI.01439-06. [DOI] [PMC free article] [PubMed] [Google Scholar]
- Passmore LA, Russo CJ, 2016. Specimen Preparation for High-Resolution Cryo-EM. Methods Enzymol. 579, 51–86. 10.1016/bs.mie.2016.04.011. [DOI] [PMC free article] [PubMed] [Google Scholar]
- Paul-Gilloteaux P, Heiligenstein X, Belle M, Domart M-C, Larijani B, Collinson L, Raposo G, Salamero J, 2017. eC-CLEM: flexible multidimensional registration software for correlative microscopies. Nat Methods 14 (2), 102–103. 10.1038/nmeth.4170. [DOI] [PubMed] [Google Scholar]
- Pettersen EF, Goddard TD, Huang CC, Meng EC, Couch GS, Croll TI, Morris JH, Ferrin TE, 2020. UCSF ChimeraX: Structure visualization for researchers, educators, and developers. Protein Sci. 10.1002/pro.3943. [DOI] [PMC free article] [PubMed] [Google Scholar]
- Peukes J, Xiong X, Erlendsson S, Qu K, Wan W, Calder LJ, Schraidt O, Kummer S, Freund SMV, Kräusslich H-G, Briggs JAG, 2020. The native structure of the assembled matrix protein 1 of influenza A virus. Nature 587 (7834), 495–498. 10.1038/s41586-020-2696-8. [DOI] [PMC free article] [PubMed] [Google Scholar]
- Riedel C, Vasishtan D, Siebert CA, Whittle C, Lehmann MJ, Mothes W, Grünewald K, 2017. Native structure of a retroviral envelope protein and its conformational change upon interaction with the target cell. Journal of Structural Biology 197 (2), 172–180. 10.1016/j.jsb:2016.06.017. [DOI] [PMC free article] [PubMed] [Google Scholar]
- Rigort A, Bäuerlein FJB, Leis A, Gruska M, Hoffmann C, Laugks T, Böhm U, Eibauer M, Gnaegi H, Baumeister W, Plitzko JM, 2010. Micromachining tools and correlative approaches for cellular cryo-electron tomography. Journal of Structural Biology 172 (2), 169–179. 10.1016/j.jsb:2010.02.011. [DOI] [PubMed] [Google Scholar]
- Rigort A, Bauerlein FJB, Villa E, Eibauer M, Laugks T, Baumeister W, Plitzko JM, 2012a. Focused ion beam micromachining of eukaryotic cells for cryoelectron tomography. Proceedings of the National Academy of Sciences 109 (12), 4449–4454. 10.1073/pnas.1201333109. [DOI] [PMC free article] [PubMed] [Google Scholar]
- Rigort A, Villa E, Bäuerlein FJB, Engel BD, Plitzko JM, 2012b. Chapter 14 - Integrative Approaches for Cellular Cryo-electron Tomography: Correlative Imaging and Focused Ion Beam Micromachining. In: Müller-Reichert T, Verkade P (Eds.), Methods Cell Biol. Academic Press, pp. 259–281. [DOI] [PubMed] [Google Scholar]
- Romero-Brey I, 2018. 3D Electron Microscopy (EM) and Correlative Light Electron Microscopy (CLEM) Methods to Study Virus-Host Interactions. Methods Mol. Biol 1836, 213–236. 10.1007/978-1-4939-8678-1_11. [DOI] [PubMed] [Google Scholar]
- Romero-Brey I, Bartenschlager R, 2015. Viral Infection at High Magnification: 3D Electron Microscopy Methods to Analyze the Architecture of Infected Cells. Viruses. 7 (12), 6316–6345. 10.3390/v7122940. [DOI] [PMC free article] [PubMed] [Google Scholar]
- Romero-Brey I, Merz A, Chiramel A, Lee JY, Chlanda P, Haselman U, Santarella-Mellwig R, Habermann A, Hoppe S, Kallis S, Walther P, Antony C, Krijnse-Locker J, Bartenschlager R, 2012. Three-dimensional architecture and biogenesis of membrane structures associated with hepatitis C virus replication. PLoS Pathog. 8 (12) 10.1371/journal.ppat.1003056. [DOI] [PMC free article] [PubMed] [Google Scholar]
- Rossignol ED, Peters KN, Connor JH, Bullitt E, 2017. Zika virus induced cellular remodelling. Cellular Microbiology 19 (8), e12740. 10.1111/cmi.12740. [DOI] [PMC free article] [PubMed] [Google Scholar]
- Rossignol ED, Yang JE, Bullitt E, 2015. The Role of Electron Microscopy in Studying the Continuum of Changes in Membranous Structures during Poliovirus Infection. Viruses. 7 (10), 5305–5318. 10.3390/v7102874. [DOI] [PMC free article] [PubMed] [Google Scholar]
- Salje J, Zuber B, Lowe J, 2009. Electron Cryomicroscopy of E. coli Reveals Filament Bundles Involved in Plasmid DNA Segregation. Science 323 (5913), 509–512. 10.1126/science:1164346. [DOI] [PubMed] [Google Scholar]
- Sartori A, Gatz R, Beck F, Rigort A, Baumeister W, Plitzko JM, 2007. Correlative microscopy: Bridging the gap between fluorescence light microscopy and cryo-electron tomography. Journal of Structural Biology 160 (2), 135–145. 10.1016/j.jsb:2007.07.011. [DOI] [PubMed] [Google Scholar]
- Sartori-Rupp A, Cordero Cervantes D, Pepe A, Gousset K, Delage E, CorroyerDulmont S, Schmitt C, Krijnse-Locker J, Zurzolo C, 2019. Correlative cryo-electron microscopy reveals the structure of TNTs in neuronal cells. Nat. Commun 10 (1), 342. 10.1038/s41467-018-08178-7. [DOI] [PMC free article] [PubMed] [Google Scholar]
- Schaffer M, Pfeffer S, Mahamid J, Kleindiek S, Laugks T, Albert S, Engel BD, Rummel A, Smith AJ, Baumeister W, Plitzko JM, 2019. A cryo-FIB lift-out technique enables molecular-resolution cryo-ET within native Caenorhabditis elegans tissue. Nat Methods 16 (8), 757–762. 10.1038/s41592-019-0497-5. [DOI] [PubMed] [Google Scholar]
- Schellenberger P, Kaufmann R, Siebert CA, Hagen C, Wodrich H, Grünewald K, 2014. High-precision correlative fluorescence and electron cryo microscopy using two independent alignment markers. Ultramicroscopy 143, 41–51. 10.1016/j.ultramic.2013.10.011. [DOI] [PMC free article] [PubMed] [Google Scholar]
- Schindelin J, Arganda-Carreras I, Frise E, Kaynig V, Longair M, Pietzsch T, Preibisch S, Rueden C, Saalfeld S, Schmid B, Tinevez J-Y, White DJ, Hartenstein V, Eliceiri K, Tomancak P, Cardona A, 2012. Fiji: an open-source platform for biological-image analysis. Nat Methods 9 (7), 676–682. 10.1038/nmeth.2019. [DOI] [PMC free article] [PubMed] [Google Scholar]
- Schorb M, Briggs JAG, 2014. Correlated cryo-fluorescence and cryo-electron microscopy with high spatial precision and improved sensitivity. Ultramicroscopy 143, 24–32. 10.1016/j.ultramic.2013.10.015. [DOI] [PMC free article] [PubMed] [Google Scholar]
- Schorb M, Gaechter L, Avinoam O, Sieckmann F, Clarke M, Bebeacua C, Bykov YS, Sonnen A-P, Lihl R, Briggs JAG, 2017. New hardware and workflows for semi-automated correlative cryo-fluorescence and cryo-electron microscopy/tomography. Journal of Structural Biology 197 (2), 83–93. 10.1016/j.jsb:2016.06.020. [DOI] [PMC free article] [PubMed] [Google Scholar]
- Schorb M, Haberbosch I, Hagen WJH, Schwab Y, Mastronarde DN, 2019. Software tools for automated transmission electron microscopy. Nat Methods 16 (6), 471–477. 10.1038/s41592-019-0396-9. [DOI] [PMC free article] [PubMed] [Google Scholar]
- Schorb M, Sieckmann F, 2017. Matrix MAPS-an intuitive software to acquire, analyze, and annotate light microscopy data for CLEM. Methods Cell Biol. 140, 321–333. 10.1016/bs.mcb.2017.03.012. [DOI] [PubMed] [Google Scholar]
- Schwartz CL, Sarbash VI, Ataullakhanov FI, McIntosh JR, Nicastro D, 2007. Cryo-fluorescence microscopy facilitates correlations between light and cryo-electron microscopy and reduces the rate of photobleaching. J Microsc. 227 (Pt 2), 98–109. 10.1111/j.1365-2818.2007.01794.x. [DOI] [PubMed] [Google Scholar]
- Strauss JD, Hammonds JE, Yi H, Ding L, Spearman P, Wright ER, Kirchhoff F, 2016. Three-Dimensional Structural Characterization of HIV-1 Tethered to Human Cells. J. Virol 90 (3), 1507–1521. 10.1128/JVI.01880-15. [DOI] [PMC free article] [PubMed] [Google Scholar]
- Studer D, Humbel BM, Chiquet M, 2008. Electron microscopy of high pressure frozen samples: bridging the gap between cellular ultrastructure and atomic resolution. Histochem Cell Biol 130 (5), 877–889. 10.1007/s00418-008-0500-1. [DOI] [PubMed] [Google Scholar]
- Sun R, Liu Y-T, Tao C-L, Qi L, Lau P-M, Zhou ZH, Bi G-Q, 2019. An efficient protocol of cryo-correlative light and electron microscopy for the study of neuronal synapses. Biophys Rep 5 (3), 111–122. 10.1007/s41048-019-0092-4. [DOI] [Google Scholar]
- Sutton G, Sun D, Fu X, Kotecha A, Hecksel CW, Clare DK, Zhang P, Stuart DI, Boyce M, 2020. Assembly intermediates of orthoreovirus captured in the cell. Nat. Commun 11 (1), 4445. 10.1038/s41467-020-18243-9. [DOI] [PMC free article] [PubMed] [Google Scholar]
- Szeliski R, 2011. Computer vision: algorithms and applications. Springer, London. [Google Scholar]
- Tang G, Peng L, Baldwin PR, Mann DS, Jiang W, Rees I, Ludtke SJ, 2007. EMAN2: An extensible image processing suite for electron microscopy. Journal of Structural Biology 157 (1), 38–46. 10.1016/j.jsb:2006.05.009. [DOI] [PubMed] [Google Scholar]
- Tao C-L, Liu Y-T, Sun R, Zhang B, Qi L, Shivakoti S, Tian C-L, Zhang P, Lau P-M, Zhou ZH, Bi G-Q, 2018. Differentiation and Characterization of Excitatory and Inhibitory Synapses by Cryo-electron Tomography and Correlative Microscopy. J. Neurosci 38 (6), 1493–1510. 10.1523/JNEUROSCI.1548-17.2017.video.5. [DOI] [PMC free article] [PubMed] [Google Scholar]
- Thompson RF, Walker M, Siebert CA, Muench SP, Ranson NA, 2016. An introduction to sample preparation and imaging by cryo-electron microscopy for structural biology. Methods 100, 3–15. 10.1016/j.ymeth.2016.02.017. [DOI] [PMC free article] [PubMed] [Google Scholar]
- Tuijtel MW, Koster AJ, Jakobs S, Faas FGA, Sharp TH, 2019. Correlative cryo super-resolution light and electron microscopy on mammalian cells using fluorescent proteins. Sci Rep. 9 (1), 1369. 10.1038/s41598-018-37728-8. [DOI] [PMC free article] [PubMed] [Google Scholar]
- Unchwaniwala N, Zhan H, Pennington J, Horswill M, den Boon JA, Ahlquist P, 2020. Subdomain cryo-EM structure of nodaviral replication protein A crown complex provides mechanistic insights into RNA genome replication. Proc Natl Acad Sci USA 117 (31), 18680–18691. 10.1073/pnas.2006165117. [DOI] [PMC free article] [PubMed] [Google Scholar]
- van Driel LF, Valentijn JA, Valentijn KM, Koning RI, Koster AJ, 2009. Tools for correlative cryo-fluorescence microscopy and cryo-electron tomography applied to whole mitochondria in human endothelial cells. European Journal of Cell Biology 88 (11), 669–684. 10.1016/j.ejcb.2009.07.002. [DOI] [PubMed] [Google Scholar]
- Wagner FR, Watanabe R, Schampers R, Singh D, Persoon H, Schaffer M, Fruhstorfer P, Plitzko J, Villa E, 2020. Preparing samples from whole cells using focused-ion-beam milling for cryo-electron tomography. Nat Protoc 15 (6), 2041–2070. 10.1038/s41596-020-0320-x. [DOI] [PMC free article] [PubMed] [Google Scholar]
- Wan W, Kolesnikova L, Clarke M, Koehler A, Noda T, Becker S, Briggs JAG, 2017. Structure and assembly of the Ebola virus nucleocapsid. Nature 551 (7680), 394–397. 10.1038/nature24490. [DOI] [PMC free article] [PubMed] [Google Scholar]
- Wang L, Bateman B, Zanetti-Domingues LC, Moores AN, Astbury S, Spindloe C, Darrow MC, Romano M, Needham SR, Beis K, Rolfe DJ, Clarke DT, Martin-Fernandez ML, 2019. Solid immersion microscopy images cells under cryogenic conditions with 12 nm resolution. Commun Biol 2 (1). 10.1038/s42003-019-0317-6. [DOI] [PMC free article] [PubMed] [Google Scholar]
- Weisenburger S, Boening D, Schomburg B, Giller K, Becker S, Griesinger C, Sandoghdar V, 2017. Cryogenic optical localization provides 3D protein structure data with Angstrom resolution. Nat Methods 14 (2), 141–144. 10.1038/nmeth.4141. [DOI] [PubMed] [Google Scholar]
- Wolff G, Hagen C, Grünewald K, Kaufmann R, 2016. Towards correlative super-resolution fluorescence and electron cryo-microscopy: Towards super-resolution cryo-CLEM. Biol. Cell 108 (9), 245–258. 10.1111/boc.201600008. [DOI] [PMC free article] [PubMed] [Google Scholar]
- Wu G-H, Mitchell PG, Galaz-Montoya JG, Hecksel CW, Sontag EM, Gangadharan V, Marshman J, Mankus D, Bisher ME, Lytton-Jean AKR, Frydman J, Czymmek K, Chiu W, 2020. Multi-scale 3D Cryo-Correlative Microscopy for Vitrified Cells. Structure 28 (11), 1231–1237.e3. 10.1016/j.str.2020.07.017. [DOI] [PMC free article] [PubMed] [Google Scholar]
- Yang Z, Lasker K, Schneidman-Duhovny D, Webb B, Huang CC, Pettersen EF, Goddard TD, Meng EC, Sali A, Ferrin TE, 2012. UCSF Chimera, MODELLER, and IMP: An integrated modeling system. Journal of Structural Biology 179 (3), 269–278. 10.1016/j.jsb:2011.09.006. [DOI] [PMC free article] [PubMed] [Google Scholar]
- Yi H, Strauss JD, Ke Z, Alonas E, Dillard RS, Hampton CM, Lamb KM, Hammonds JE, Santangelo PJ, Spearman PW, Wright ER, 2015. Native Immunogold Labeling of Cell Surface Proteins and Viral Glycoproteins for Cryo-Electron Microscopy and Cryo-Electron Tomography Applications. J Histochem Cytochem. 63 (10), 780–792. 10.1369/0022155415593323. [DOI] [PMC free article] [PubMed] [Google Scholar]
- Zeev-Ben-Mordehai T, Vasishtan D, Hernández Durán A, Vollmer B, White P, Prasad Pandurangan A, Siebert CA, Topf M, Grünewald K, 2016. Two distinct trimeric conformations of natively membrane-anchored full-length herpes simplex virus 1 glycoprotein B. Proc Natl Acad Sci USA 113 (15), 4176–4181. 10.1073/pnas.1523234113. [DOI] [PMC free article] [PubMed] [Google Scholar]
- Zhang P, 2013. Correlative cryo-electron tomography and optical microscopy of cells. Current Opinion in Structural Biology 23 (5), 763–770. 10.1016/j.sbi.2013.07.017. [DOI] [PMC free article] [PubMed] [Google Scholar]
- Zhou H, Kuang Y, Yu Z, Ren S, Zhang Y, Lu T, Ma J, 2018. Image Deformation With Vector-Field Interpolation Based on MRLS-TPS. IEEE Access 6, 75886–75898. 10.1109/ACCESS.2018.2876884. [DOI] [Google Scholar]
- Zhu Y, Sun D, Schertel A, Ning J, Fu X, Gwo PP, Watson AM, Zanetti-Domingues LC, Martin-Fernandez ML, Freyberg Z, Zhang P, 2021. Serial cryoFIB/SEM Reveals Cytoarchitectural Disruptions in Leigh Syndrome Patient Cells. Structure 29 (1), 82–87.e3. 10.1016/j.str.2020.10.003. [DOI] [PMC free article] [PubMed] [Google Scholar]
- Zuber B, Chami M, Houssin C, Dubochet J, Griffiths G, Daffé M, 2008. Direct Visualization of the Outer Membrane of Mycobacteria and Corynebacteria in Their Native State. JB 190 (16), 5672–5680. 10.1128/JB.01919-07. [DOI] [PMC free article] [PubMed] [Google Scholar]
Associated Data
This section collects any data citations, data availability statements, or supplementary materials included in this article.