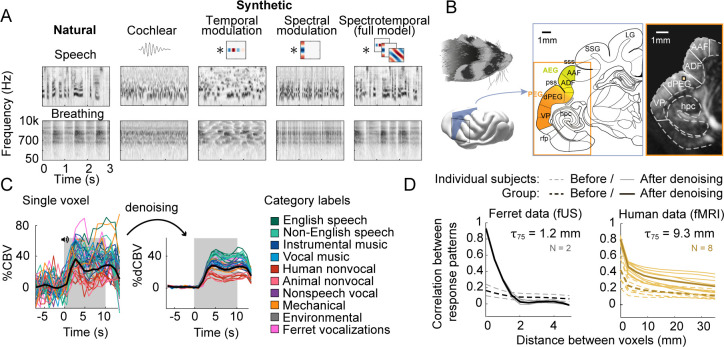
Figure 1. Schematic of stimuli and imaging protocol.
(A) Cochleagrams for two example natural sounds (left column) and corresponding synthetic sounds (right four columns) that were matched to the natural sounds along a set of acoustic statistics of increasing complexity. Statistics were measured by filtering a cochleagram with filters tuned to temporal, spectral, or joint spectrotemporal modulations. (B) Schematic of the imaging procedure. A three-dimensional volume, covering all of ferret auditory cortex, was acquired through successive coronal slices. Auditory cortical regions (colored regions) were mapped with anatomical and functional markers (Radtke-Schuller, 2018). The rightmost image shows a single ultrasound image with overlaid region boundaries. Auditory regions: dPEG: dorsal posterior ectosylvian gyrus; AEG: anterior ectosylvian gyrus; VP: ventral posterior auditory field; ADF: anterior dorsal field; AAF: anterior auditory field. Non-auditory regions: hpc: hippocampus; SSG: suprasylvian gyrus; LG: lateral gyrus. Anatomical markers: pss: posterior sylvian sulcus; sss: superior sylvian sulcus. (C) Response timecourse of a single voxel to all natural sounds, before (left) and after (right) denoising. Each line reflects a different sound, and its color indicates its membership in one of 10 different categories. English and non-English speech are separated out because all of the human subjects tested in our prior study were native English speakers, and so the distinction is meaningful in humans. The gray region shows the time window when sound was present. We summarized the response of each voxel by measuring its average response to each sound between 3 and 11 s post-stimulus onset. The location of this voxel corresponds to the highlighted voxel in panel B. (D) We measured the correlation across sounds between pairs of voxels as a function or their distance using two independent measurements of the response (odd vs. even repetitions). Results are plotted separately for ferret fUS data (left) and human fMRI data (right). The 0 mm datapoint provides a measure of test–retest reliability and the fall-off with distance provides a measure of spatial precision. Results are shown before and after component denoising. Note that in our prior fMRI study we did not use component denoising because the voxels were sufficiently reliable; we used component-denoised human data here to make the human and ferret analyses more similar (findings did not depend on this choice: see Figure 1—figure supplement 2). The distance needed for the correlation to decay by 75% is shown above each plot (). The human data were smoothed using a 5 MM FWHM kernel, the same amount used in our prior study, but fMRI responses were still coarser when using unsmoothed data ( = 6.5 mm; findings did not depend on the presence/absence of smoothing). Thin lines show data from individual human (N = 8) and ferret (N = 2) subjects, and thick lines show the average across subjects.


