. 2021 Nov 18;10:e65566. doi: 10.7554/eLife.65566

Figure 3. Organization of frequency and modulation tuning in ferret auditory cortex, as revealed by component analysis.

(A) For reference with the weight maps in panel (B), a tonotopic map is shown, measured using pure tones. The map is from one hemisphere of one animal (ferret T, left). (B) Voxel weight maps from three components, inferred using responses to natural and synthetic sounds (see Figure 3—figure supplement 1 for all eight components and Figure 3—figure supplement 2 for all hemispheres). The maps for components f1 and f2 closely mirrored the high- and low-frequency tonotopic gradients, respectively. (C) Component response to natural and spectrotemporally matched synthetic sounds, colored based on category labels (labels shown at the bottom left of the figure). Component f3 responded preferentially to speech sounds. (D) Correlation of component responses with energy at different audio frequencies, measured from a cochleagram. Inset for f3 shows the correlation pattern that would be expected from a response that was perfectly speech selective (i.e., 1 for speech, 0 for all other sounds). (E) Correlations with modulation energy at different temporal and spectral rates. Inset shows the correlation pattern that would be expected for a speech-selective response. Results suggest that f3 responds to particular frequency and modulation statistics that happen to differ between speech and other sounds.

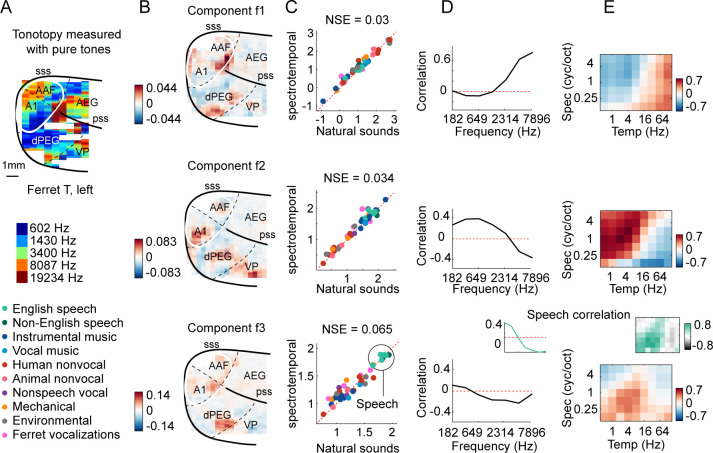
Figure 3.

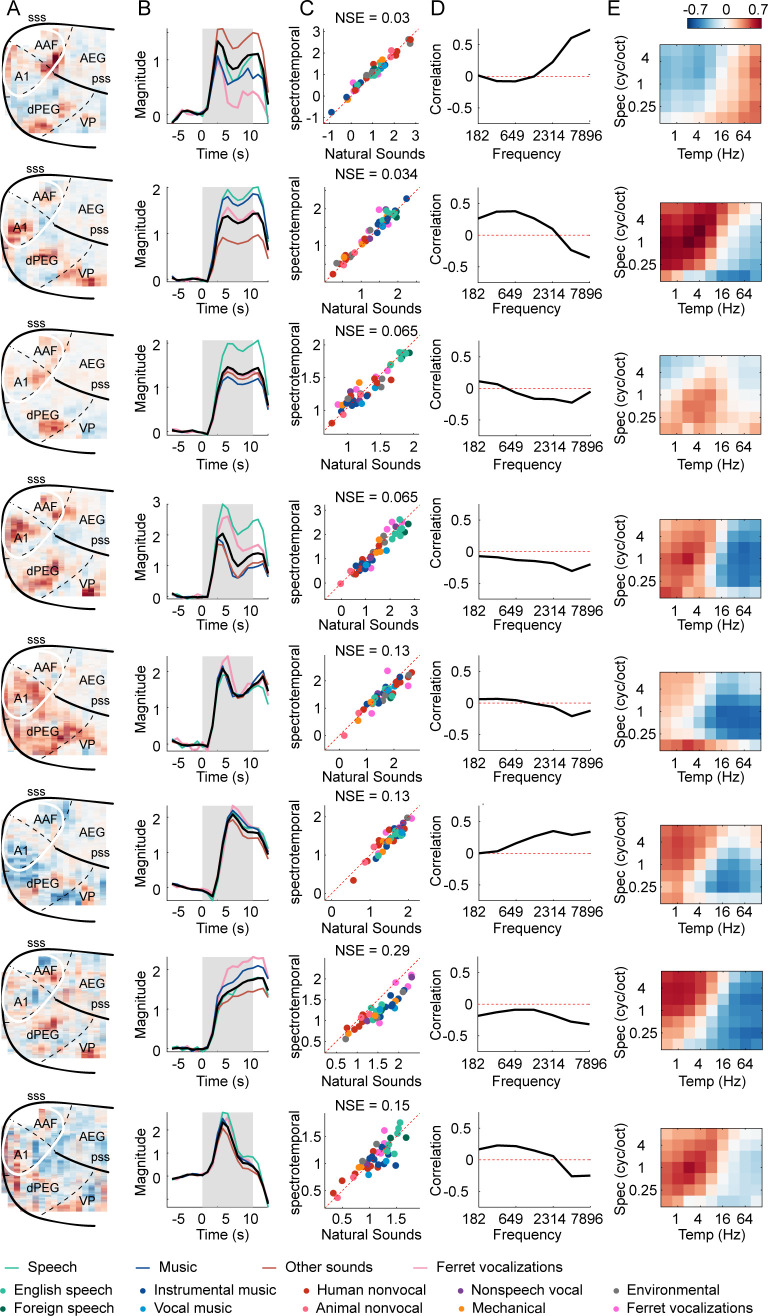
Figure 3—figure supplement 1. Results from all eight ferret components.

Figure 3—figure supplement 1.

(A) Voxel weight map for each component. (B) The temporal response of each component. Black line shows the average timecourse across all natural sounds. Colored lines correspond to major categories (see Supplementary file 1): speech (green), music (blue), vocalizations (pink), and other sounds (brown). Note that the temporal shape varies across components, but is very similar across sounds/categories within a component, which is why we summarized component responses by their time-averaged response to each sound. (C) Time-averaged component responses to natural and spectrotemporally matched synthetic sounds, colored based on category labels. (D) Correlation of component responses with energy at different audio frequencies, measured from a cochleagram. (E) Correlations with modulation energy at different temporal and spectral rates.
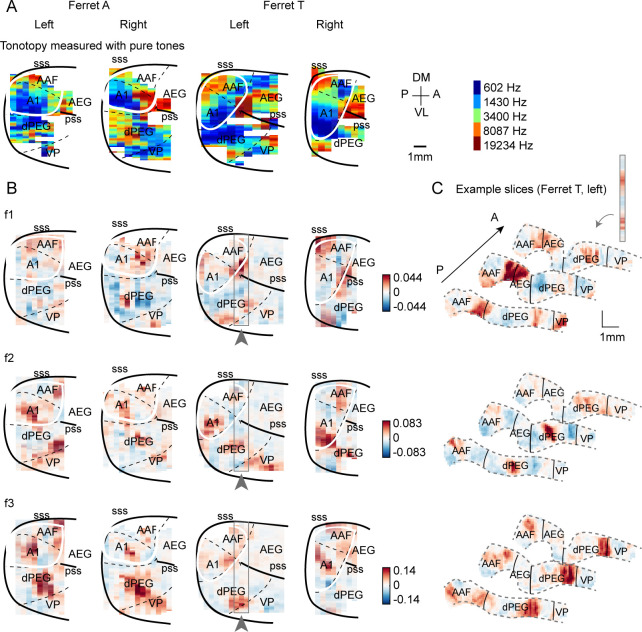
Figure 3—figure supplement 2. Component weight maps from all hemispheres and ferrets.

Figure 3—figure supplement 2.

(A) For reference with the weight maps in panel (B), tonotopic maps measured using pure tones are shown for all hemispheres. (B) Voxel weight maps from the three components shown in Figure 3 for all hemispheres of all ferrets tested. (C) Voxel weights for three example coronal slices from ferret T, left hemisphere. Gray outlines in panel (B) indicate their location in the ‘surface’ view. Each slice corresponds to one vertical strip from the maps in panel (B). The same slices are shown for all three components.
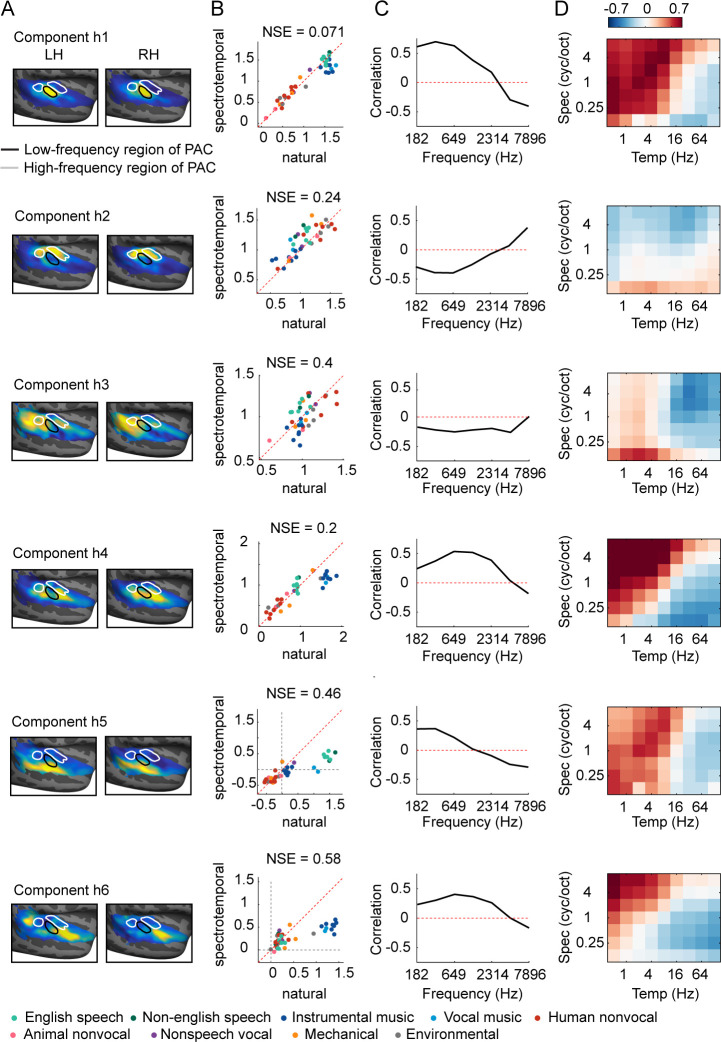
Figure 3—figure supplement 3. Human components.

Figure 3—figure supplement 3.

This figure shows the anatomy and response properties of the six human components inferred in prior work (Norman-Haignere et al., 2015; Norman-Haignere et al., 2018). (A) Voxel weight map for each component, averaged across subjects. (B) Component responses to natural and spectrotemporally matched synthetic sounds, colored based on category labels. (C) Correlation of component responses with energy at different audio frequencies, measured from a cochleagram. (D) Correlations with modulation energy at different temporal and spectral rates.
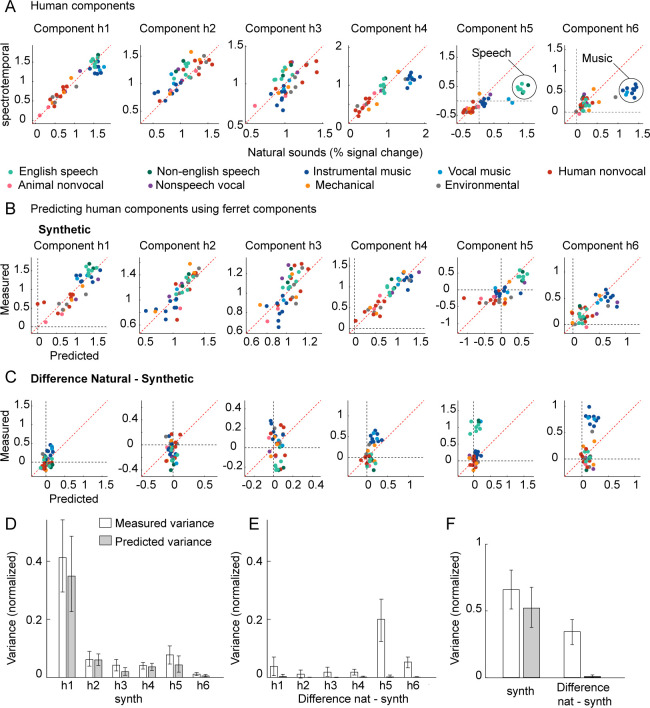
Figure 3—figure supplement 4. Predicting human component responses from ferret components.

Figure 3—figure supplement 4.

This figure plots the results of trying to predict the six human components inferred from our prior work (Norman-Haignere et al., 2015; Norman-Haignere et al., 2018) from the eight ferret components inferred here (see Figure 3—figure supplement 5 for the reverse). (A) For reference, the response of the six human components to natural and spectrotemporally matched synthetic sounds is re-plotted here. Components h1–h4 produced similar responses to natural and synthetic sounds and had weights that clustered in and around primary auditory cortex (Figure 3—figure supplement 3). Components h5 and h6 responded selectively to natural speech and natural music, respectively, and had weights that clustered in non-primary regions. (B) This panel plots the measured response of each human component to just the spectrotemporally matched synthetic sounds, along with the predicted response from ferrets. (C) This panel plots the difference between responses to natural and spectrotemporally matched synthetic sounds along with the predicted difference from the ferret components. (D) This panel plots the total response variance (white bars) of each human component to synthetic sounds (left) and to the difference between natural and synthetic sounds (right) along with the fraction of that total response variance predictable from ferrets (gray bars) (all variance measures are noise-corrected). Error bars show the 95% confidence interval, computed via bootstrapping across the sound set. (E) Same as (D), but averaged across components.
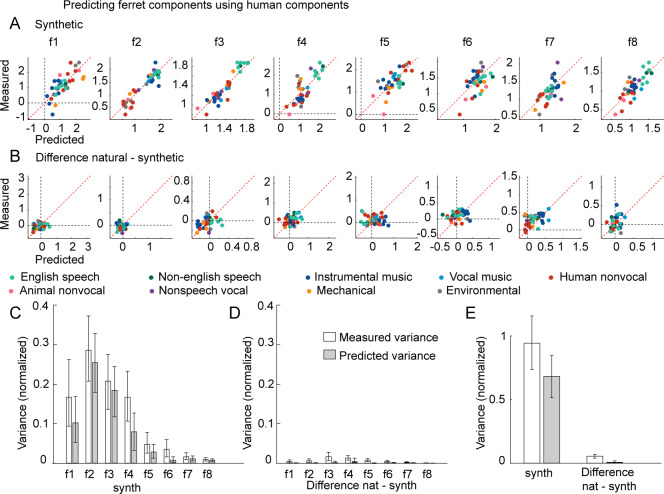
Figure 3—figure supplement 5. Predicting ferret component responses from human components.

Figure 3—figure supplement 5.

(A) This panel plots the measured response of each ferret component to just the spectrotemporally matched synthetic sounds, along with the predicted response from humans. (B) This panel plots the difference between responses to natural and spectrotemporally matched synthetic sounds along with the predicted difference from the human components. (C-D) This panel plots the total response variance (white bars) of each ferret component to synthetic sounds (C) and to the difference between natural and synthetic sounds (D) along with the fraction of that total response variance predictable from humans (gray bars) (all variance measures are noise-corrected). Error bars show the 95% confidence interval, computed via bootstrapping across the sound set. (E) Same as (C-D), but averaged across components.