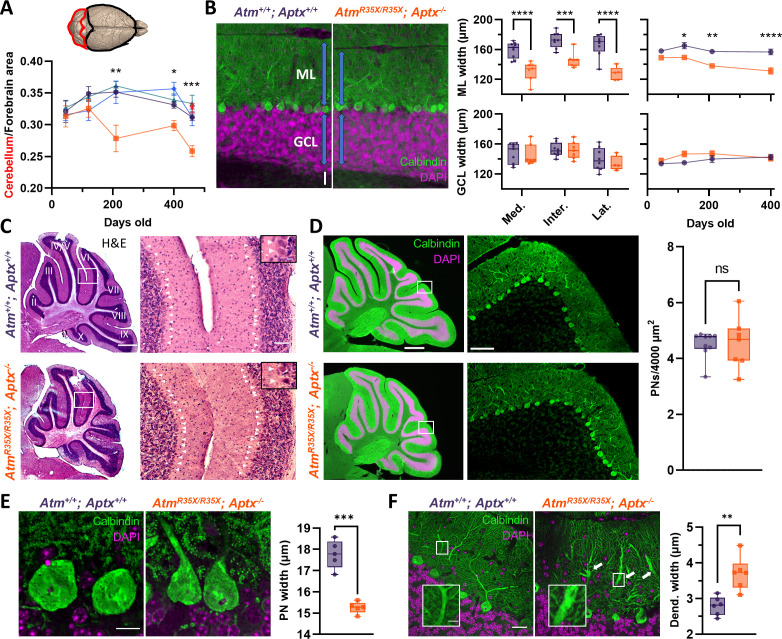
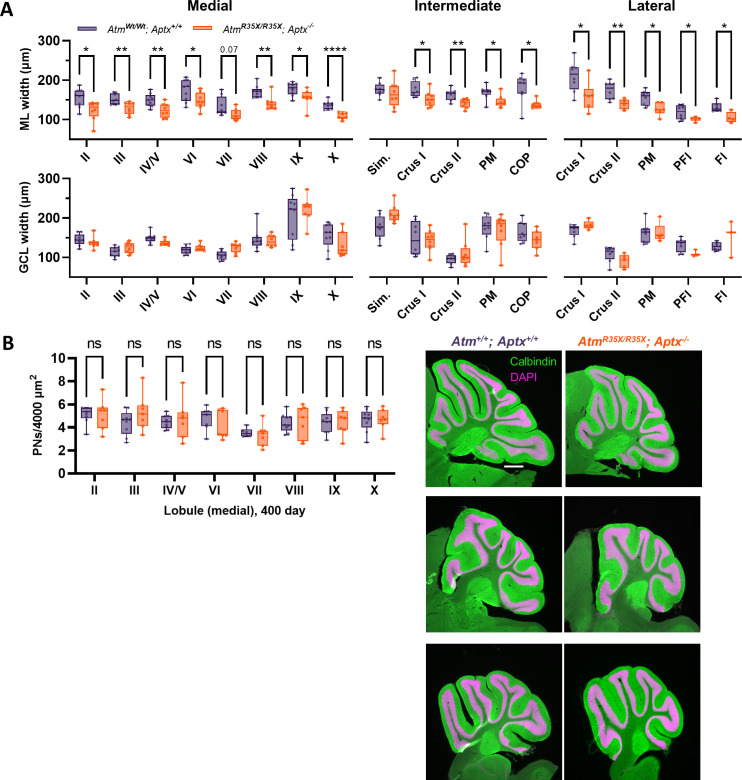
Figure 5. Cerebellar atrophy is associated with a progressive reduction in molecular layer (ML) width and pathological changes in PN morphology but not PN cell death.
(A) Cartoon image of the brain highlighting the dorsal forebrain and cerebellar surface. Area estimates from dorsal images of the brain were used to determine the cerebellum to forebrain ratio allowing us to control for any differences in overall size of the brain. We found the cerebellum decreased in size over age in AtmR35X/R35X; Aptx−/− (n=5–10), but not control mice (Atm+/+; Aptx+/+ [n=4–20], Atm+/+; Aptx−/− [n=4–12], AtmR35X/R35X; Aptx+/+ [n=6–16], AtmR35X/+; Aptx−/− [n=6]). (B) Left: Immunofluorescent images of parasagittal cerebellar sections illustrating the length (blue arrows) of PN dendrites in the ML (green) and width of the granule cell layer (GCL; magenta) in Atm+/+; Aptx+/+ and AtmR35X/R35X; Aptx−/− mice (P400; medial cerebellar lobule VIII). Scale bar=50 μm. Middle: Summary graphs of ML and GCL width measurements averaged across all lobules in sections from the medial, intermediate, and lateral parts of the cerebellum (P400). Right: Average ML and GCL widths at different ages in the medial cerebellum (n=5–7). (C) Left: H&E stained, parasagittal cerebellar sections from P400 Atm+/+; Aptx+/+ (top) and AtmR35X/R35X; Aptx−/− (bottom) mice. Scale bar=500 μm Right: Magnified view (from white box) of PNs (white triangles) in cerebellar lobules 4/5 and 6. Scale bar=50 μm, inset 10 μm Right: The average density of PNs across all lobules in the medial cerebellum of Atm+/+; Aptx+/+ (n=9) and AtmR35X/R35X; Aptx−/− (n=7) P400 mice do not differ. (D) Left: Whole cerebellar, fluorescent images and magnified view of folia VIII (from white box). Scale bar=500 μm left, 75 μm right. Right: Average density of Calbindin positive PNs across the whole cerebellum (n=7–9). (E) Left: Optically sectioned fluorescent images illustrate the smaller size of PNs in AtmR35X/R35X; Aptx−/− mice. Right: Plot of the average width of PN somas randomly sampled from across the cerebellum (n=5). Scale bar=10 μm. (F) Left: Images like in (E). Abnormally large caliber PN dendrites (inset) were observed in AtmR35X/R35X; Aptx−/− mice (P400; medial cerebellar lobule VI). Scale bar=25 μm main, 5 μm inset. Right: Average width of primary and secondary PN dendrites measured at the midline between the PN cell bodies and ML edge in Atm+/+; Aptx+/+ and AtmR35X/R35X; Aptx−/− mice (n=6). Statistical significances were assessed via two-way ANOVA with age and genotype as factors followed by Holm-Šídák (A and B right) or Šídák (B middle) pairwise multiple comparisons test. Welch’s t-test used in (D–F). PN, Purkinje neuron.


