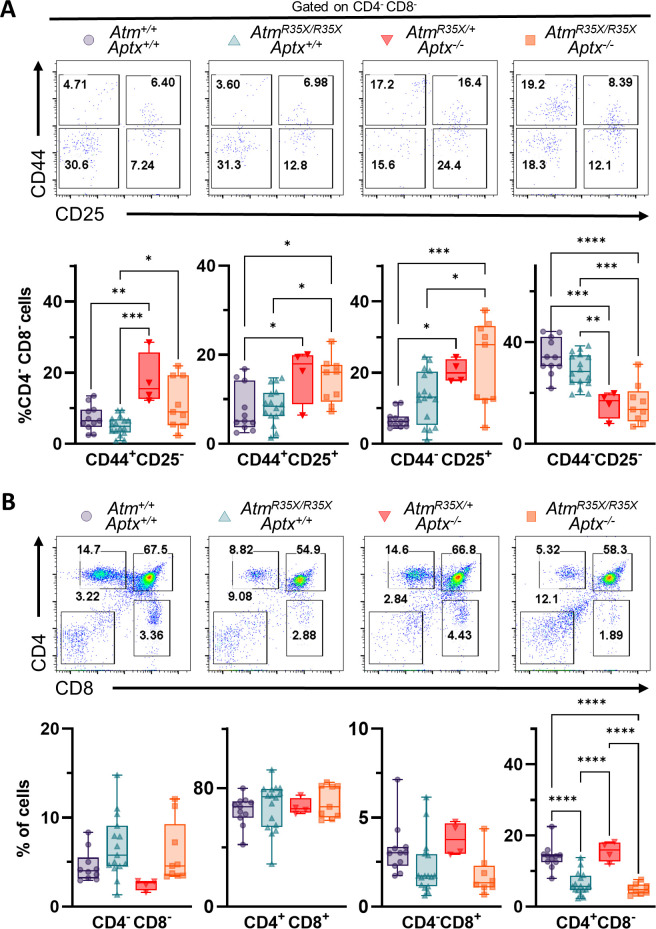
Figure 7. ATM and APTX deficiency confer deficits in T-cell expression, but at different developmental stages.
(A) Representative flow cytometric profiles of T-cell glycoprotein markers CD44 and CD25 gated on CD4−CD8− double negative (DN) cells. Summary plots show proportions of thymocytes at DN stages 1–4 (left to right). APTX deficient mice display increased proportions for DN1–3 and decreased proportion at DN4 consistent with a deficit in ontogeny from DN3 to DN4. (B) Representative flow cytometric profiles of T-cell glycoprotein markers CD4 and CD8 gated. ATM-deficient mice display decreased proportions for CD4 and CD8 single positive cells consistent with a deficit in ontogeny from CD4+CD8+ double positive to CD4+ and CD8+ single positive fates. Statistical significances were assessed via one-way ANOVA followed by Tukey’s pairwise multiple comparisons test. Number of animals denoted at bottom of bars. Symbol/color key: Atm+/+; Aptx+/+ (purple circle), AtmR35X/R35X; Aptx+/+ (green triangle), AtmR35X/+; Aptx−/− (red inverted triangle), AtmR35X/R35X; Aptx−/− (orange square).

