

Abstract
Objective:
To determine the effects of occlusion on maximum bite force of growing subjects.
Materials and Methods:
Incisor and first molar bite force of children and adolescents was evaluated. Four cohorts were measured annually for 3 years, starting at approximately 7, 9, 12, and 15 years of age, respectively. The initial sample included 182 females and 198 males; there were 130 subjects with normal occlusion, 111 with Class I malocclusion, and 139 with Class II malocclusion. Multilevel analyses were performed to model the growth changes and compare groups.
Results:
Maximum bite force increased significantly (P < .05) over time. Incisal forces peaked at 14.3 and 15.3 years of age for females and males, respectively. Maximum molar bite force peaked at 16 years for both males and females. Subjects with normal occlusion had significantly higher bite force than subjects with malocclusion. Maximum molar bite force exhibited a significant testing effect, with forces increasing 2.6 kg each year that the tests were repeated.
Conclusions:
Malocclusion has a detrimental effect on bite force. Changes in maximum bite force are also due to age, sex, and repeated testing.
Keywords: Maximum bite force, Age, Sex, Occlusion, Testing effects
INTRODUCTION
Maximum bite force provides a way of measuring the functional state of the masticatory muscles,1,2 the sizes of which are related to craniofacial morphology.3,4 Various factors affect maximum bite force, including the number of teeth present,1,5 tooth contacts and near contacts,5–8 areas of occlusal contact and near contact,6,7 posterior tooth support,9 orientation of the jaw-closing muscles,2 temporomandibular disorders,10,11 and craniofacial morphology.1,2,4,5,12,13
Males have a higher maximum bite force than do females.1,2,8,14–17 Sex differences have been related to body size,1–5,8,16 muscular development,12,18 craniofacial dimensions,1,2,5,12,14,19 occlusal contact areas,7 and chewing cycle kinematics.20 Sex differences become well established during the postpubertal years, when males develop greater overall body size and muscle strength than do females.6,8,14–16
While cross-sectional studies generally show increases in maximum bite force between childhood and adulthood,5,8,13–15 the patterns reported have not been consistent. Children in the primary dentition show no changes in maximum bite force.15,17 Braun14 showed steady bite force increases with age in females, but not in males. Kamegai and coworkers reported increases in molar bite force between 3 and 14 years, followed by decreases in females and increases in males.15 The inconsistency of patterns emphasizes the limitations of cross-sectional data for estimating age changes.
It has been well established that vertical malocclusions and crossbites decrease maximum bite force.2,21–25 The most consistent data pertain to hyperdivergent adults with open bites, who exhibit substantially lower maximum bite force than do hypodivergent adults.12,21,22 Lower bite force has also been reported among hyperdivergent children2,4,5,13,23 and for mixed dentition children having crossbites.23,24 Compared with individuals with normal occlusion, individuals 9 to 17 years of age with generalized malocclusion have been reported to have significantly lower bite force.15
It remains unclear whether Class I and II patients have normal bite force. Sonnesen and Bakke showed no class effects among 7-to-13-year-old children,26 but they did not make comparisons with subjects having normal occlusion. Differences might be expected because subjects with Class I or Class II malocclusion have smaller areas of occlusal contact and near contact than do subjects with normal occlusion,7 and areas of contact have previously been related to bite force1,6,8 and occlusal support.9
The primary aim of the present study was to determine whether occlusion affects maximum bite force of children and adolescents. This is the first study to evaluate bite force longitudinally, and the first to compare individuals with malocclusion and normal occlusion. Longitudinal data are necessary to better estimate changes in bite force over time.
MATERIALS AND METHODS
A total of 2954 middle-school Colombian mestizos were screened at three private schools in different areas of Medellín, Colombia. Subjects were rejected if they had congenitally missing teeth, signs or symptoms of temporomandibular dysfunction, craniofacial anomalies, history of previous orthodontic treatment, trauma, ankylosed teeth, or crossbites. Informed consent was obtained from all subjects and their parents; the study was approved by the Institutional Review Board of Universidad CES.
The sample was selected based on their willingness to participate and categorized based on the following criteria:
Sex: Males and females
-
Age: Subjects were screened and assigned to one of the following age cohorts:
Age cohort 7: 7.0–7.9 years of age (early mixed dentition) initially and evaluated for 2 consecutive years
Age cohort 9: 9.0–9.9 years of age (mid mixed dentition) initially and evaluated for 3 consecutive years
Age cohort 12: 12.0–12.9 years of age (late mixed dentition) initially and evaluated for 3 consecutive years
Age cohort 15: 15.0–15.9 years of age (permanent dentition) initially and evaluated for 3 consecutive years
-
Based on a clinical exam, occlusal status was classified as:
Normal occlusion: Class I molar relationships; crowding, ≤3 mm; overjet, ≤3 mm; overbite, ≤ one-third coverage of the mandibular incisors
Class I malocclusion: Class I molar relationships; crowding, >3 mm; overjet, >3 mm or overbite, > one-third coverage of the mandibular incisors
Class II malocclusion: At least one-half cusp Class II molar relationships
The final sample included 380 subjects (182 females and 198 males; 130 subjects with normal occlusion, 111 with Class I malocclusion, and 139 with Class II malocclusion). Sagittal jaw relationships were evaluated because they have been related to bite force15 and to dental intercuspation,7 which is indirectly related to bite force.1,20 The subjects in the present study showed no relationship between malocclusion, facial height, bizygomatic width, or bigonial width.27
Because of orthodontic treatment, restorative procedures, changing schools, absences on the day of data collection, or unwillingness to participate, the original sample size was decreased 14% and 22.5% at the end of the second and third measurement, respectively (Table 1). The data of the subjects who dropped out of the study were included for the timepoints that they were available.
Table 1.
Initial Sample Distribution According to Age, Sex, and Type of Occlusion, Along with Final Sample Sizes of Males and Females by Age Group

Maximum Bite Force
Bite forces were measured using an occlusal force transducer,28 which was covered in a thin plastic and recovered with sterile latex after each subject. The total vertical height of the transducer was 7.5 mm, which is within the physiological range of the masticatory muscles’ optimum functional vertical distance.1
Subjects sat in an upright position without head support. Standardized bite force measurements were taken between the central incisors and right first permanent molars by one previously trained orthodontist. Recorded voice commands were used to instruct the subjects to bite as hard as possible for 3 seconds. This procedure was repeated three times, with 1-minute rest periods between bites, and averaged.29 One day after data collection, 10% of the subjects (randomly selected) were remeasured. Reliabilities of the maximum bite force was 78% for the molars and 86% for the incisors.29 The transducer was calibrated after every 50 subjects.
Bite force readings were not taken for subjects who presented with restorations on the incisal surfaces of their anterior teeth, unerupted anterior teeth, or molars with extensive restorations involving the cusp tips.
Statistical Analysis
Multilevel linear models (MLWin, Institute of Education) were used to evaluate the data.30,31 The fixed part of each model estimated age changes in bite force and evaluated group differences. The effects of occlusion, sex, and repeated testing were evaluated. The repeated testing effects were evaluated using models that simultaneously evaluated age effects. Polynomials were used to model bite force changes over time, with the constant term fixed at 11 years of age. The linear terms described bite force velocity and the quadratic terms described acceleration or deceleration. The random part of each model partitioned variation into two levels, with subjects at the higher level and age, nested within subjects, at the lower level. Iterative generalized least squares were used to estimate the model parameters. Statistical significance was set at P < .05.
RESULTS
Maximum Bite Force
There were significant sex differences (Table 2). Incisor bite force was best described with a quadratic polynomial; forces increased over time at decelerating rates (Figure 1A). Incisor bite force was initially higher in females than in males, but the differences were not statistically significant. While there also were no significant differences in maximum incisor bite force at 11 years, males showed significantly greater yearly increases in bite force than did females, resulting in significantly greater forces at 17. Sex differences in deceleration were not statistically significant.
Table 2.
Polynomial Estimates of Maximum Incisor and Molar Bite Force for 7- to 17-Year-Olds Along With Sex Differences, With Constant Indicating Bite Force

Figure 1.
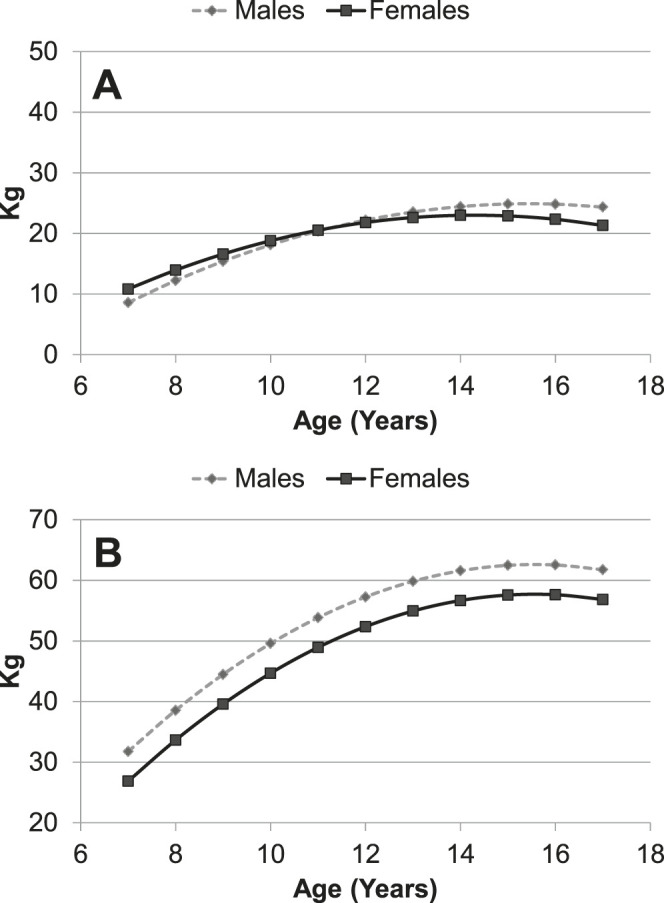
(A) Sex differences in maximum incisor bite force of subjects 7–17 years of age. (B) Sex differences in maximum molar bite force of subjects 7–17 years of age.
Molar bite force was significantly greater than incisor bite force at all ages, for both males and females. Molar bite force also followed a quadratic pattern. Males showed significantly greater maximum molar bite force than did females between 7 and 17 years of age (Figure 1B).
Females and males attained peak incisal bite force at approximately 14.3 and 15.3 years of age, (23.0 and 24.8 kg, respectively). Peak molar forces were attained at approximately 16 years of age for both males (62.6 kg) and females (57.7 kg).
Class Differences
Subjects with malocclusion had significantly lower maximum incisal bite force than did those with normal occlusion (Table 3). While the differences were insignificant among the younger children, subjects with malocclusion showed greater deceleration, resulting in significantly lower maximum incisor bite force at the older ages (Figure 2A). There were no statistically significant differences in incisal bite force between Class Is and Class IIs.
Table 3.
Differences in Maximum Incisor and Molar Bite Force Between Subjects With Normal Occlusion (N), Class I Malocclusion (CI I), and Class II Malocclusion (CI II), With Constant Indicating Bite Force

Figure 2.
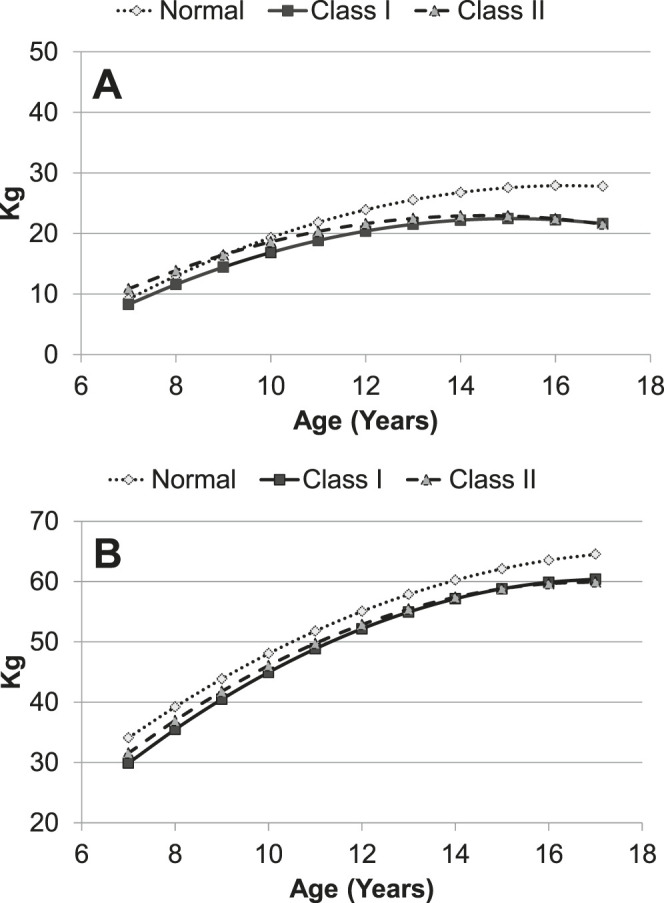
(A) Differences in maximum incisor bite force between subjects with normal occlusion, Class I malocclusion, and Class II malocclusion. (B) Differences in maximum molar bite force between subjects with normal occlusion, Class I malocclusion, and Class II malocclusion.
Subjects with normal occlusion also exhibited greater maximum molar bite force than subjects with malocclusion (Figure 2B). Individuals with normal occlusion had statistically significant higher molar bite force than Class Is at 11 years of age and thereafter. Although there was no difference at 11 years, subjects with normal occlusion had significantly higher bite force than Class IIs at the oldest ages. Differences between Class I and Class II malocclusions were not statistically significant.
Repeated Testing Effects
Multilevel analyses showed a statistically significant testing effect for maximum molar bite force (Table 4). Independent of age effects, molar bite force increased 2.6 kg per year over the 3-year observation period. Incisor bite force showed a small effect that was not statistically significant.
Table 4.
Estimates of Testing Effects (kg/yr) for Maximum Incisor and Molar Bite Force Over the 3-Year Follow-up Period

DISCUSSION
Maximum molar bite force increased approximately 30 kg between 7 and 17 years. Similar or slightly smaller increases have been reported for cross-sectional samples.5,6,8,13–15, 19 Molar bite force at age 15 was lower than,13,29,32 similar to,8 and higher than15 that reported by others. Differences could be due to transducer position, transducer height and rigidity, sampling, body size, and confidence when biting.1,29 Molar bite force increased more than did incisor bite force between 7 and 17 years of age—approximately twice as much. This supports the smaller increases in incisal bite force previously reported.13,29,32 Greater increases in molar bite force can be explained biomechanically, due to greater mechanical advantage.33 Importantly, the changes between 7 and 17 should be interpreted cautiously because the subjects were followed longitudinally for only 3 years. More studies with longer longitudinal follow-ups are needed to validate these results.
Molar bite force attained maximal values after peak adolescent height velocity, which occurs at approximately 11.5 and 13.6 years of age for females and males, respectively.34 Peak height velocities have been previously shown to occur before peak velocities of lean body mass.35,36 Male grip strength accelerates between age 13 and 14, after which it peaks.37 Peak upper and lower body strength of males occurs approximately 1 year after peak height velocity.38,39
Males had greater maximum molar bite force than did females. While similar differences have been reported for adults,5,6,8,15,19,32 pubertal females have been shown to have greater bite force than males,14 and no differences have been found among children.15,17,25,26 Differences observed prior to 16 years of age were probably due to differences in muscle size and strength favoring adolescent males over females.40,41
Incisor bite force increased at faster rates among males than among females. No difference has been previously reported in adults.14 The fact that females initially showed greater incisal bite force than males can be explained by maturational differences.35,36 Since females enter adolescence earlier than males,34 they might be expected to show increases in strength before males.
At the older ages, incisor bite force was approximately 25% greater and molar bite force was 7%–8% greater in individuals with normal occlusion than in those with malocclusion. It is possible that the height of the transducer reduced the maximum incisor bite force in subjects with increased overjet. Greater molar bite force has been reported for subjects older than 9 years with normal occlusion than with generalized malocclusion.15 Subjects with malocclusion have weaker bite force because they also have decreased areas of occlusal contact and near contact, 7 which decreases occlusal support.10 Malocclusion either impairs an individual’s ability to develop stronger masticatory muscles or it limits the ability of the muscle to develop greater strength. The malocclusion effects identified in the present study were probably not due to differences in vertical skeletal relationships because the three groups had similar anterior face heights.28
The testing effect (ie, due to repeated measurements) observed in the present study for molar bite force has not been previously established. The effect was more evident in the molar region, where bite force is substantially greater. Testing effects might be expected because subjects reduce their anxiety (psychological accommodation to the testing procedures) over time and learn how to more effectively produce bite force.
CONCLUSIONS
• Individuals with normal occlusion have a greater maximum bite force than do individuals with Class I or Class II malocclusion.
• Maximum bite force of children and adolescents increased progressively between 7 and 17 years of age.
• Males have a greater maximum bite force than do females.
• Molar bite force increases with repreated testing.
ACKNOWLEDGMENT
This research was partially supported by Instituto Colombiano para el Desarrollo de la Ciencia y la Tecnología, Colciencias, Grant 1228-04-16446, Universidad CES, Universidad EAFIT, Escuela de Nutrición y Dietética UdeA and Baylor College of Dentistry.
REFERENCES
- 1.Bakke M. Bite force and occlusion. Semin Orthod. 2006;12:120–126. [Google Scholar]
- 2.Garcia-Morales P, Buschang P, Throckmorton G. Maximum bite force, muscle efficiency and mechanical advantage in children with vertical growth patterns. Eur J Orthod. 2003;25:265–272. doi: 10.1093/ejo/25.3.265. [DOI] [PubMed] [Google Scholar]
- 3.Benington PC, Gardener JE, Hunt NP. Masseter muscle volume measured using ultrasonography and its relationship with facial morphology. Eur J Orthod. 1999;21:659–670. doi: 10.1093/ejo/21.6.659. [DOI] [PubMed] [Google Scholar]
- 4.Van Spronsen PH, Weijs WA, Valk J, Prahl-Andersen B, van Ginkel FC. Relationships between jaw muscle cross-sections and craniofacial morphology in normal adults, studies with magnetic resonance imaging. Eur J Orthod. 1991;13:351–361. doi: 10.1093/ejo/13.5.351. [DOI] [PubMed] [Google Scholar]
- 5.Ingervall B, Minder C. Correlation between maximum bite force and facial morphology in children. Angle Orthod. 1997;67:415–424. doi: 10.1043/0003-3219(1997)067<0415:CBMBFA>2.3.CO;2. [DOI] [PubMed] [Google Scholar]
- 6.Shinogaya T, Bakke M, Thomsen C, Vilmann A, Sodeyama A, Matsumoto M. Effects of ethnicity, gender and age on clenching force and load distribution. Clin Oral Invest. 2001;5:63–68. doi: 10.1007/s007840000099. [DOI] [PubMed] [Google Scholar]
- 7.Owens S, Buschang PH, Throckmorton G, Palmer L, English J. Masticatory performance and areas of occlusal contact and near contact in subjects with normal occlusion and malocclusion. Am J Orthod Dentofacial Orthop. 2002;121:602–609. doi: 10.1067/mod.2002.122829. [DOI] [PubMed] [Google Scholar]
- 8.Bakke M, Holm B, Jensen B, Michler L, Moller E. Unilateral isometric bite force in 8–68 year old women and men related to occlusal factors. Scand J Dent Res. 1990;98:149–158. doi: 10.1111/j.1600-0722.1990.tb00954.x. [DOI] [PubMed] [Google Scholar]
- 10.Gibbs C, Anusavice K, Young H, Jones J, Esquivel-Upshaw J. Maximum clenching force of patients with moderate loss of posterior tooth support: a pilot study. J Prosthet Dent. 2002;88:498–502. doi: 10.1067/mpr.2002.129062. [DOI] [PubMed] [Google Scholar]
- 11.Hagberg C. Electromyography and bite force studies of muscular function and dysfunction in masticatory muscles. Swed Dent J Suppl. 1986;37:1–64. [PubMed] [Google Scholar]
- 12.Holmgren K, Sheikholeslam A, Riise C, Kopp S. The effects of an occlusal splint on the electromyographic activities of the temporal and masseter muscles during maximal clenching in patients with a habit of nocturnal bruxism and signs and symptoms of craniomandibular disorders. J Oral Rehab. 1990;17:447–459. doi: 10.1111/j.1365-2842.1990.tb01416.x. [DOI] [PubMed] [Google Scholar]
- 12.Ringqvist M. Isometric bite force and its relation to dimensions of facial skeleton. Acta Odont Scand. 1973;31:35–42. doi: 10.3109/00016357309004611. [DOI] [PubMed] [Google Scholar]
- 13.Kiliaridis S, Kjellberg H, Wenneberg B, Engström C. The relationship between maximal bite force, bite force endurance, and facial morphology during growth. Acta Odont Scand. 1993;51:223–231. doi: 10.3109/00016359309040583. [DOI] [PubMed] [Google Scholar]
- 14.Braun S, Hnat W, Freudenthaler J, Marcotte M, Hönigle K, Johnson B. A study of maximum bite force during growth and development. Angle Orthod. 1996;66:261–264. doi: 10.1043/0003-3219(1996)066<0261:ASOMBF>2.3.CO;2. [DOI] [PubMed] [Google Scholar]
- 15.Kamegai T, Tatsuki T, Nagano H, et al. A determination of bite force in northern Japanese children. Eur J Orthod. 2005;27:53–57. doi: 10.1093/ejo/cjh090. [DOI] [PubMed] [Google Scholar]
- 16.Varga S, Spalj S, Varga Ml, Milosevic SA, Mestrovic S, Slaj M. Maximum voluntary molar bite force in subjects with normal occlusion. Eur J Orthod. 2011;33:427–433. doi: 10.1093/ejo/cjq097. [DOI] [PubMed] [Google Scholar]
- 17.Rentes A, Gaviao, M, Amaral J. Bite force determination in children with primary dentition. J Oral Rehab. 2002;29:174–180. doi: 10.1046/j.1365-2842.2002.00957.x. [DOI] [PubMed] [Google Scholar]
- 18.Bakke M, Tuxen A, Vilmann P, Jensen B, Vilmann, B, Toft M. Ultrasound image of human masseter muscle related to bite force, electromyography, facial morphology and occlusal factors. Scand J Dent Res. 1992;100:164–171. doi: 10.1111/j.1600-0722.1992.tb01734.x. [DOI] [PubMed] [Google Scholar]
- 19.Usui T, Uematsu S, Kanegae H, Morimoto T, Kurihara S. Change in maximum occlusal force in association with maxillofacial growth. Orthod Craniofac Res. 2007;10:226–234. doi: 10.1111/j.1601-6343.2007.00405.x. [DOI] [PubMed] [Google Scholar]
- 20.Lepley C, Throckmorton G, Ceen R, Buschang PH. Relative contributions of occlusion, maximum bite force, and chewing cycle kinematics to masticatory performance. Am J Orthod Dentofacial Orthop. 2011;139:606–613. doi: 10.1016/j.ajodo.2009.07.025. [DOI] [PubMed] [Google Scholar]
- 21.Proffit WR, Fields HW, Nixon WL. Occlusal forces in normal and long faced adults. J Dent Res. 1983;62:566–571. doi: 10.1177/00220345830620051201. [DOI] [PubMed] [Google Scholar]
- 22.Throckmorton G, Ellis E, III, Buschang PH. Morphologic and biomechanical correlates with maximum bite forces in orthognathic surgery patients. J Oral Maxillofac Surg. 2000;58:512–524. doi: 10.1016/s0278-2391(00)90014-4. [DOI] [PubMed] [Google Scholar]
- 23.Raadsheer M, Van Eidjen T, Van Girkel F, Phral-Andersen B. Contribution of jaw muscle size and craniofacial morphology to human bite force magnitude. J Dent Res. 1999;78:31–42. doi: 10.1177/00220345990780010301. [DOI] [PubMed] [Google Scholar]
- 24.Castelo P, Duarte M, Pereira L, Bonjardim L. Masticatory muscle thickness, bite force, and occlusal contacts in young children with unilateral posterior crossbite. Eur J Orthod. 2007;29:149–156. doi: 10.1093/ejo/cjl089. [DOI] [PubMed] [Google Scholar]
- 25.Sonnesen L, Bakke M, Solow B. Bite force in pre-orthodontic children with unilateral crossbite. Eur J Orthod. 2001;23:741–749. doi: 10.1093/ejo/23.6.741. [DOI] [PubMed] [Google Scholar]
- 26.Sonnesen L, Bakke M. Molar bite force in relation to occlusion, craniofacial dimensions, and head posture in pre-orthodontic children. Eur J Orthod. 2005;27:58–63. doi: 10.1093/ejo/cjh069. [DOI] [PubMed] [Google Scholar]
- 27.Arboleda C, Buschang PH, Camacho J, Botero P, Roldán S. Mixed longitudinal anthropometric study of craniofacial growth of Colombian mestizos 6–17 years of age. Eur J Orthod. 2011;33:441–449. doi: 10.1093/ejo/cjq099. [DOI] [PubMed] [Google Scholar]
- 28.Isaza J, Throckmorton G, Roldán S. Design and construction of a transducer for bite force registration. J Biomech. 2009;42:1146–1149. doi: 10.1016/j.jbiomech.2009.02.015. [DOI] [PubMed] [Google Scholar]
- 29.Roldán S, Isaza J, Trockmorton G, Buschang PH. Reliability of maximum bite force measurements in age-varying populations. J Oral Rehab. 2009;36:801–807. doi: 10.1111/j.1365-2842.2009.01997.x. [DOI] [PubMed] [Google Scholar]
- 30.Goldstein H. Multilevel Models in Educational and Social Research. New York: Oxford University Press; 1987. 1st ed. [Google Scholar]
- 31.Strenio J, Weisberg H, Bryk A. Empirical Bayes estimation of individual growth curve parameters and their relationship to covariates. Biometrics. 1983;39:71–86. [PubMed] [Google Scholar]
- 32.Helle A, Tulensalo T, Ranta R. Maximum bite force values of children in different age groups. Proc Finn Dent Soc. 1983;79:151–154. [PubMed] [Google Scholar]
- 33.Throckmorton G, Dean J. The relationship between jaw-muscle mechanical advantage and activity levels during isometric bites in humans. Arch Oral Biol. 1994;39:429–437. doi: 10.1016/0003-9969(94)90174-0. [DOI] [PubMed] [Google Scholar]
- 34.Malina RM, Bouchard C, Bar-Or O. Growth Maturatrion and Physical Activity. 2nd ed. Champaign, IL: Human Kinematics; 2004. [Google Scholar]
- 35.Jackowski S, Faulkner R, Farthing J, Kontulainen S, Beck T, Baxter-Jones A. Peak lean tissue mass accrual precedes changes in bone strength indices at the proximal femur during the pubertal growth spurt. Bone. 2009;44:1186–1190. doi: 10.1016/j.bone.2009.02.008. [DOI] [PubMed] [Google Scholar]
- 36.Rauch F, Bailey D, Baxter-Jones A, Mirwald R, Faulkner R. The “muscle-bone unit” during the pubertal growth spurt. Bone. 2004;34:771–775. doi: 10.1016/j.bone.2004.01.022. [DOI] [PubMed] [Google Scholar]
- 37.Roche A, Malina R. In Physical performance (Volume 2) New York: Plenus Press; 1983. Manual of physical status and performance in childhood. [Google Scholar]
- 38.Carron AV, Bailey DA. Strength development in boys from 10 through 16 years. Monogr Soc Res Child Dev. 1974;39:1–37. [PubMed] [Google Scholar]
- 39.Stolz HR, Stolz LM. New York: Macmillan; 1951. Somatic Development of Adolescent Boys: A Study of the Growth of Boys During the Second Decade of Life. [Google Scholar]
- 40.Johnston F, Malina R. Age changes in composition of the upper arm in Philadelphia children. Hum Biol. 1966;38:1–21. [PubMed] [Google Scholar]
- 41.Round J, Jones D, Honour J, Nevill A. Hormonal factors in the development of differences in strength between boys and girls during adolescence: a longitudinal study. Ann Hum Biol. 1999;26:49–56. doi: 10.1080/030144699282976. [DOI] [PubMed] [Google Scholar]