

Abstract
Effective conservation and management necessitate an understanding of the ecological mechanisms that shape species life histories in order to predict how variability in natural and anthropogenic impacts will alter growth rates, recruitment, and survival. Among these mechanisms, the interaction between parturition timing and prey availability frequently influences offspring success, particularly when postnatal care is absent. Here, we assess how parturition timing and nursery conditions, including prey abundance and environmental conditions, influence the growth and potential survival of blacktip sharks (Carcharhinus limbatus) in western Gulf of Mexico (GOM) estuaries over their first year. Catch data from long‐term gillnet monitoring allowed for clear delineation of cohorts based on size frequency distribution plots, and showed that late parturition cohorts born in estuaries with fewer prey resources exhibited more rapid growth than early parturition cohorts that experienced more abundant prey. Compensatory behaviors that promoted accelerated growth led to reduced second year residency, likely due to reduced survival resultant from greater risk taking and potentially due to reduced site fidelity attributed to larger body size. Water temperatures influenced blacktip growth rates through physiological increases in metabolism and potential premigratory foraging cues associated with cooling temperatures. Gradual warming of the GOM (0.03°C year−1) was also correlated with earlier parturition across the study period (1982–2017), similar to other migratory species. Considering current trends in climate and associated phenological shifts in many animals, testing hypotheses assessing compensatory growth‐risk trade‐offs is important moving forward to predict changes in life histories and associated recruitment in concert with current and future conservation actions, like wildlife management.
Keywords: allometric growth, match/mismatch, natal site fidelity, parturition, shark nursery
Late parturition, reduced prey abundance, and suboptimal temperatures led to compensatory growth of juvenile blacktips during their first year prior to winter emigration. Behaviors contributing to compensatory growth likely led to observed declines in first year survival. Warming Gulf of Mexico waters from 1982 to 2017 were correlated with earlier parturition, slower growth, and higher survival of age 0 blacktips.

1. INTRODUCTION
Among the distinguishing characteristics of the 20th century, changes in wildlife management triggered by the extirpation and near extirpation of hundreds of wildlife populations have led to vast improvements in conservation practices (Evans, 2012; Hutton et al., 2005; Kennelly & Broadhurst, 2002). Yet, many populations and species are still imperiled by human actions, including sharks and their relatives, which are increasingly listed by CITES and the IUCN because of continued overharvesting, habitat deterioration, and fisheries bycatch (Dulvy et al., 2014). Low fecundity and late age of maturity limit population resilience and contribute to the challenges of managing many shark species (Dulvy et al., 2014). Concomitantly, sharks lack postparturition care and must contend with ecological risks while developing foraging skills without parental guidance or protection (reviewed in Hussey et al., 2010). Consequently, the conservation of juvenile shark populations is often a priority to ensure recruitment meets management targets (Kinney & Simpfendorfer, 2009). However, neonatal sharks innately avoid predators and seek out prey (Lyons et al., 2020) aided by their sociality (Guttridge, 2020), sensory biology and morphology (Gardiner et al., 2012), and nursery habitats, the latter of which have received significant attention because of their role in promoting juvenile shark survival (Heithaus, 2007).
Many shark nurseries occur in nearshore ecosystems that limit adult occurrence due to shallow depths and environmental conditions, thereby reducing predation risk (McCandless et al., 2007). While some bold individuals risk predation to access more metabolically rewarding habitats (e.g., Dhellemmes et al., 2020; Dibattista et al., 2007; Matich & Heithaus, 2015), most newborn sharks that use nurseries remain in these habitats for at least their first months of life, increasing the survival rate of young‐of‐the‐year (YOY, age 0) sharks (Heupel et al., 2007). The benefits derived from shark nurseries can be attributed to regional and natal philopatry exhibited by females of some species during optimal seasons for newborn growth and survival (Chapman et al., 2015; Hueter et al., 2005). Predictable parturition in low‐risk habitats during periods of high productivity expectantly increase individual fitness and in turn population resilience of some sharks. Thus, despite a lack of parental care after birth, the location and timing of parturition are investments made by pregnant sharks, with consequences for miscues considering the growth and survival of juveniles closely align with extrinsic factors like food availability and environmental conditions (Kerby et al., 2012; Rosa et al., 2014; Siddon et al., 2013; Wilson et al., 2021).
Intraspecific variability in behavior is common among sharks, and the timing and location of parturition expectantly varies among pregnant females that may lead to variability in litter and cohort success (e.g., Hoffmayer et al., 2013; Sen et al., 2018; Sulikowski et al., 2016). Delayed birth may lead to inadequate time for sharks to develop foraging skills and invest in somatic growth. Smaller sharks are more vulnerable to predators like larger sharks (Grubbs, 2010; Heithaus, 2004), which coupled with less time to develop antipredator behavior in seasonally constrained ecosystems, could lead to reduced offspring survival when parturition is mistimed (Visser & Gienapp, 2019). However, the costs of delayed parturition can be alleviated by several factors. Greater parental investment in offspring size or energy reserves can offset costs by reducing predation risk or food stress (reviewed in Kindsvater & Otto, 2014; Lyons et al., 2020; Pettersen et al., 2015). Similarly, compensatory growth can allow juvenile sharks to “catch‐up” to conspecifics born earlier, but inherent trade‐offs may affect survival (Hector & Nakagawa, 2012; Hornick et al., 2000). Increased growth rates require behavioral and/or physiological shifts, with an increase in food consumption and/or greater caloric allocation to structural size (Dmitriew, 2011). Animals that exhibit compensatory growth must:
increase time allocated to feeding, thereby reducing predator vigilance and/or time in refuge,
increase foraging rates that can reduce muscle quality and subsequent locomotor performance,
forage in more productive, but often riskier habitats, and/or
increase caloric contribution to structural growth, consequently reducing contributions to energetic reserves and increasing risk of environmental and food stress (Dmitriew, 2011).
Increased foraging has been hypothesized as a means by which species compensate for late parturition in other aquatic (e.g., Moginie & Shima, 2018), semiaquatic (e.g., Orizaola et al., 2010), and terrestrial species (e.g., Michel et al., 2018), but not without costs. For example, juvenile lemon shark (Negaprion brevirostris) growth rate in Bimini, The Bahamas was negatively correlated with survival, likely due to more frequent use of resource rich but risky foraging sites (Dhellemmes et al., 2020; Dibattista et al., 2007).
Although widely hypothesized, limited research has been conducted on compensatory growth in sharks due to the inherent challenges of studying wide ranging, highly mobile marine species that are often found in low abundances. In response to fishing pressure, juvenile Atlantic sharpnose sharks (Rhizoprionodon terraenovae) exhibited density‐dependent compensatory growth in the Gulf of Mexico (GOM), which led to earlier sexual maturation (Carlson & Baremore, 2003). Sandbar sharks (Carcharhinus plumbeus) exhibited a similar compensatory response to fishing pressure in the northwestern (NW) Atlantic (Romine et al., 2013; Sminkey & Musick, 1995), and NW Atlantic porbeagles (Lamna nasus) exhibited faster growth rates in response to fisheries harvesting (Cassoff et al., 2007). However, the compensatory response of porbeagles varied across age‐classes, with subadults growing faster and juveniles growing slower under exploitation (Cassoff et al., 2007). Comparatively, velvet belly latternsharks (Etmopterus spinax) in the northeastern Atlantic and Mediterranean (Coelho et al., 2010) and spiny dogfish (Squalus acanthias) in the NW Atlantic (Sosebee, 2005) exhibited smaller sizes at maturity in response to exploitation, but growth rates were unaffected by fishing pressure suggesting earlier age of maturation.
In light of these limited studies, it is unclear what triggers compensatory growth in sharks, and how this affects juvenile shark survival. Physiological mechanisms that increase growth rates should reduce predation risk based on body size (Heithaus, 2004), but could alter immune function, predator avoidance, and resistance to environmental stress, thereby reducing long‐term survival (Álvarez, 2011; Hector & Nakagawa, 2012). As such, understanding the factors that lead to compensatory growth in juvenile sharks and its resultant effects on survival are essential for predicting when cohorts and populations are at heightened risk.
Blacktip sharks (Carcharhinus limbatus) are among the most abundant shark species in the GOM, with a recent estimate of ca. 39 million individuals in 2016 (NMFS, 2018). GOM blacktips are born in spring–early summer at <50 cm total length (TL) in litter sizes of ca. 5 (Baremore & Passerotti, 2012) and are predicted to grow ca. 15 cm TL annually during their first few years before reaching sexual maturity at ca. 135 cm TL for females (Baremore & Passerotti, 2012; Deacy & Moncrief‐Cox, 2019). Like many other coastal sharks in the GOM, YOY blacktips use coastal estuaries as nurseries from Texas to Florida (McCandless, Kohler, et al., 2007). However, cooling water temperatures require blacktips to leave their nurseries during winter months, with at least some individuals exhibiting natal site fidelity (e.g., Hueter et al., 2005). Spatiotemporal and interindividual variability in reproductive biology, life history, and nursery conditions lead to variability in blacktip growth, behavior, and survival across nurseries and cohorts (Baremore & Passerotti, 2012; Carlson et al., 2006; Deacy & Moncrief‐Cox, 2019; Matich et al., 2021; McCandless, Kohler, et al., 2007). As such, blacktips provide an opportunity to assess the factors that lead to compensatory growth in juvenile sharks and how this affects survival.
We used standardized long‐term sampling from 1982 to 2017 across five Texas estuaries to test the following hypotheses:
Later date of birth, reduced food availability, and suboptimal environmental conditions trigger compensatory growth among YOY blacktips.
Conditions that lead to compensatory growth result in reduced survival of YOY blacktips during their first winter.
2. METHODS
2.1. Study area
The northwestern GOM includes more than 5000 km of Texas shoreline that expands across a series of estuaries, which serve as nurseries for juvenile sharks (Froeschke et al., 2010; Hueter & Tyminski, 2007; Swift & Portnoy, 2021; TinHan et al., 2020; Figure 1). The barrier islands that separate these estuaries from the GOM limit tidal inflow. As a result, most estuaries are brackish and experience spatiotemporal variability in freshwater inflow from connected river systems (Froeschke, Stunz, & Wildhaber, 2010; Longley, 1994; US EPA, 1999). Freshwater inflow from northeastern rivers is significantly greater than from southwestern rivers, resulting in hyposaline estuaries along the northeastern coastline (e.g., Sabine Lake) and hypersaline estuaries along the southwestern coastline (e.g., Laguna Madre; Longley, 1994; US EPA, 1999). Consequently, blacktips are very rarely found in Sabine Lake and exhibit variable abundances in Galveston Bay due to its dynamic low‐brackish salinity regimes (Plumlee et al., 2018). Previous research has also found differences in the population structure of other estuarine‐dependent juvenile carcharhindids (C. leucas) sampled in Sabine Lake and Galveston Bay when delineated from more southern Texas estuaries (TinHan et al., 2020). Therefore, neither Sabine Lake nor Galveston Bay were considered for the study to ensure that regional variability in population drivers did not confound the interpretation of results. Data from remaining estuaries (Figure 1) were pooled to assess regional patterns in juvenile blacktip compensatory growth in light of small sample sizes in some estuaries in some years.
FIGURE 1.
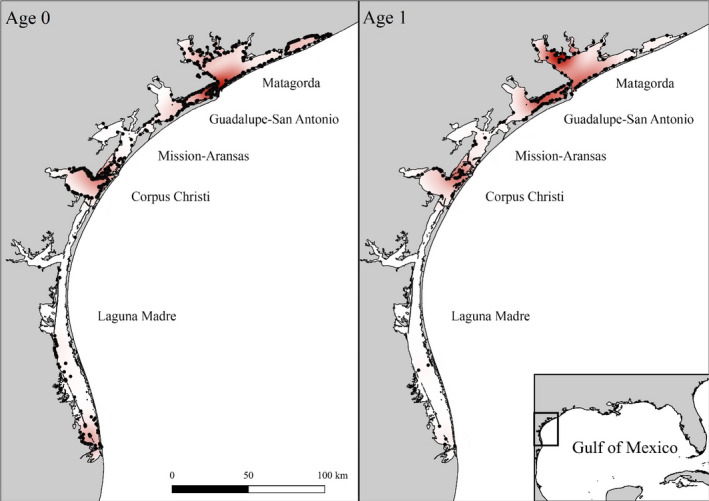
Central‐lower Texas coast along the western Gulf of Mexico. Black dots indicate capture locations of YOY (left panel) and age 1 (right panel) blacktips, with darker red coloration indicative of higher shark densities
2.2. Data collection
Species‐relative abundance and corresponding environmental data were obtained from standardized bag seine, otter trawl, and gillnet surveys conducted by the Texas Parks and Wildlife Department (TPWD) long‐term fishery‐independent monitoring program from 1982 to 2017. Within each estuary, 20 bag seines and 20 bay trawls were pulled monthly between dawn and dusk each year using a stratified cluster design within a 3.4225 km2 (1 nautical mile2) grid system. Bag seines (18.3 m long, 1.8 m deep with 1.3 cm stretched nylon monofilament mesh) were pulled parallel to the shoreline across an area of 0.03 hectares. Otter trawls (6.1 m wide with 38 mm stretched nylon multifilament) were pulled at 4.82 km/h for 10 min away from the shoreline in open water ≥1 m in depth.
Ninety gillnets per year were also set in each estuary using a stratified cluster design within the same 3.4225 km2 grid system in 10‐week spring (April–June; n = 45) and fall (September–November; n = 45) seasons. Monofilament gillnets (183 m long; 1.2 m deep with ascending 45.7 m sections of 7.6, 10.2, 12.7, and 15.2 cm stretched mesh) were set perpendicular to the shoreline at dusk and retrieved after dawn (mean soak time ± SD = 13.7 ± 1.4 h).
All organisms caught in seines, trawls, and gillnets were identified, counted, and measured (total length ‐ TL). Blacktips were only caught in gillnets during the study. Date, location, and water temperature (°C) were recorded for each sample. It is important to note that Laguna Madre was divided into two separate regions (upper and lower) and sampled as independent systems during monitoring.
Blacktips sampled with gillnets in San Antonio Bay in 2018 were also weighed to assess ontogenetic shifts in somatic growth (n = 40). Simple linear regression was used with power functions of mass:length for YOY and age 1 sharks separately to identify ontogenetic differences in isometric growth (expected mass:length) versus allometric growth (greater than or less than expected mass:length).
2.3. Cohort assessment
The most recently published von Bertalanffy growth functions (VBGFs) for GOM blacktips (Deacy & Moncrief‐Cox, 2019) were initially used to assign age estimates of sharks based on shark TL, sampling date, and predicted parturition season (i.e., spring; Baremore & Passerotti, 2012). In order to assess the efficacy of assigned ages, size‐based frequency distribution histograms with 3‐cm TL bins were plotted for each season (Figure 2). Clear discrepancies with estimates based on VBGFs were found for the average transitions from age 0 to 1 and from age 1 to 2 based on histogram valleys, which may be attributed to geographic variability in juvenile blacktip growth rates and size at birth across the region (e.g., Carlson et al., 2006). As such, estimated age‐classes were reassigned. Sharks <70.6 cm TL in spring and <91.6 cm TL in fall were reassigned as YOY. Blacktips 70.6–94.5 cm TL in spring and 91.6–109.5 cm TL in fall were reassigned as age 1.
FIGURE 2.

Size‐based frequency distribution of blacktips sampled in Spring (April–June) and Fall (September–November) across the study period (1982–2017). Dashed lines indicate estimated transition sizes from age 0 to age 1 (0–1) and age 1 to age 2 (1–2) based on published VBGFs for GOM blacktips (Deacy & Moncrief‐Cox, 2019). Solid lines indicate reassigned transition sizes from age 0 to age 1 and age 1 to age 2 based on the location of histogram valleys, which were used for analyses
Monthly variability in YOY and age 1 blacktip abundances (sharks/gillnet) were then assessed with Kruskall‐Wallis tests to identify parturition periods (timing of first YOY blacktip occurrence), as well as the timing of emigration from and immigration to Texas estuaries in response to seasonal temperature shifts based on non‐normal data distributions (Froeschke, Stunz, & Wildhaber, 2010; Hueter et al., 2005). A similar assessment using Kruskall‐Wallis tests was used to identify monthly variability in the abundance of primary prey items for YOY blacktips (Gulf menhaden [Brevoortia patronus] based on bag seine data, and Atlantic croaker [Micropogonias undulatus] based on otter trawl data) to assess if parturition and immigration matched prey availability. Gulf menhaden and Atlantic croaker were chosen due to their predominance in the diets of YOY blacktips in the GOM (reviewed in Matich et al., 2021). Data were pooled across estuaries and years for monthly assessments, and post hoc Dunn's tests were used to identify significant differences between months.
In order to identify cohorts that exhibited compensatory growth, simple linear regression was used to estimate annual variability in growth rates from age 0 to 1 (first year growth) using the slope of best fit lines. Capture date (day of year [DOY]) was the independent variable, and blacktip TL was the dependent variable. Sharks were assigned to cohorts based on age estimates and capture dates (Matich et al., 2020). YOY blacktips were sampled in spring every year of the study with the exception of 1996, which was removed from analyses to avoid spurious results attributed to this cohort.
Simple linear regression was also used to assess the impacts of YOY abundance and compensatory growth on second year residency (i.e., site fidelity to Texas estuaries during age 0–1 transition). Annual deviations from mean estimated growth rate was the independent variable, and the ratio of age 1:age 0 sharks in the same cohort was the dependent variable to account for potential bias attributed to annual variability in cohort size.
2.4. Generalized additive models
To investigate the influence of the environment on interannual differences in first year growth rate, we used generalized additive models (GAMs), which are semiparametric analogs of generalized linear models that allow for nonlinear relationships between predictor and response variables (Wood, 2006). Models were run using a gaussian distribution and a logarithm link, and also run unconstrained using the default value for k in the mgcv package in R (Wood, 2017). The general GAM construction was
where E[y] is equal to the expected value of the response variable (catch), g is the link function, β0 is the intercept, X represents one of k predictor variables, and Sk is the smoothing function of the predictor variable Xk (Wood, 2006).
To assess environmental and ecological factors that may affect first year growth, fifteen predictor variables were identified as candidate covariates for the model, including water temperature, salinity regime, prey availability, competition, adult fecundity, and parturition timing. Water temperature measurements collected from TPWD bag seine surveys were used to define five potential covariates: mean total temperature, mean seasonal temperature (spring, summer, and fall), and the number of days with a measured temperature of >34.6°C (95th percentile) per annum across the study area, which may affect growth through physiological changes in metabolic demands (Huey & Stevenson, 1979). Mean annual winter (December 1–March 31) sea surface temperature (SST) measurements were also collected from waters over the continental shelf in the northwestern GOM (N 27.125°, W 93.875°) using NOAA’s Advanced Very High Resolution Radiometer Pathfinder version 5.3 L3‐Collated SST (measurement accuracy of 0.05°/5 km; https://coastwatch.pfeg.noaa.gov/), which could affect first year over‐wintering success (e.g., Brodersen et al., 2011; Djurichkovic et al., 2019).
Factors affecting estuarine salinity regimes, including freshwater inflow and El Niño and La Niña weather patterns, were also included as potential covariates (Froeschke, Stunz, & Wildhaber, 2010). Archival data of annual river discharge measurements were collected from 13 available USGS monitoring stations at the headwaters of Texas estuaries that collected data for the duration of the study period (1982–2017) ranging north to south from N 29.309°, W 96.104° to 27.711°, W 97.502° (https://dashboard.waterdata.usgs.gov/). The presence/absence of El Niño and La Niña were based on NOAA’s Oceanic Niño Index that assesses anomalies in SST based on a 30‐year average (https://origin.cpc.ncep.noaa.gov/products/analysis_monitoring/ensostuff/ONI_v5.php).
To identify potential covariates pertaining to prey availability, mean annual catch per unit effort (CPUE) of Gulf menhaden from bag seine surveys and mean annual CPUE of Atlantic croaker from otter trawl surveys were used as estimates of relative abundance of prey. Potential competition covariates included annual blacktip and bull shark (Carcharhinus leucas) CPUE from gillnet surveys (Cottrant et al., 2021; Matich et al., 2021). Adult fecundity was assessed as a potential covariate based on published annual spawning stock size from the most recent GOM blacktip stock assessment (NMFS, 2018). Annual parturition timing was estimated from the first occurrence of a YOY blacktip sampled in gillnets.
Manual stepwise backwards variable selection minimizing Akaike information criterion (AIC) was used to optimize variable contribution to the model where only significant (p < .05) variables were retained within the model. If correlations among variables were identified (r > .2), correlated variables were tested individually using separate models (with correlations typically occurring within like‐variables; e.g., temperature, freshwater inflow, and shark biomass), and the variable that was attributed to a better model fit (lowest AIC and highest Deviance Explained [DE]) was used in the final model. This procedure resulted in multiple models given the combination of correlated covariates, with the final, most parsimonious model (significant variables and lowest AIC) selected from all of the unique combination of covariates. Upon final model selection for growth rate, independent variables retained in the growth rate GAM were also employed to assess predictability of second year residency across sampling years using a second GAM.
3. RESULTS
From 1982 to 2017, more than 2700 YOY (annual mean ± SE; 51.9 ± 8.8) and age 1 (9.8 ± 1.7) blacktips were caught, with cohorts ranging from 20 to 241 sampled individuals (Table 1). As expected, YOY sharks were caught in spring (April–June) across all years, except for 1996 (removed from analyses), and in fall (September–November) across all years.
TABLE 1.
Cohort variability in the relative abundance of age 0 and age 1 blacktips, slope (cm TL/day) and test statistics for best fit lines, and estimated first year growth is based on the slope of best fit lines (in cm TL)
| Cohort | n (age 0) | n (age 1) | DOY 1st age 0 | Slope | r 2 | F | p | Estimated 1st year growth |
|---|---|---|---|---|---|---|---|---|
| 1982 | 25 | 2 | 127 | 0.101 | .69 | 50.2 | <.001 | 36.8 |
| 1983 | 26 | 2 | 145 | 0.110 | .78 | 86.9 | <.001 | 40.0 |
| 1984 | 14 | 8 | 130 | 0.065 | .66 | 23.6 | <.001 | 23.7 |
| 1985 | 29 | 38 | 127 | 0.115 | .76 | 87.5 | <.001 | 42.0 |
| 1986 | 236 | 5 | 149 | 0.097 | .35 | 125.1 | <.001 | 35.2 |
| 1987 | 39 | 21 | 133 | 0.069 | .71 | 88.6 | <.001 | 25.0 |
| 1988 | 127 | 23 | 123 | 0.086 | .69 | 284.1 | <.001 | 31.5 |
| 1989 | 96 | 11 | 109 | 0.092 | .66 | 184.3 | <.001 | 33.5 |
| 1990 | 54 | 2 | 143 | 0.113 | .58 | 72.7 | <.001 | 41.3 |
| 1991 | 101 | 1 | 141 | 0.142 | .82 | 447.8 | <.001 | 51.7 |
| 1992 | 18 | 2 | 133 | 0.077 | .70 | 37.6 | <.001 | 28.3 |
| 1993 | 43 | 11 | 139 | 0.085 | .76 | 126.9 | <.001 | 31.1 |
| 1994 | 56 | 9 | 151 | 0.094 | .67 | 108.5 | <.001 | 34.4 |
| 1995 | 31 | 11 | 129 | 0.072 | .62 | 47.4 | <.001 | 26.1 |
| 1997 | 28 | 3 | 161 | 0.170 | .92 | 316.2 | <.001 | 62.2 |
| 1998 | 25 | 12 | 148 | 0.121 | .61 | 35.8 | <.001 | 44.0 |
| 1999 | 72 | 21 | 117 | 0.061 | .61 | 109.9 | <.001 | 22.1 |
| 2000 | 49 | 10 | 122 | 0.089 | .74 | 134.3 | <.001 | 32.6 |
| 2001 | 104 | 5 | 128 | 0.042 | .24 | 31.9 | <.001 | 15.4 |
| 2002 | 39 | 14 | 141 | 0.085 | .66 | 71.2 | <.001 | 31.1 |
| 2003 | 129 | 15 | 140 | 0.085 | .71 | 304.2 | <.001 | 30.9 |
| 2004 | 37 | 23 | 131 | 0.102 | .64 | 63.1 | <.001 | 37.2 |
| 2005 | 58 | 19 | 130 | 0.078 | .70 | 130.7 | <.001 | 28.6 |
| 2006 | 43 | 6 | 144 | 0.080 | .42 | 29.1 | <.001 | 29.3 |
| 2007 | 29 | 11 | 128 | 0.062 | .70 | 63.1 | <.001 | 22.6 |
| 2008 | 53 | 8 | 119 | 0.083 | .80 | 203.3 | <.001 | 30.3 |
| 2009 | 30 | 9 | 132 | 0.091 | .74 | 79.7 | <.001 | 33.4 |
| 2010 | 17 | 9 | 138 | 0.062 | .62 | 24.9 | <.001 | 22.6 |
| 2011 | 60 | 28 | 130 | 0.077 | .85 | 321.7 | <.001 | 28.2 |
| 2012 | 96 | 31 | 143 | 0.053 | .73 | 250.6 | <.001 | 19.2 |
| 2013 | 192 | 18 | 128 | 0.084 | .73 | 519.9 | <.001 | 30.7 |
| 2014 | 67 | 5 | 149 | 0.064 | .44 | 51.5 | <.001 | 23.3 |
| 2015 | 44 | 34 | 104 | 0.048 | .39 | 27.3 | <.001 | 17.4 |
| 2016 | 87 | 3 | 131 | 0.114 | .79 | 321.8 | <.001 | 41.5 |
| 2017 | 168 | NA | 109 | 0.064 | .79 | 629.2 | <.001 | 23.5 |
The relative abundance of YOY sharks exhibited monthly variability, with a significant increase from April–May to June indicative of parturition and a significant decrease from October to November indicative of emigration (Figure 3). The primary prey species of YOY blacktips (i.e., Gulf menhaden and Atlantic croaker) also varied by month (Figure 3). The highest relative abundances of both prey species was in May matching hypothesized blacktip parturition, with significant decreases through November (Figure 3). Comparably, age 1 blacktips exhibited no monthly variability in relative abundance (Figure 3). Blacktips from San Antonio Bay in 2018 exhibited an ontogenetic shift in mass:length, with YOY sharks exhibiting slightly negative allometric growth (b = 2.67) indicative of greater energetic allocation to length than mass, and age 1 sharks exhibiting substantial positive allometric growth (b = 5.00) indicative of greater energetic allocation to mass than length (Appendix S1).
FIGURE 3.

Relative abundances of age 0 and age 1 blacktips based on gillnet sampling, and primary YOY prey (Gulf menhaden [bag seine sampling] and Atlantic croaker [otter trawl sampling]). Primary prey were sampled across all months, whereas blacktips were not sampled in July and August. Error bars are ±SE, and letters above error bars indicate significant differences the relative abundances of shark or prey based on post hoc analysis
Cohorts exhibited considerable differences in the date YOY blacktips were first sampled (April 14–June 10; mean = May 13; Table 1), as well as estimated growth rates based on the slopes of best fit lines (Figure 4), both of which generally decreased from 1982 to 2017 (Figure 5). The final, most parsimonious GAM for growth rate included mean fall water temperature (edf = 1.21, F = 7.71, p < .05), day of first collection (i.e., parturition estimate; edf = 1.00, F = 6.76, p < .05), and CPUE of Atlantic croaker (edf = 2.70, F = 5.88, p < .05), with 57.9% of deviance explained (Table 2; Figure 6).
FIGURE 4.

Total length upon capture date used to estimate first year growth of blacktip cohorts based on shark age estimates (see Figure 2). Best fit lines are from linear regressions, and colors delineate different cohorts. No age 0 sharks were sampled in Spring 1996; thus, the 1996 cohort was removed from analyses
FIGURE 5.

Annual trends in estimated first year growth and second year residency (age 1:age 0 blacktips), with correlation test statistics and p‐values
TABLE 2.
Abiotic and biotic variables retained in the final GAMs after stepwise backwards AIC selection process using growth rate and standardized age 1 abundance as dependent variables
| Juvenile Blacktip growth rate | Age 1 abundance | |||||
|---|---|---|---|---|---|---|
| Model | AIC | DE | AIC | DE | ||
| −174.2 | 57.9% | −351.9 | 31% | |||
| ∆AIC | ∆DE | Estimated threshold | ∆AIC | ∆DE | Estimated threshold | |
|---|---|---|---|---|---|---|
| CPUE of Atlantic croaker | 9.8 | 21.2 | 15 fish * trawl−1 | – | – | |
| Day of year of first young‐of‐year sampled | 5.3 | 10.0 | 132.5 day of year | 4.2 | 14.2 | 132.5 day of year |
| Mean fall temperature (°C) | 13.8 | 34.0 | 25.0°C | 4 | 14.8 | 25.6°C |
Model suitability was interpreted from AIC scores and percent deviance explained (DE%). The relative importance of each variable was estimated given the difference in AIC (∆AIC) and DE (∆DE) when this variable was removed from the final model.
FIGURE 6.

Generalized additive model (GAM) response plots showing the influence of retained variables on the juvenile growth rate and standardized abundance of age 1 blacktips, including CPUE of Atlantic croaker (fish * trawl−1), the mean fall water temperature (°C), and day of year of first YOY sampled
The abundance of age 1 sharks exhibited no significant linear relationship with YOY abundance in the same cohort (Figure 7). However, the standardized abundances of age 1 sharks (age 1:age 0 for each cohort) exhibited a significantly negative relationship with first year growth, with an average second year residency of ca. 0.25 at mean growth indicating that on average ca. 25% of YOY blacktips returned to Texas estuaries after their first winter, assuming no sampling mortality (Figure 7). Standardized abundances of age 1 sharks exhibited a positive, but nonsignificant correlation with sampling year (Figure 5). The final, most parsimonious GAM using the standardized abundances of age 1 sharks as the dependent variable built on the results from the growth rate GAM and included mean fall temperature (edf = 1.00, F = 6.20, p < .05) and day of first YOY collection (edf = 1.00, F = 5.95, p < .05) with 31% of deviance explained (Table 2; Figure 6).
FIGURE 7.

Linear relationships between the relative abundances of age 0 and age 1 blacktips (left) and deviations from mean estimated first year growth (based on cohort slopes described in Table 1 and Figure 4), and the ratio of age 1:age 0 within cohorts (right). Dashed line in right panel indicates location of mean predicted first year growth, which intersects best fit line at ca. 0.25 age1:age0
4. DISCUSSION
Among the conservation challenges of the 20th century, many shark species experienced near extirpation across large portions of their geographic ranges (Dulvy et al., 2014). In turn, the implementation of fisheries management plans in some countries, and collaborative international efforts to reduce harvesting, bycatch, and habitat deterioration coupled with an enhanced understanding of shark biology and ecology have improved the status of some populations (Carlson et al., 2019). Yet, human actions are not the only threat to reproliferation. Natural variability in biotic and abiotic factors play key roles in shark abundance (e.g., Drymon et al., 2013; Dudley & Cliff, 2010; Plumlee et al., 2018), and the ecological conditions juvenile sharks encounter play pivotal roles in their growth and survival during early life history stages (Heithaus, 2007). YOY blacktip cohorts that experienced fewer prey, warmer or cooler water temperatures than average, and reduced time in estuaries prior to winter emigration exhibited compensatory growth, which may have reduced first year survival compared to cohorts born earlier, and in years with more abundant prey populations and moderate temperatures.
Like many other sharks in subtropical and temperate latitudes, juvenile blacktips in the GOM migrate to more equatorial waters along continental shelves in fall–early winter to avoid cooling nearshore waters, and may return in spring–early summer to further utilize the nursery functions of coastal estuaries (e.g., Hueter et al., 2005; Logan et al., 2020; Reyier et al., 2014). Larger body size energetically and ecologically aids in migratory behavior (e.g., Acolas et al., 2012; Nasby‐Lucas et al., 2019; Zhao et al., 2018). Thus, longer developmental time in nurseries and/or compensatory growth should provide benefits for juvenile sharks preparing for winter emigration and potential postwinter fidelity to nursery habitats (Hueter et al., 2005; Ulrich et al., 2007). Rapid first year growth across many shark species supports this hypothesis (Cailliet & Goldman, 2004). Based on presence/absence data, the average estuarine departure date for the last YOY blacktips sampled within the study area was October 29. As such, YOY blacktips had up to ca. 6 months on average to refine foraging and antipredator behavior, and allocate energy to structural growth and energy reserves within Texas estuaries, comparable to sharks in other estuaries across the region (McCandless, Kohler, et al., 2007).
Yet, intraspecific variability is pervasive across sharks, including emigration and parturition dates (e.g., Hoffmayer et al., 2013; McCandless et al., 2007; Sulikowski et al., 2016), which may lead to variability in litter and cohort success (Visser & Gienapp, 2019). The average date when YOY blacktips first occurred in Texas gillnets (May 13) fits predicted parturition timing (Baremore & Passerotti, 2012), and was used as an estimate of when parturition began in the study area. However, first YOY occurrence ranged from April 14 to June 10 during the study, and estuarine departure date for the last YOY blacktip ranged from September 22 to November 19. Consequently, late parturition cohorts had up to 40% less first year developmental time in estuaries compared to early parturition cohorts (4.1 and 6.9 total months, respectively), with 49% of variability in first year residence time explained by predicted parturition initiation. As such, parturition timing may be a key factor in first year success. For example, delayed hatching led to significantly smaller body size and lower fledging success of European great tit (Parus major) and blue tit (P. caeruleus) chicks resultant from mistimed phenology (abundance, quality) of primary prey species (Operophtera bumata; Buse et al., 1999). Fishes (e.g., Durant et al., 2005), mammals (e.g., Plard et al., 2014), and invertebrates (e.g., Visser & Both, 2005) also exhibit negative effects when parturition is mistimed with food availability. Prey populations (i.e., Atlantic croaker and Gulf menhaden) peaked in May across Texas estuaries. Thus, mismatched blacktip parturition coupled with less time in estuaries after parturition could reduce foraging opportunities for some cohorts and subsequently affect growth, development, and survival before and during winter emigration (Visser & Gienapp, 2019).
Delayed parturition was, however, not fatal for all sharks. Despite missing peak prey abundance, late parturition cohorts exhibited accelerated first year growth rates, suggesting that food resources are not limiting for YOY blacktips and other predators in Texas estuaries. Compensatory growth previously documented in other shark populations resulted from declines in abundance, with subsequent density‐dependence release promoting increased growth rates (e.g., Carlson & Baremore, 2003; Romine et al., 2013). Comparatively, first year growth among blacktips in Texas was not influenced by shark abundance, and reductions in prey populations led to increased first year growth rates, supporting our hypothesis that food is not limiting. Additionally, regional differences in the body condition of juvenile bull sharks suggest that southern Texas estuaries are more productive than northern estuaries and those in the eastern GOM, providing further support (Garcia Barcia et al., 2021). Some mammals (e.g., Odocoileus virginianus; Michel et al., 2018), birds (Cerorhinca monocerata; Hirose et al., 2012), fish (e.g., Forsterygion lapillum; Moginie & Shima, 2018), amphibians (e.g., Rana arvalis; Orizaola et al., 2010), and invertebrates (e.g., Pararge aegeria; Nylin et al., 1989) that experience delayed birth also exhibit more rapid growth than earlier born conspecifics, providing fitness benefits associated with larger body size (Roff, 1992; Stearns, 1992). As such, our results add to studies indicating late‐born individuals can catch‐up through behavioral and/or physiological compensatory mechanisms (Hector & Nakagawa, 2012).
Late parturition, reduced prey abundance, and average fall water temperatures below ca. 25°C and above ca. 27°C were drivers of increased YOY growth rates. Beyond warmer water temperatures leading to increased metabolic activity and thus growth (Huey & Stevenson, 1979), other predictor variables suggest fast growing blacktip cohorts foraged more frequent and/or more efficiently to increase energy acquisition (Dmitriew, 2011). Juvenile sharks in other nurseries also exhibit intraspecific variation in foraging to improve metabolic status. For example, all juvenile bull sharks in a Florida estuary seasonally increased foraging in low risk, low salinity habitats to access allochthonous prey resources (Matich & Heithaus, 2014), but only some individuals foraged in high risk, high reward marine habitats the remainder of the year (Matich et al., 2011). Similarly, juvenile lemon sharks more willing to explore novel habitats in Bimini, The Bahamas, exhibited faster growth, but lower survival rates than less exploratory conspecifics, presumably in response to using more rewarding but riskier seagrass habitats (Dhellemmes et al., 2020). Thus, reduced food availability due to less abundant prey populations and late parturition may have led to increased foraging rates and/or larger search areas among YOY blacktips. Average fall water temperatures below ca. 25°C may have also served as a cue for YOY sharks to increase foraging rates/efficiency, and therefore risk taking in preparation of early winter migrations into the GOM (Matich & Heithaus, 2015).
As a result, the trade‐offs associated with prolonged compensatory behaviors, including reduced time in refuge and reduced vigilance during foraging, could have reduced survival (Dmitriew, 2011). Many YOY sharks face food‐risk trade‐offs, and often use small home ranges and low risk habitats to avoid encounters with potential predators (e.g., Heupel et al., 2004; Legare et al., 2018; Morrissey & Gruber, 1993). Consequently, compensatory growth poses a risk for YOY blacktips if rewarding but risky behaviors increase overlap with potential predators like large sharks in habitats proximate to the GOM (Lofthus, 2019; Matich & Heithaus, 2015; Werner & Gilliam, 1984). Blacktips born earlier in years with more abundant prey resources, and optimal fall water temperatures likely exhibited more conservative foraging behavior that led to reduce growth rates but increased survival, which is supported by patterns in second year (i.e., age 1) residency.
Site fidelity is exhibited by some juvenile sharks, including blacktips, which use nurseries during their first few years for the protective benefits these habitats provide (Chapman et al., 2015). While untested, several estuaries in the western GOM appear to be important blacktip nurseries based on repeated annual abundances of YOY sharks in the Matagorda and Guadalupe‐San Antonio estuaries, and the confluence of the Corpus Christi and Mission‐Aransas estuaries (Heupel et al., 2007). Based on the relative abundances of YOY and age 1 individuals, and assuming blacktips leave estuaries in late fall–early winter (Hueter et al., 2005; Parsons & Hoffmayer, 2007; Steiner et al., 2007), blacktips exhibited a ca. 25% first year return rate to the study area, which is comparable to other regions where blacktips exhibit site fidelity (e.g., Ulrich et al., 2007). However, second year residency was highly variable across cohorts during the study period (1–77%). While the duration of first year (YOY) residency was not correlated with second year residency, first year growth rate was (r = −.40), indicating faster growing cohorts were comprised of fewer sharks that returned to Texas estuaries. If compensatory growth requires risky behavior, then second year residency may serve as an indicator for first year survival, with YOY blacktips attempting to catch up in size exhibiting higher rates of mortality (Dhellemmes et al., 2020; Lima & Dill, 1990; Werner & Anholt, 1993). As such, YOY blacktips may overcome late parturition and suboptimal nursery conditions through compensatory growth, but the associated behaviors that increase energetic acquisition likely reduce first year survival, particularly if they persist in higher risk GOM waters during overwintering (Dmitriew, 2011).
Alternatively, compensatory growth may reduce the need for blacktips to return to Texas estuaries after their first year. Some migratory YOY blacktip populations permanently emigrate from natal nurseries (e.g., Gurshin, 2007; Hueter et al., 2007; Steiner et al., 2007), and Texas blacktips could have immigrated to more equatorial estuaries in Mexico proximate to overwintering waters (e.g., Rio Soto La Marina, San Andrés, Laguna de Tamiahua; Hueter et al., 2007, McCandless, Pratt, et al., 2007). However, size frequency distributions indicate that at least some YOY blacktips return to Texas estuaries like other juvenile populations in the region (e.g., Hueter & Tyminski, 2007; Parsons & Hoffmayer, 2007; Ulrich et al., 2007). Juvenile sharks exhibit ontogenetic shifts in home ranges (size and location) to meet growing metabolic needs (Grubbs, 2010), which could account for reduced second year residency among fast growing blacktip cohorts. Consequently, second year residency may be indicative of the speed of ontogenetic shifts in habitat use rather than survival, with a greater proportion of blacktips in fast‐growing cohorts spending a single season in natal estuaries. Yet, sampling data indicate a nearly equal proportion of age 0–1 (second year; 12% of sampled sharks) and age 1–2 sharks (third year; 9% of sampled sharks) caught in spring gillnets, suggesting blacktips use Texas estuaries for multiple years, and intercohort variability in second year residency is more likely attributed to survival than ontogenetic habitat shifts. Elegantly designed tracking and life history studies are needed to fully address this question though.
4.1. Caveats
While data analyses and interpretation fit within previous frameworks and ecological theory (Dhellemmes et al., 2020; Dmitriew, 2011; Matich et al., 2020), the assumptions of our study should be considered prior to drawing conclusions. Despite careful assignation of ages to blacktips, it is likely that some individuals were misclassified considering differences in in situ data and VBGFs (Figure 2), and inherent variability in birth sizes and growth rates within cohorts. Assigning a YOY shark as age 1 or vice versa would have implications in cohort assignation and in turn cohort growth rates and second year residency. While misclassification cannot be reconciled based on available data, the size structure of juvenile blacktips in the western GOM shows distinct cohort structuring from which to delineate age 0 and 1 sharks (Figure 2). As such, the vast majority of sharks were likely assigned correctly as YOY or age 1, with exceptions for YOY sharks larger than expected and age 1 sharks smaller than expected based on birth size or individual growth rate, with a higher likelihood of misclassification for age 1 than age 0 based on assignation criteria. Bias was likely equal across years based on the use of a priori criteria rather than post hoc visual identification, and the distinction of highly significant regression models for each cohort support the classification methodology.
An additional consideration is the use of the dates of first YOY and last YOY sampled as estimates of parturition initiation and emigration completion. While parturition estimates fit with predictions based on previous studies and comparable nurseries (Baremore & Passerotti, 2012; Hueter & Tyminski, 2007), parturition could have been earlier that April or later than June, and thus undetected during the spring sampling period. Indeed, age 0 sharks were sampled in the first week of spring (1989, 2015, 2017), and thus may have been present prior to sampling. Age 0 sharks were also undetected during spring sampling in 1 year (1996). However, these events were rare (8% and 3%, respectively), and 1996 was removed from analysis eliminating this confounding factor. Thus, the observed trends are unlikely attributed to the restricted spring sampling period, and the first occurrence of YOY blacktips in gillnets is likely a good estimate for the initiation of blacktip parturition in the western GOM.
Coordinated parturition is also unlikely (McCandless, Kohler, et al., 2007), though short parturition periods are exhibited by some populations (Castro, 2009), and the ecological benefits of synchronous parturition are evident considering large sharks (e.g., Carcharhinus brevipinna, C. leucas, C. limbatus) are present within Texas estuaries April–November (Ims, 1990; Lofthus, 2019; TPWD unpublished data). Interpretation should therefore be made at the cohort level rather than the litter or individual level—the ecological processes discussed apply to individual sharks and shark litters, but the consequences cannot be assessed at these organizational levels due to sampling constraints. Similarly, juvenile sharks rarely exhibit coordinated emigration beyond responses to extreme events (Huepel et al., 2003; McCandless, Kohler, et al., 2007; Strickland et al., 2019), thus estimated emigration dates were used for estimates of first year residency. Some YOYs were sampled in the last week of fall sampling (34% of years). Thus, final emigration dates could be later than estimated, particularly in warmer, more equatorial estuaries (e.g., Laguna Madre), and warrants further investigation, though emigration timing is comparable to that exhibited by YOY blacktips in the eastern GOM at similar latitudes (Hueter et al., 2005). Patterns are also unlikely to be uniform across estuaries. Sample sizes necessitated pooling data, providing regional rather than estuary/nursery‐specific patterns, but more refined studies should be considered in estuaries with elevated juvenile blacktip densities (i.e., Matagorda, Guadalupe‐San Antonio, and Corpus Christi estuaries).
5. CONCLUSIONS
While assessing the abundances and size structures of target species are among the primary aims for fisheries monitoring, the value of such programs reach beyond traditional stock assessments. Across the western GOM, long‐term monitoring by TPWD has provided insight into shark nursery function (Froeshcke et al., 2010), responses to environmental variability (Plumlee et al., 2018), and predator–prey relationships (Cottrant et al., 2021; Livernois et al., 2021). Our study illustrates the ecological mechanisms that shape variability in juvenile blacktip growth rates and residency patterns, and how monitoring parturition timing and water temperature can provide reliable predictions of early blacktip life history within the western GOM.
It is unclear what determines blacktip parturition timing in the western GOM. However, its gradually earlier occurrence during the study period (ca. 0.2 days earlier per year) could be attributed to warming GOM waters (ca. 0.03°C year−1) that reduce gestation time among blacktips, and in turn increase estuarine developmental time for YOY blacktips prior to winter emigration (Schlaff et al., 2014). Warming waters could lead to physiologically suboptimal nursery conditions that counteract early parturition benefits (Huey & Stevenson, 1979; Lyons et al., 2020). Yet, YOY blacktips exhibited a negative trend in growth rates, and a positive trend in second year residency during the study period (Figure 5), suggesting thermal thresholds have not yet been reached despite the ca. 0.05°C year−1 increase in average water temperatures from Matagorda estuary to Laguna Madre since 1982.
Despite the caveats discussed, our study provides a framework to test for compensatory growth‐risk trade‐offs across other species and ecosystems where long‐term monitoring is conducted moving forward (e.g., Benavides et al., 2021; Drymon et al., 2010). GOM blacktips are among the most economically important shark stocks in the region; thus, the implications of our study are of value for conservation and management (NMFS, 2018). However, assessments of more vulnerable species that use the GOM for nursery habitats (e.g., Hueter & Tyminski, 2007; Scharer et al., 2017) provide even greater promise moving forward considering current trends in sea level rise and warming water temperatures, and the associated phenological and ecological shifts observed among migratory species (Scranton & Amarasekare, 2017). Long‐term monitoring has been heralded as an integral aspect to ecology (Alber et al., 2013), and our study serves as one more reminder why such work should be supported.
CONFLICT OF INTEREST
None declared.
AUTHOR CONTRIBUTION
Philip Matich: Conceptualization (lead); Data curation (supporting); Formal analysis (equal); Investigation (lead); Methodology (lead); Project administration (lead); Supervision (lead); Visualization (lead); Writing‐original draft (lead); Writing‐review & editing (lead). Jeffrey D Plumlee: Conceptualization (supporting); Data curation (supporting); Formal analysis (equal); Investigation (supporting); Methodology (supporting); Visualization (supporting); Writing‐original draft (supporting); Writing‐review & editing (supporting). Mark Fisher: Data curation (lead); Resources (lead).
Supporting information
Appendix S1
ACKNOWLEDGMENTS
Thanks to staff from TPWD Coastal Fisheries Port O’Connor Laboratory for providing specimens, and Matt Hamilton for processing specimens. Research funding was provided by the United States Fish and Wildlife Service through Texas Parks and Wildlife Department State Wildlife Grant program (TX‐T‐177‐R‐1). The open access publishing fees for this article have been covered by the Texas A&M University Open Access to Knowledge Fund (OAKFund), supported by the University Libraries. All catch data were provided by Texas Parks and Wildlife Department.
Matich, P. , Plumlee, J. D. , & Fisher, M. (2021). Grow fast, die young: Does compensatory growth reduce survival of juvenile blacktip sharks (Carcharhinus limbatus) in the western Gulf of Mexico? Ecology and Evolution, 11, 16280–16295. 10.1002/ece3.8311
DATA AVAILABILITY STATEMENT
Data are managed, archived, and made available by TPWD Coastal Fisheries (https://tpwd.texas.gov/about/administration‐divisions/coastal‐fisheries).
REFERENCES
- Acolas, M. L. , Labonne, J. , Baginière, J. L. , & Roussel, J. M. (2012). The role of body size versus growth on the decision to migrate: A case study with Salmo trutta . Naturwissenschaften, 99, 11–21. 10.1007/s00114-011-0861-5 [DOI] [PubMed] [Google Scholar]
- Alber, M. , Reed, D. , & McGlathery, K. (2013). Coastal long term ecological research: Introduction to the special issue. Oceanography, 26, 14–17. 10.5670/oceanog.2013.40 [DOI] [Google Scholar]
- Álvarez, D. (2011). Effects of compensatory growth on fish behavior. In Farrell A. P. (Ed.), Encyclopedia of fish physiology: From genome to environment (pp. 752–757). Elsevier Inc. [Google Scholar]
- Baremore, I. E. , & Passerotti, M. S. (2012). Updates to age and growth parameters for blacktip shark, Carcharhinus limbatus, in the Gulf of Mexico. SEDAR29‐WP‐18. SEDAR, North Charleston, SC. 12 pp.
- Benavides, M. T. , Fodrie, F. J. , Fegley, S. R. , & Bargione, G. (2021). Size changes within a southeastern United States coastal shark assemblage: 1975–2018. Marine and Coastal Fisheries, 13, 228–239. 10.1002/mcf2.10151 [DOI] [Google Scholar]
- Brodersen, J. , Rodriguez‐Gil, J. L. , Jönsson, M. , Hansson, L.‐A. , Brönmark, C. , Nilsson, P. A. , Nicolle, A. , & Berglund, O. (2011). Temperature and resource availability may interactively affect over‐wintering success of juvenile fish in a changing climate. PLoS One, 6, e24022. 10.1371/journal.pone.0024022 [DOI] [PMC free article] [PubMed] [Google Scholar]
- Buse, A. , Dury, S. J. , Woodburn, R. J. W. , Perrins, C. M. , & Good, J. E. G. (1999). Effects of elevated temperature on multispecies interactions: The case of pedunculate oak, winter moth and tits. Functional Ecology, 13, 74–82. 10.1046/j.1365-2435.1999.00010.x [DOI] [Google Scholar]
- Cailliet, G. M. , & Goldman, K. J. (2004). Age determination and validation in Chondrichthyan fishes. In Carrier J. C., Musick J. A., & Heithaus M. R. (Eds.), Biology of sharks and their relatives (pp. 399–445). CRC Press. [Google Scholar]
- Carlson, J. K. , & Baremore, I. E. (2003). Change in biological parameters of Atlantic sharpnose shark Rhizoprionodon terraenovae in the Gulf of Mexico: Evidence for density‐dependent growth and maturity? Marine and Freshwater Research, 54, 227–234. [Google Scholar]
- Carlson, J. K. , Heupel, M. R. , Young, C. N. , Cramp, J. E. , & Simpfendorfer, C. A. (2019). Are we ready for elasmobranch conservation success? Environmental Conservation, 46, 264–266. 10.1017/S0376892919000225 [DOI] [Google Scholar]
- Carlson, J. K. , Sulikowski, J. R. , & Baremore, I. E. (2006). Do differences in life history exist for blacktip sharks, Carcharhinus limbatus, from the United States south Atlantic Bight and Eastern Gulf of Mexico? Environmental Biology of Fishes, 77, 279–292. [Google Scholar]
- Cassoff, R. M. , Campana, S. E. , & Myklevoll, S. (2007). Changes in baseline growth and maturation parameters of Northwestern Atlantic porbeagle, Lamna nasus, following heavy exploitation. Canadian Journal of Fisheries and Aquatic Sciences, 64, 19‐29. [Google Scholar]
- Castro, J. I. (2009). Observations on the reproductive cycles of some viviparous North America sharks. Aqua, International Journal of Ichthyology, 15, 205–222. [Google Scholar]
- Chapman, D. D. , Feldheim, K. A. , Papastamatiou, Y. P. , & Hueter, R. E. (2015). There and back again: A review of residency and return migrations in sharks, with implications for population structure and management. Annual Review of Marine Science, 7, 547–570. 10.1146/annurev-marine-010814-015730 [DOI] [PubMed] [Google Scholar]
- Coelho, R. , Rey, J. , de Sola, L. G. , de Carvalho, J. F. , & Erzini, K . (2010). Comparing Atlantic and Mediterranean populations of the velvet belly lanternshark, Etmopterus spinax, with comments on the efficiency of density‐dependent compensatory mechanisms. Marine Biology Research, 6, 373‐380. [Google Scholar]
- Cottrant, E. , Matich, P. , & Fisher, M. R. (2021). Boosted regression tree models predict the diets of juvenile bull sharks in a subtropical estuary. Marine Ecology Progress Series, 659, 127–141. 10.3354/meps13568 [DOI] [Google Scholar]
- Deacy, B. , & Moncrief‐Cox, H. (2019). Age and growth parameters for blacktip sharks, Carcharhinus limbatus, in the western North Atlantic Ocean. SEDAR65‐DW02. SEDAR, North Charleston, SC. 10 pp.
- Dhellemmes, F. , Finger, J.‐S. , Smukall, M. , Gruber, S. H. , Guttridge, T. L. , Laskowski, K. L. , & Krause, J. (2020). Personality‐driven life history trade‐offs differ in two subpopulations of free‐ranging predators. Journal of Animal Ecology, 90, 260–272. 10.1111/1365-2656.13283 [DOI] [PubMed] [Google Scholar]
- DiBattista, J. D. , Feldheim, K. A. , Gruber, S. H. , & Hendry, A. P. (2007). When bigger is not better: Selection against large size, high condition, and fast growth in juvenile lemon sharks. Journal of Evolutionary Biology, 20, 201–212. 10.1111/j.1420-9101.2006.01210.x [DOI] [PubMed] [Google Scholar]
- Djurichkovic, L. D. , Donelson, J. M. , Fowler, A. M. , Feary, D. A. , & Booth, D. J. (2019). The effects of water temperature on the juvenile performance of two tropical damselfishes expatriating to temperate reefs. Scientific Reports, 9, 13937. 10.1038/s41598-019-50303-z [DOI] [PMC free article] [PubMed] [Google Scholar]
- Dmitriew, C. M. (2011). The evolution of growth trajectories: what limits growth rate? Biological Review, 86, 97–116. 10.1111/j.1469-185X.2010.00136.x [DOI] [PubMed] [Google Scholar]
- Drymon, J. M. , Carassou, L. , Powers, S. P. , Grace, M. , Dindo, J. , & Dzwonkowski, B. (2013). Multiscale analysis of factors that affect the distribution of sharks throughout the northern Gulf of Mexico. Fishery Bulletin, 111, 370–380. 10.7755/FB.111.4.6 [DOI] [Google Scholar]
- Drymon, J. M. , Powers, S. P. , Dindo, J. , Dzwonkowski, B. , & Henwood, T. A. (2010). Distributions of sharks across a continental shelf in the northern Gulf of Mexico. Marine and Coastal Fisheries, 2, 440–450. 10.1577/C09-061.1 [DOI] [Google Scholar]
- Dudley, S. F. J. , & Cliff, G. (2010). Influence of the annual sardine run on catches of large sharks in the protective gillnets off KwaZulu‐Natal, South Africa, and the occurrence of sardine in shark diet. African Journal of Marine Science, 32, 383–397. 10.2989/1814232X.2010.502641 [DOI] [Google Scholar]
- Dulvy, N. K. , Fowler, S. L. , Musick, J. A. , Cavanagh, R. D. , Kyne, P. M. , Harrison, L. R. , Carlson, J. K. , Davidson, L. N. K. , Fordham, S. V. , Francis, M. P. , Pollock, C. M. , Simpfendorfer, C. A. , Burgess, G. H. , Carpenter, K. E. , Compagno, L. J. V. , Ebert, D. A. , Gibson, C. , Heupel, M. R. , Livingstone, S. R. , … White, W. T. (2014). Extinction risk and conservation of the world’s sharks and rays. eLife, 3, e00590. 10.7554/eLife.00590 [DOI] [PMC free article] [PubMed] [Google Scholar]
- Durant, J. M. , Hjermann, D. Ø. , Anker‐Nilssen, T. , Beaugrand, G. , Mysterud, A. , Pettorelli, N. , & Stenseth, N. C. (2005). Timing and abundance as key mechanisms affecting trophic interactions in variable environments. Ecology Letters, 8, 952–958. 10.1111/j.1461-0248.2005.00798.x [DOI] [PubMed] [Google Scholar]
- Evans, D. (2012). Building the European Union’s Natura 2000 network. Nature Conservation, 1, 11–26. 10.3897/natureconservation.1.1808 [DOI] [Google Scholar]
- Froeschke, J. T. , Stunz, G. W. , Sterba‐Boatwright, B. , & Wildhaber, M. L. (2010). An empirical test of the ‘shark nursery area concept’ in Texas bays using a long‐term fisheries‐independent data set. Aquatic Biology, 11, 65–76. 10.3354/ab00290 [DOI] [Google Scholar]
- Froeschke, J. , Stunz, G. W. , & Wildhaber, M. L. (2010). Environmental influences on the occurrence of coastal sharks in estuarine waters. Marine Ecology Progress Series, 407, 279–292. 10.3354/meps08546 [DOI] [Google Scholar]
- Garcia Barcia, L. , Clementi, G. , Gastrich, K. , Hagan, V. , Morris, J. , Moncrief‐Cox, H. , Lorenzo, Y. , Strickland, B. , Matich, P. , Chapman, D. , & Heithaus, M. (2021). Growth, habitat use and movement patterns as drivers of mercury and methylmercury tissue concentrations of bull sharks. Annual Meeting of the American Elasmobranch Society.
- Gardiner, J. M. , Hueter, R. E. , Maruska, K. P. , Sisneros, J. A. , Casper, B. M. , Mann, D. A. , & Demski, L. S. (2012). Sensory physiology and behavior of elasmobranchs. In Carrier J. C., Musick J. A., & Heithaus M. R. (Eds.), Biology of sharks and their relatives, 2nd ed. (pp. 349–402). CRC Press. [Google Scholar]
- Grubbs, R. D. (2010). Ontogenetic shifts in movements and habitat use. In Carrier J. C., Musick J. A., & Heithaus M. R. (Eds.), Sharks and their relatives II. Biodiversity, adaptive physiology, and conservation (pp. 319–350). CRC Press. [Google Scholar]
- Gurshin, C. W. D. (2007). Shark nursery grounds in Sapelo Island National Estuarine Research Reserve, Georgia. In McCandless C. T., Kohler N. E., & Pratt H. L. Jr. (Eds.), Shark nursery grounds of the Gulf of Mexico and the East Coast Waters of the United States. American Fisheries Society Symposium 50. Bethesda, MD, pp. 141–151. [Google Scholar]
- Guttridge, T. L. (2020). Behavior and cognition. In Abel D. C., & Grubbs R. D. (Eds.), Shark biology and conservation (pp. 321–345). John Hopkins University Press. [Google Scholar]
- Hector, H. L. , & Nakagawa, S. (2012). Quantitative analysis of compensatory and catch‐up growth in diverse taxa. Journal of Animal Ecology, 81, 583–593. 10.1111/j.1365-2656.2011.01942.x [DOI] [PubMed] [Google Scholar]
- Heithaus, M. R. (2004). Predator‐prey interactions. In Carrier J. C., Musick J. A., & Heithaus M. R. (Eds.), Biology of sharks and their relatives (pp. 487–522). CRC Press. [Google Scholar]
- Heithaus, M. R. (2007). Nursery areas as essential shark habitats: a theoretical perspective. In McCandless C. T., Kohler N. E., & Pratt H. L. Jr. (Eds.), Shark Nursery Grounds of the Gulf of Mexico and the East Coast Waters of the United States. American Fisheries Society Symposium 50. Bethesda, MD, pp. 3–16. [Google Scholar]
- Heupel, M. R. , Carlson, J. K. , & Simpfendorfer, C. A. (2007). Shark nursery areas: Concepts, definition, characterization and assumptions. Marine Ecology Progress Series, 337, 287–297. 10.3354/meps337287 [DOI] [Google Scholar]
- Heupel, M. R. , Simpfendorfer, C. A. , & Hueter, R. E. (2004). Estimation of shark home ranges using passive monitoring techniques. Environmental Biology of Fishes, 71, 135–142. 10.1023/B:EBFI.0000045710.18997.f7 [DOI] [Google Scholar]
- Hirose, F. , Kazama, K. , Ito, M. , & Watanuki, Y. (2012). Accelerated growth rates in late‐hatched Rhinoceros Auklet Cerorhinca monocerata chicks depend on food conditions and growth stage: an experimental approach. Ibis, 154, 296–306. 10.1111/j.1474-919X.2011.01205.x [DOI] [Google Scholar]
- Hoffmayer, E. R. , Driggers, W. B. , Jones, L. M. , Hendon, J. M. , & Sulikowski, J. A. (2013). Variability in the reproductive biology of the Atlantic sharpnose shark in the Gulf of Mexico. Marine and Coastal Fisheries, 5, 139–151. 10.1080/19425120.2013.783518 [DOI] [Google Scholar]
- Hornick, J. L. , Van Eenaeme, C. , Gérard, O. , Dufrasne, I. , & Istasse, L. (2000). Mechanisms of reduced and compensatory growth. Domestic Animal Endocrinology, 19, 121–132. 10.1016/S0739-7240(00)00072-2 [DOI] [PubMed] [Google Scholar]
- Huepel, M. R. , Simpfendorfer, C. A. , & Hueter, R. E. (2003). Running before the storm: Blacktip sharks respond to falling barometric pressure associated with Tropical Storm Gabrielle. Journal of Fish Biology, 63, 1357–1363. 10.1046/j.1095-8649.2003.00250.x [DOI] [Google Scholar]
- Hueter, R. E. , Castillo‐Géniz, J. L. , Márquez‐Farias, J. F. , & Tyminski, J. P. (2007). The use of Laguna Yalahau, Quintana Roo, Mexico as a primary nursery for the blacktip shark. In McCandless C. T., Kohler N. E., & H. L. Pratt Jr (Eds.), Shark Nursery Grounds of the Gulf of Mexico and the East Coast Waters of the United States. American Fisheries Society Symposium 50. Bethesda, MD, pp. 345–364. [Google Scholar]
- Hueter, R. E. , Heuple, M. R. , Heist, E. J. , & Keeney, D. B. (2005). Evidence of philopatry in sharks and implications for the management of shark fisheries. Journal of Northwest Atlantic Fisheries Science, 35, 239–247. 10.2960/J.v35.m493 [DOI] [Google Scholar]
- Hueter, R. E. , & Tyminski, J. P. (2007). Species‐specific distribution and habitat characteristics of shark nurseries in Gulf of Mexico waters off peninsular Florida and Texas. In McCandless C. T., Kohler N. E., & Pratt H. L. Jr. (Eds.), Shark nursery grounds of the Gulf of Mexico and the East Coast Waters of the United States. American Fisheries Society Symposium 50. Bethesda, MD, pp. 193–223. [Google Scholar]
- Huey, R. B. , & Stevenson, R. D. (1979). Integrating thermal physiology and ecology of ectotherms: A discussion of approaches. American Zoologist, 19, 357–366. 10.1093/icb/19.1.357 [DOI] [Google Scholar]
- Hussey, N. E. , Wintner, S. P. , Dudley, S. F. J. , Cliff, G. , Cocks, D. T. , & MacNeil, M. A. (2010). Maternal investment and size‐specific reproductive output in carcarhinid sharks. Journal of Animal Ecology, 79, 184–193. [DOI] [PubMed] [Google Scholar]
- Hutton, J. , Adams, W. M. , & Murombedzi, J. C. (2005). Back to the barriers? Changing narratives in biodiversity conservation. Forum for Development Studies, 32, 341–370. 10.1080/08039410.2005.9666319 [DOI] [Google Scholar]
- Ims, R. A. (1990). On the adaptive value of reproductive synchrony as a predator‐swamping strategy. The American Naturalist, 136, 485–498. 10.1086/285109 [DOI] [Google Scholar]
- Kennelly, S. J. , & Broadhurst, M. K. (2002). By‐catch begone: Changes in the philosophy of fishing technology. Fish and Fisheries, 3, 340–355. 10.1046/j.1467-2979.2002.00090.x [DOI] [Google Scholar]
- Kerby, J. T. , Wilmers, C. C. , & Post, E. (2012). Climate change, phenology and the nature of consumer‐resource interactions: Advancing the match/mismatch hypothesis. In Ohgushi T., Schmitz O. J., & Holt R. D. (Eds.), Trait‐mediated indirect interactions: Ecological and evolutionary perspectives (pp. 508–525). Cambridge University Press. [Google Scholar]
- Kindsvater, H. K. , & Otto, S. P. (2014). The evolution of offspring size across life‐history stages. The American Naturalist, 184, 543–555. 10.1086/678248 [DOI] [PubMed] [Google Scholar]
- Kinney, M. J. , & Simpfendorfer, C. A. (2009). Reassessing the value of nursery areas to shark conservation and management. Conservation Letters, 2, 53–60. 10.1111/j.1755-263X.2008.00046.x [DOI] [Google Scholar]
- Legare, B. , Skomal, G. , & DeAngelis, B. (2018). Diel movements of the blacktip shark (Carcharhinus limbatus) in a Caribbean nursery. Environmental Biology of Fishes, 101, 1011–1023. 10.1007/s10641-018-0755-x [DOI] [Google Scholar]
- Lima, S. , & Dill, L. M. (1990). Behavioral decisions made under the risk of predation: A review and prospectus. Canadian Journal of Zoology, 68, 619–640. 10.1139/z90-092 [DOI] [Google Scholar]
- Livernois, M. C. , Fujiwara, M. , Fisher, M. , & Wells, R. J. D. (2021). Seasonal patterns of habitat suitability and spatiotemporal overlap within an assemblage of estuarine predators and prey. Marine Ecology Progress Series, 668, 39–55. 10.3354/meps13700 [DOI] [Google Scholar]
- Lofthus, A. J. (2019). Factors influencing the nursery dynamics of juvenile bull sharks in two estuaries along the Texas coast. Sam Houston State University Master’s thesis, p. 76.
- Logan, R. K. , Vaudo, J. J. , Sousa, L. L. , Sampson, M. , Wetherbee, B. M. , & Shivji, M. S. (2020). Seasonal movements and habitat use of juvenile smooth hammerhead sharks in the western North Atlantic Ocean and significance for management. Frontiers in Marine Science, 7, 566364. 10.3389/fmars.2020.566364 [DOI] [Google Scholar]
- Longley, W. L. (1994). Freshwater inflows to Texas Bays and estuaries: Ecological relationships and methods for determination of needs. Texas Water Development Board and Texas Parks and Wildlife Department, Austin, TX, 386 pp. [Google Scholar]
- Lyons, K. , Galloway, A. S. , Adams, D. H. , Reyier, E. A. , Barker, A. M. , Portnoy, D. S. , & Frazier, B. S. (2020). Maternal provisioning gives young‐of‐the‐year Hammerheads a head start in early life. Marine Biology, 167, 157. 10.1007/s00227-020-03766-y [DOI] [Google Scholar]
- Matich, P. , & Heithaus, M. R. (2014). Multi‐tissue stable isotope analysis and acoustic telemetry reveal seasonal variability in the trophic interactions of juvenile bull sharks in a coastal estuary. Journal of Animal Ecology, 83, 199–213. 10.1111/1365-2656.12106 [DOI] [PubMed] [Google Scholar]
- Matich, P. , & Heithaus, M. R. (2015). Individual variation in ontogenetic niche shifts in habitat use and movement patterns of a large estuarine predator (Carcharhinus leucas). Oecologia, 178, 347–359. 10.1007/s00442-015-3253-2 [DOI] [PubMed] [Google Scholar]
- Matich, P. , Heithaus, M. R. , & Layman, C. A. (2011). Contrasting patterns of individual specialization and trophic coupling in two marine apex predators. Journal of Animal Ecology, 80, 295–304. 10.1111/j.1365-2656.2010.01753.x [DOI] [PubMed] [Google Scholar]
- Matich, P. , Plumlee, J. D. , Weideli, O. C. , & Fisher, M. (2021). New insights into the trophic ecology of blacktip sharks (Carcharhinus limbatus) from a subtropical estuary in the western Gulf of Mexico. Journal of Fish Biology, 98, 470–484. [DOI] [PubMed] [Google Scholar]
- Matich, P. , Strickland, B. A. , & Heithaus, M. R. (2020). Long‐term monitoring provides insight into estuarine top predator (Carcharhinus leucas) resilience following an extreme weather event. Marine Ecology Progress Series, 639, 169–183. 10.3354/meps13269 [DOI] [Google Scholar]
- McCandless, C. T. , Kohler, N. E. , & Pratt, H. L. Jr. (2007). Shark nursery grounds of the Gulf of Mexico and the East Coast Waters of the United States. American Fisheries Society Symposium 50. Bethesda, MD, 390 pp. [Google Scholar]
- McCandless, C. T. , Pratt, H. L. Jr. , Kohler, N. E. , Merson, R. R. , & Recksiek, C. W. (2007). Distribution, localized abundance, and migrations of juvenile sandbar sharks tagged in Delaware Bay. In McCandless C. T., Kohler N. E., & Pratt H. L. Jr. (Eds.), Shark nursery grounds of the Gulf of Mexico and the East Coast Waters of the United States. American Fisheries Society Symposium 50. Bethesda, MD, pp. 45–62. [Google Scholar]
- Michel, E. S. , Demarais, S. , Strickland, B. K. , & Wang, G. M. (2018). Birth date promotes a tortoise or hare tactic for body mass development of a long‐lived male ungulate. Oecologia, 186, 117–128. 10.1007/s00442-017-4013-2 [DOI] [PubMed] [Google Scholar]
- Moginie, B. F. , & Shima, J. S. (2018). Hatch date and growth rate drives reproductive success in nest‐guarding males of a temperate reef fish. Marine Ecology Progress Series, 592, 197–206. 10.3354/meps12506 [DOI] [Google Scholar]
- Morrissey, J. F. , & Gruber, S. H. (1993). Home range of juvenile lemon sharks, Negaprion brevirostris . Copeia, 1993, 425–434. 10.2307/1447141 [DOI] [Google Scholar]
- Nasby‐Lucas, N. , Dewar, H. , Sosa‐Niskizaki, O. , Wilson, C. , Hyde, J. R. , Vetter, R. D. , Wraith, J. , Block, B. A. , Kinney, M. J. , Sippel, T. , Holts, D. B. , & Kohin, S. (2019). Movements of electronically tagged shortfin mako shark (Isurus oxyrinchus) in the eastern North Pacific Ocean. Animal Biotelemetry, 7, 12. [Google Scholar]
- NMFS . (2018). Southeast Data Assessment and Review (SEDAR) 29 update assessment report: HMS Gulf of Mexico Blacktip Shark. July 2018. DOC/NOAA/NMFS SEDAR, 4055 Faber Place Drive, Suite 201, North Charleston, SC 29405, p. 99.
- Nylin, S. , Wickman, P.‐O. , & Wiklund, C. (1989). Seasonal plasticity in growth and development of the speckled wood butterfly, Pararge aegeria (Satyrinae). Biological Journal of the Linnean Society, 38, 155–171. 10.1111/j.1095-8312.1989.tb01571.x [DOI] [Google Scholar]
- Orizaola, G. , Dahl, E. , & Laurila, A. (2010). Compensating for delayed hatching across consecutive life‐history stages in an amphibian. Oikos, 119, 980–987. 10.1111/j.1600-0706.2009.17956.x [DOI] [Google Scholar]
- Parsons, G. R. , & Hoffmayer, E. R. (2007). Identification and characterization of shark nursery grounds along the Mississippi and Alabama Gulf Coasts. In McCandless C. T., Kohler N. E., & Pratt H. L. Jr. (Eds.), Shark nursery grounds of the Gulf of Mexico and the East Coast Waters of the United States. American Fisheries Society Symposium 50. Bethesda, MD, pp. 301–316. [Google Scholar]
- Pettersen, A. K. , White, C. R. , & Marshall, D. J. (2015). Why does offspring size affect performance? Integrating metabolic scaling with life‐history theory. Proceedings of the Royal Society B, 282, 20151946. 10.1098/rspb.2015.1946 [DOI] [PMC free article] [PubMed] [Google Scholar]
- Plard, F. , Gaillard, J.‐M. , Coulson, T. , Hewison, A. J. M. , Delorme, D. , Warnant, C. , & Bonenfant, C. (2014). Mismatch between birth date and vegetation phenology slows the demography of roe deer. PLoS Biology, 12, e1001828. 10.1371/journal.pbio.1001828 [DOI] [PMC free article] [PubMed] [Google Scholar]
- Plumlee, J. D. , Dance, K. M. , Matich, P. , Mohan, J. A. , Richards, T. M. , TinHan, T. C. , Fisher, M. R. , & Wells, R. J. D. (2018). Community structure of elasmobranchs in estuaries along the northwest Gulf of Mexico. Estuarine, Coastal and Shelf Sciences, 204, 103–113. 10.1016/j.ecss.2018.02.023 [DOI] [Google Scholar]
- Reyier, E. A. , Franks, B. R. , Chapman, D. D. , Scheidt, D. M. , Stolen, E. D. , & Gruber, S. H. (2014). Regional‐scale migrations and habitat use of juvenile lemon sharks (Negaprion brevirostris) in the US South Atlantic. PLoS One, 9, e88470. 10.1371/journal.pone.0088470 [DOI] [PMC free article] [PubMed] [Google Scholar]
- Roff, D. A. (1992). The evolution of life histories: Theory and analysis. Chapman & Hall. [Google Scholar]
- Romine, J. G. , Musick, J. A. , & Johnson, R. A. (2013) Compensatory growth of the sandbar shark in the western North Atlantic including the Gulf of Mexico. Marine and Coastal Fisheries, 5, 189–199. [Google Scholar]
- Rosa, R. , Baptista, M. , Lopes, V. M. , Rita Pegado, M. R. , Ricardo Paula, J. R. , Trübenbach, K. , Coasta Leal, M. , Calado, R. , & Repolho, T. (2014). Early‐life exposure to climate change impairs tropical shark survival. Proceedings of the Royal Society B, 281, 20141738. 10.1098/rspb.2014.1738 [DOI] [PMC free article] [PubMed] [Google Scholar]
- Scharer, R. M. , Stevens, P. W. , Shea, C. P. , & Poulakis, G. R. (2017). All nurseries are not create equal: Large‐scale habitat use patterns in two smalltooth sawfish nurseries. Endangered Species Research, 34, 473–492. [Google Scholar]
- Schlaff, A. M. , Heupel, M. R. , & Simpfendorfer, C. A. (2014). Influence of environmental factors on shark and ray movement, behavior and habitat use. Review in Fish Biology and Fisheries, 24, 1089–1103. [Google Scholar]
- Scranton, K. , & Amarasekare, P. (2017). Predicting phenological shifts in a changing climate. Proceedings of the National Academy of Sciences, 114, 13212–13217. 10.1073/pnas.1711221114 [DOI] [PMC free article] [PubMed] [Google Scholar]
- Sen, S. , Chakraborty, S. K. , Elayaperumal, V. , Zacharia, P. U. , Jaiswar, A. K. , Dash, G. , Kizhakudan, S. J. , Bharadiya, S. A. , & Gohel, J. K. (2018). Reproductive strategy of milk shark, Rhizoprionodon acutus (Ruppell 1837), along north‐eastern Arabian Sea. Ichthyological Research, 65, 324–333. 10.1007/s10228-018-0627-6 [DOI] [Google Scholar]
- Siddon, E. C. , Kristiansen, T. , Mueter, F. J. , Holsman, K. K. , Heintz, R. A. , & Farley, E. V. (2013). Spatial match‐mismatch between juvenile fish and prey provides a mechanism for recruitment variability across contrasting climate conditions in the Eastern Bering Sea. PLoS One, 8, e84526. 10.1371/journal.pone.0084526 [DOI] [PMC free article] [PubMed] [Google Scholar]
- Sminkey, T. R. , & Musick, J. A. (1995) Age and growth of the sandbar shark, Carcharhinus plumbeus, before and after populationdepletion. Copeia, 1995, 871‐883. [Google Scholar]
- Sosebee, K. A. (2005) Are density‐dependent effects on elasmobranch maturity possible? Journal of Northwest Atlantic Fisheries Science, 35, 115‐124. [Google Scholar]
- Stearns, S. C. (1992). The evolution of life histories. Oxford University Press. [Google Scholar]
- Steiner, P. A. , Michel, M. , & O’Donnell, P. M. (2007). Notes on the occurrence and distribution of elasmobranchs in the Ten Thousand Islands estuary, Florida. In McCandless C. T., Kohler N. E., & Pratt H. L. Jr. (Eds.), Shark Nursery Grounds of the Gulf of Mexico and the East Coast Waters of the United States. American Fisheries Society Symposium 50. Bethesda, MD, pp. 237–250. [Google Scholar]
- Strickland, B. A. , Massie, J. A. , Viadero, N. , Santos, R. , Gastrich, K. R. , Paz, V. , O’Donnell, P. , Kroetz, A. , Ho, D. T. , Rehage, J. S. , & Heithaus, M. R. (2019). Movements of juvenile bull sharks in response to a major hurricane within a tropical estuarine nursery area. Estuaries and Coasts, 43, 1144–1157. 10.1007/s12237-019-00600-7 [DOI] [Google Scholar]
- Sulikowski, J. A. , Wheeler, C. R. , Gallagher, A. J. , Prohaska, B. K. , Langan, J. A. , & Hammerschlag, N. (2016). Seasonal and life‐stage variation in the reproductive ecology of a marine apex predator, the tiger shark Galeocerdo cuvier, at a protected female‐dominated site. Aquatic Biology, 24, 175–184. 10.3354/ab00648 [DOI] [Google Scholar]
- Swift, D. G. , & Portnoy, D. S. (2021). Identification and delineation of essential habitat for elasmobranchs in estuaries on the Texas coast. Estuaries and Coasts, 44, 788–800. 10.1007/s12237-020-00797-y [DOI] [Google Scholar]
- TinHan, T. C. , O’Leary, S. J. , Portnoy, D. S. , Rooker, J. R. , Gelpi, C. G. , & Wells, R. J. D. (2020). Natural tags identify nursery origin of a coastal elasmobranch Carcharhinus leucas . Journal of Applied Ecology, 57, 1222–1232. [Google Scholar]
- Ulrich, G. F. , Jones, C. M. , Driggers, W. B. III , Drymon, J. M. , Oakley, D. , & Riley, C. (2007). Habitat utilization, relative abundance, and seasonality of sharks in the estuarine and nearshore waters of South Carolina. In McCandless C. T., Kohler N. E., & Pratt H. L. Jr. (Eds.), Shark Nursery Grounds of the Gulf of Mexico and the East Coast Waters of the United States. American Fisheries Society Symposium 50. Bethesda, MD, pp. 125–139. [Google Scholar]
- US EPA . (1999). Ecological condition of estuaries in the Gulf of Mexico. EPA 620‐R‐98–004. US Environmental Protection Agency, Office of Research and Development, National Health and Environmental Effects Research Laboratory, Gulf Ecology Division, Gulf Breeze, FL, USA. [Google Scholar]
- Visser, M. E. , & Both, C. (2005). Shifts in phenology due to global climate change: The need for a yardstick. Proceedings of the Royal Society B, 272, 2561–2569. 10.1098/rspb.2005.3356 [DOI] [PMC free article] [PubMed] [Google Scholar]
- Visser, M. E. , & Gienapp, P. (2019). Evolutionary and demographic consequences of phenological mismatches. Nature Ecology & Evolution, 3, 879–885. 10.1038/s41559-019-0880-8 [DOI] [PMC free article] [PubMed] [Google Scholar]
- Werner, E. E. , & Anholt, B. R. (1993). Ecological consequences of the trade‐off between growth and mortality rates mediated by foraging activity. The American Naturalist, 142, 242–272. 10.1086/285537 [DOI] [PubMed] [Google Scholar]
- Werner, E. E. , & Gilliam, J. F. (1984). The ontogenetic niche and species interactions in size‐structured populations. Annual Review of Ecology and Systematics, 15, 393–425. 10.1146/annurev.es.15.110184.002141 [DOI] [Google Scholar]
- Wilson, S. M. , Buehrens, T. W. , Fisher, J. L. , Wilson, K. L. , & Moore, J. W. (2021). Phenological mismatch, carryover effects, and marine survival in a wild steelhead trout Oncorhynchus mykiss population. Progress in Oceanography, 193, 102533. 10.1016/j.pocean.2021.102533 [DOI] [Google Scholar]
- Wood, S. N. (2006). Generalized additive models: an introduction with R. Chapman & Hall/CRC. 410 pp. [Google Scholar]
- Wood, S. N. (2017). Package ‘mgcv’. R package version, 1, 7‐29. [Google Scholar]
- Zhao, M. , Chrisitie, M. , Coleman, J. , Hassell, C. , Gosbell, K. , Lisovski, S. , Minton, C. , & Klaassen, M. (2018). Body size shapes inter‐specific migratory behavior: Evidence from individual tracks of long‐distance migratory shorebirds. Journal of Avian Biology, 49, e01570. [Google Scholar]
Associated Data
This section collects any data citations, data availability statements, or supplementary materials included in this article.
Supplementary Materials
Appendix S1
Data Availability Statement
Data are managed, archived, and made available by TPWD Coastal Fisheries (https://tpwd.texas.gov/about/administration‐divisions/coastal‐fisheries).