Abstract
The article presents the thermal and physical properties of PMMA composite films with the addition of Nb2O5 nanoparticles. The addition of nanoparticles to PMMA mainly influenced the optical transmission and glass transition temperature of composite films compared to pure PMMA. It is clearly visible in the results of the conducted ellipsometric and differential scanning calorimetry tests. X-ray studies showed that the heat treatment of the samples resulted in the ordering of the polymer structure (flattening of the polymer chains). Examining the surface of the samples with scanning electron microscopy, it can be seen that Nb2O5 nanoparticles formed unusual, branched formations resembling "snowflakes".
Subject terms: Chemical engineering, Materials chemistry, Organic chemistry, Physical chemistry, Polymer chemistry
Introduction
In recent years, polymer composites based on inorganic oxides have aroused increasing interest in such fields of science as materials science or related fields (physics and chemistry of materials). Polymer/inorganic oxide composites often exhibit different material properties compared to pure polymers. They often differ from pure polymers in their optical, thermal and electrical properties. One of the most studied and more frequently modified polymeric materials is polymethyl methacrylate (PMMA). This commonly used thermoplastic material has good tensile strength, hardness, high rigidity and optical transparency, and is a good electrical insulator. It is also widely used in practical applications including optics, telecommunications, and even in the production of various general-purpose products. There are many works on PMMA applications in the literature, for example see reviews from the last few years1–7. Due to such favorable properties of PMMA, this material is also often subjected to various modifications. In the literature, it can be find many examples of PMMA modification with the use of nanoparticles and nanowires, including TiO28–11, Ag12–14, ZnO15–18 and their mixtures, incl. the use of other types of nanoparticles19–22. In particular, these studies show that the addition of Al and TiO2 nanoparticles to the PMMA resin lowers the glass transition temperature of this material and increases its electrical conductivity11. The addition of nanoparticles can change the optical properties of PMMA, such as absorption. In the work of Deng et al.13 PMMA/Ag nanocomposites were studied. It was observed that the addition of Ag nanoparticles causes an increase in the nonlinear optical properties of the composite. Moreover, such composites are quite widely used in optical devices13. As the conductive ink, a PMMA/AgNW (nanowires) composite can be used, as shown by Martínez et al.14. The ink layers thus formed have a very low conductivity and can be widely used in soft lithography. At this point, PMMA/ZnO composites should also be mentioned. These photocatalytic composites are very stable. In the works of Di Mauro et al.15 PMMA/ZnO nanocomposites have been investigated as a modern photocatalyst used in water treatment. The results are presented on the example of the degradation of the dye methylene blue (MB) and phenol in aqueous solution under the influence of UV radiation. The composites retained their properties and were still stable after several decolorization processes. From these few examples it is clear that PMMA composites with nanoparticles or nanowires also have a wide range of applications.
The niobium pentoxide—Nb2O523–27 is an inorganic compound used as the main precursor of all materials made of niobium. It has a specialized application in devices such as capacitors. It is also used as a component of optical glasses. A characteristic feature of the layers of niobium oxide itself is optical transmittance in almost the entire spectral range (300–2500 nm). Atta et al.23 show how annealing affects the structural, optical and electrical properties of Nb2O5 layers. It turned out that in the range of temperatures up to 200 °C the transmission level, the values of the refractive index and absorption were stable.
Here, we have provided variable-temperature spectroscopic ellipsometry and differential scanning calorimetry studies of glass transition of PMMA/Nb2O5 composite films. There are some literature data, where PMMA Tg was determined using raw ellipsometric data, e.g. ellispometric angles—Ψ and Δ28–32. In the work of Erber et al.32 PMMA films, deposited onto Si/SiOx substrates were investigated. The glass transition temperature was determined using Ψ and Δ temperature relations, at λ = 450 nm wavelength. This example shows that Tg of pure PMMA is around 107 °C. Another example is work of Keddie et al.31, where Tg was determined using temperature derivative of ellipsometric angle delta, at λ = 232 nm wavelength. Similarly to work32, the glass transition temperature was around 107 °C. Here, we have also used raw ellipsometic data (the Ψ angle at λ = 900 nm wavelength) for determination of Tg of obtained films, like in our earlier works33–35.
The aim of the work was to prepare PMMA/Nb2O5 composite films, the transmission of which in the spectral range of UV radiation (250–380 nm) is clearly reduced. And also showing the differences in physical properties between PMMA and composite PMMA/Nb2O5 films depending on their composition. It seems that the addition of a small amount of nanoparticles resulted in different thermal, physical and morphological properties of the composite film. On the other hand, Nb2O5 nanoparticles in composite films formed branched structures resembling snowflakes on a microscopic scale.
Experimental
The materials we have used are poly(methyl methacrylate)—PMMA (molar mass 84,000 g/mol) and niobium pentoxide Nb2O5 (purity 99.9%). PMMA and Nb2O5 were supplied by Sigma-Aldrich. The chemical structures of these materials are shown in Fig. 1.
Figure 1.
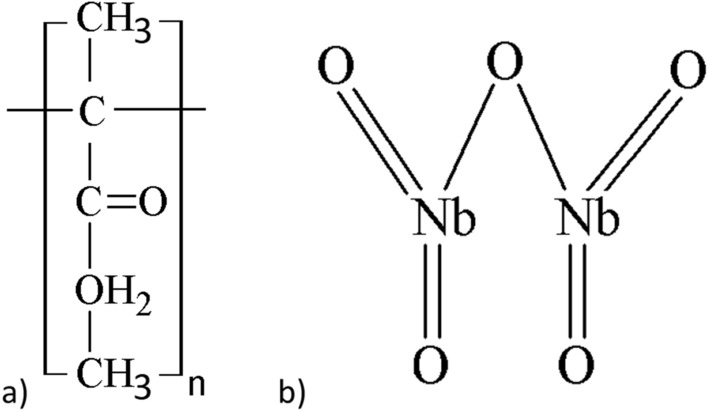
Chemical structures of PMMA (a) and Nb2O5 (b).
PMMA was dissolved in chloroform. The weight concentrations of all solutions were constant and equal to 20 mg/ml. The percentage content of Nb2O5 in relation to the PMMA and weight of individual contents are presented in Table 1.
Table 1.
Weight and concentration of individual chloroform/polymer/NPs solutions.
| NPs content (%) | 0 | 2.5 | 5 | 10 | 20 |
|---|---|---|---|---|---|
| PMMA weight (mg) | 20 | 19.5 | 19 | 18 | 16 |
| Nb2O5 Weight (mg) | 0 | 0.5 | 1 | 2 | 4 |
All solutions were homogenized at 16 kJ for 10 min using a Bandelin Sonoplus homogenizer. From these solutions, films of PMMA and PMMA/Nb2O5 composites were casted onto silicon substrates (coated with 400 nm thick SiO2 layers) and onto opaque and quartz substrates. Samples were annealed at 180 °C, for 5 min. All measurements, with exception of temperature-dependent ellipsometry and DSC were taken before and after annealing.
The films intended for ellipsometric measurements were annealed at the beginning of the procedure of the glass transition temperature determination, what is described in further part of this section.
All prepared films were stored in a dry laboratory box at room temperature. The dry box, with a rubber gasket, was half filled with hygroscopic gel and closed under nitrogen atmosphere, in a glove box.
The ellipsometric measurements were made using the SENTECH SE850E spectroscopic ellipsometer, which operates in the spectral range of 240–2500 nm and works under the control of the Spectra Ray 3 software. The device operates in three modes: transmission mode (using a special sample holder), variable angle mode (using a standard automatic table) and variable temperature mode (using a variable temperature cell operating at reduced pressures and under temperature controller INSTEC mK1000). The measurements in transmission mode were performed in all UV–Vis/NIR spectral range. The measurements of ellipsometric angles Ψ and Δ were performed for incidence angle 40°–70° range with the 5° step. The variable temperature measurements were provided in accordance with the protocol described in our previous works33–35. Every, individual samples were heated at 180 °C, during 5 min, under pressure (to 10−1 Tor). Next, the films were quickly cooled to − 20 °C during 3 min time. The temperature has been set by the temperature controller using a liquid nitrogen pump and electric heater. The transmission mode was used for optical transmission measurement, the variable angle mode for thickness determination and variable-temperature mode for Tg determination.
The glass transition temperatures of samples were also determined using a DSC Q2000 apparatus (TA Instruments, Newcastle, DE, USA), with aluminium sample pans. Thermal characteristics of the samples were obtained under nitrogen atmosphere (gas flow 50 mL/min). The instrument was calibrated with high-purity indium standards. DSC measurements have been performed on powder materials obtained from very thick films (about 2 μm), which were removed from glass substrates. All films, intended for DSC measurements were annealed earlier36.
X-Ray diffraction studies were performed using the D8 Advance diffractometer (Bruker, Karlsruhe, Germany) with Cu-Kα cathode (λ = 1.54 Å). Due to relatively high layer thickness of sample (~ 1000 nm), for 2D-WAXS setup the classic Bragg–Brentano geometry measurement was applied. The scan rate was 1.2°/min with scanning step 0.02° in range of 2° to 60° 2Θ (dwell time 1 s). Measurements were taken in 2 variations, using different φ (Phi) angle, what corresponds to sample rotation. As a φ = 0°, longer edge was set as parallel to X-Ray beam direction. Resulting φ rotation (90°) were programmed with resolution of 0.1° φ. Obtained 2D patterns (with width of 3° 2θ) for different φ angle were integrated to 1D patterns. Background subtraction, occurring from air scattering, were performed using DIFFRAC.EVA program36. All WAXD (XRD) measurements acquired at different Phi angle were accumulated to obtain representative pattern. The Nb2O5 parameters, determined using X-ray diffraction are shown in Table 2.
Table 2.
Nb2O5 parameters determined using X-ray diffraction.
| Powder | Space group | Lattice parameters, ICDD, Å | Lattice parameters, calculated, Å | Crystallite size, nm | Lattice strain, % |
|---|---|---|---|---|---|
|
Nb2O5 (00–027-1003) |
Pbam |
a = 6.168, b = 29.312, c = 3.936 |
a = 6.17, b = 29.31, c = 3.93 |
65 ± 3 | − 0.42 ± 0.03 |
SEM images were obtained using the Zeiss Supra 35 scanning electron microscope, which accelerating voltage is in 2–4 kV range, work distance in 3–3.5 range. The images were collected using InLens mode (for flat and nanometric samples).
The molar mass was determined using Gel permeation chromatography with multiangle laser light scattering detection (GPC-MALLS). Analysis was performed in THF at 35 °C with a nominal flow rate of 1 mL/min. A column set containing SDV columns from Polymer Standards Service (PSS, Mainz, Germany): guard + 100 Å + 500 Å + 1000 Å + 100,000 Å was used. A differential refractive index detector (Δn-2010 RI WGE Dr. Bures, Berlin, Germany) and a multiangle laser light scattering detector (DAWN HELEOS from Wyatt Technologies, Santa Barbara, USA) were used in the system. The results were evaluated with ASTRA 5 software (Wyatt Technologies, Santa Barbara, USA).
Results and discussion
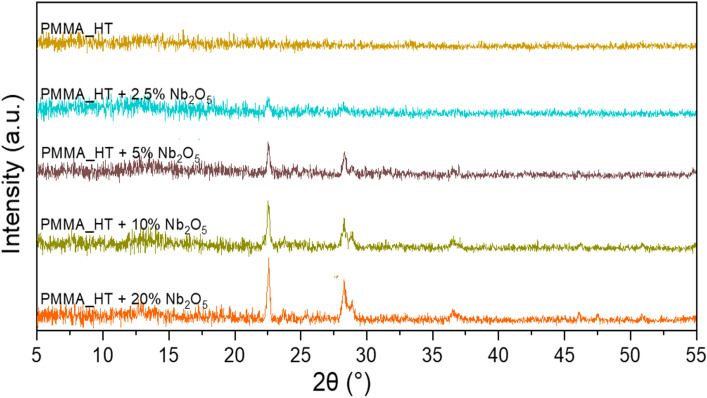
The X-ray diffraction patterns performed on annealed films deposited onto Si substrates are shown in Fig. 2. The diffraction patterns of no-annealed films are show in supplementary materials in Fig. 1s. The diffraction pattern of Nb2O5 nanoparticles powder has been added in supplementary also. The pure PMMA spectrum is shown in yellow colour, as the upper curve in the figure. The next curves come from samples with the addition of Nb2O5. The "HT" curves represent the films subjected to a temperature of 180 °C. The spectrum of pure PMMA is completely free of peaks in opposite to spectrum of no-annealed film (in supplementary), where only amorphous background is visible. This means that the polymer chains have flattened and the entire structure of the film has become more orderly. The same effect has been observed in spectra of the remaining, annealed samples, where only peaks originating from Nb2O5 are visible. It can also be noticed that the spectra of the samples with a higher Nb2O5 content have a higher intensity of these peaks and a larger number of them, which is consistent with the preparation of the obtained films.
Figure 2.
XRD patterns of PMMA films with increasing content of Nb2O5.
The transmission spectra of annealed, pure PMMA and PMMA/Nb2O5 composites films deposited onto quartz substrates are shown in Fig. 3. The transmission intensities of pure PMMA before annealing (see Fig. 3s in supplementary) and after thermal treatment are about 92%. The change in the shape of the spectrum in the UV range after annealing suggests the ordering of the polymer structure. A similar effect was observed for the annealed layers of PMMA/Nb2O5 composites. It has been observed that a higher percentage of nanoparticles causes a decrease of light transmission in the UV range. In the remaining range, the permeability remains at the level of 60%, even in case of the maximum of nanoparticles content.
Figure 3.
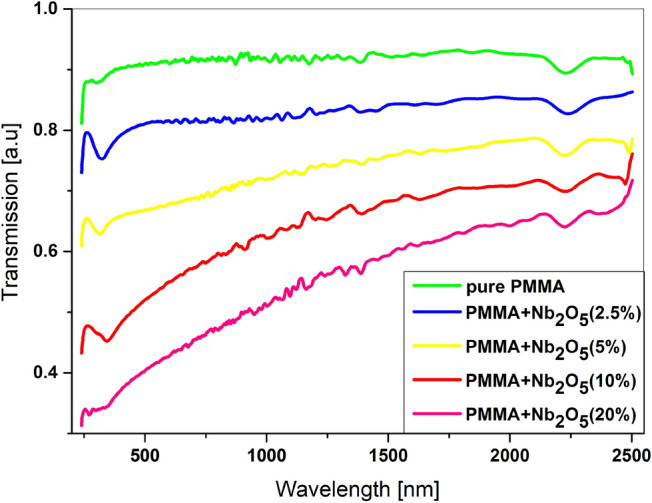
Transmission of pure PMMA and PMMA/Nb2O5 films.
In Fig. 4, the thickness of pure PMMA as a function of temperature is presented. It can be readily observed from Fig. 4, that the value of thickness is increasing with temperature and the glass transition is around 102 °C. The mean square error (MSE) of this fitting was around 0.195. Dependence of thickness on temperature was determined ellipsometrically. The ellipsometric angles spectra of investigated samples were fitted with Cauchy optical model in 830–930 nm wavelength range, similarly, like in our earlier works33–35. The Cauchy optical model parametrizes the dependence of the refractive index n and the absorption (extinction) coefficient k on the wavelength λ and is described by following relation:
where C0 and C1 are numerical constants, k and n are already mentioned coefficients.
Figure 4.
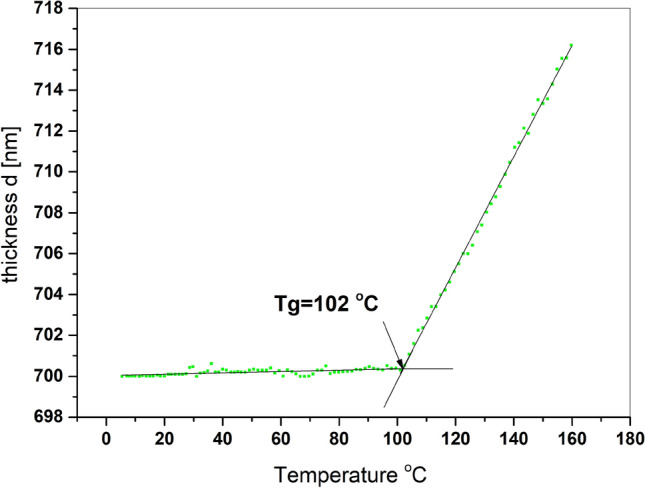
Thickness of pure PMMA as temperature function.
The ellipsometrically determined thicknesses of samples deposited on silicon substrates are presented in Table 3.
Table 3.
Thickness of films, deposited on different substrates.
| NPs content (%) | 0 | 2.5 | 5 | 10 | 20 |
|---|---|---|---|---|---|
| Thickness d (nm) of films onto silicon substrates for XRD | 703 | 727 | 669 | 693 | 650 |
| Films on silicon substrates for ellispometry | 844 | 523 | 651 | 835 | 842 |
| Films on quartz substrates for transmission | 384 | 420 | 430 | 443 | 450 |
The correlations between temperature dependences of thickness and ellipsometric angles were presented in earlier works33–35. The raw ellipsometric data are used for glass transition determination quite frequently, what can be found in literature37–45.
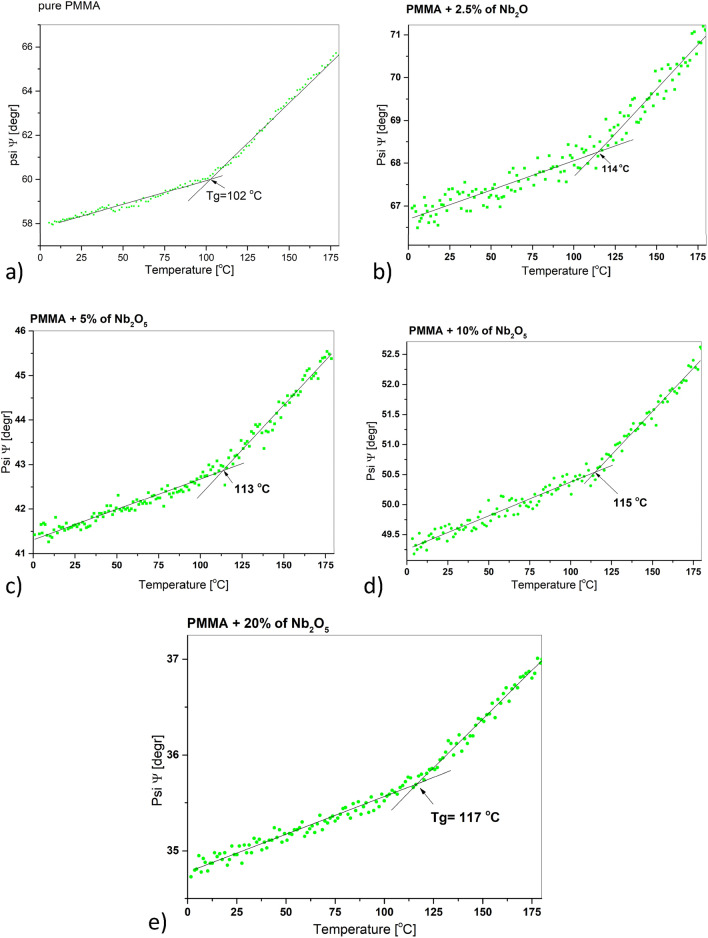
Here, we have chosen the Ψ at λ = 900 nm wavelength. The reason for choosing this wavelength is the lack of distinct absorption bands in this range, and the limited spectral range in temperature measurement. The spectra were collected only in the range of 240–930 nm due to the time scale of the measurement (15 s), the measurement frequency (one measurement every 10 s) and the heating rate (2 °C/min). Measurement in the entire spectral range takes at least 2 min and therefore it is not reliable in variable temperature measurements carried out in-situ. In Fig. 5, the Ψ angle as a function of the temperature is shown for the pure PMMA and PMMA/Nb2O5 composite films. The glass transition of pure PMMA is equal to 102 °C, while the glass transition of all composite films is higher on average by 10 °C. The glass transition of PMMA/Nb2O5 with 2.5% concentration, is around 114 °C. Glass transition temperatures of successive of composite films, with concentrations of 5, 10 and 20% are around 113, 115 and 117 °C. The linear fittings for presented curves were performed using the least squares method. The fitting parameters, including standard deviation errors, are attached to supplementary materials in point 4 (Figs. 9–14s and Table 1s).
Figure 5.
Ellipsometric angle Ψ at 900 nm as a function of temperature for: (a) pure PMMA, (b) PMMA/Nb2O5 (2.5%), (c) PMMA/Nb2O5 (5%), (d) PMMA/Nb2O5 (10%), (e) PMMA/Nb2O5 (20%).
It can be easy seen that dispersion of collected points is slightly larger for Ψ(T) relation in PMMA/Nb2O5 (2.5%). This is result of thickness effect, which has been already described in literature46.
Along with the increase of the Nb2O5 nanoparticles concentration in the composite, there is a slight upward trend in the film glass transition temperature.
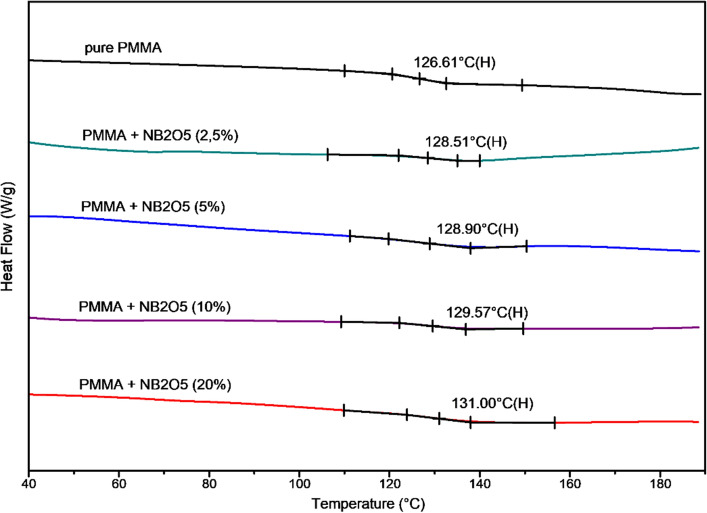
The obtained dependence is fully consistent with the results of the DSC measurement, which are shown in Fig. 6. We have performed DSC studies on materials, removed from opaque glass substrates (the samples were annealed at 180 °C at first). The calorimetric measurements Nb2O5 were performed with constant heating rate of 20 °C/min. As in the case of the ellipsometric results, a slight increase in the glass transition temperature of the composite can be noticed along with the increasing concentration of Nb2O5. The glass transition of pure PMMA is around 126 °C, while the glass transition temperatures of samples with concentrations of 2.5, 5, 10 and 20% nanoparticles are around 128.5, 128.9, 129.6 and 131 °C, respectively. The difference between values obtained from ellipsometry and from DSC results from the heating rate, which was 2 °C/min and 20 °C/min respectively. The difference also results from the form of materials.
Figure 6.
DSC plots, with a heating rate of 20 °C/min, for pure PMMA, and PMMA/Nb2O5 (2.5, 5, 10, and 20%).
Figures 7, 8, 9, 11 and 12 show the images performed using scanning electron microscope. The surface of pure PMMA annealed film is shown in Fig. 7 and the surface of no-annealed one is presented in supporting materials (Fig. 15s).
Figure 7.
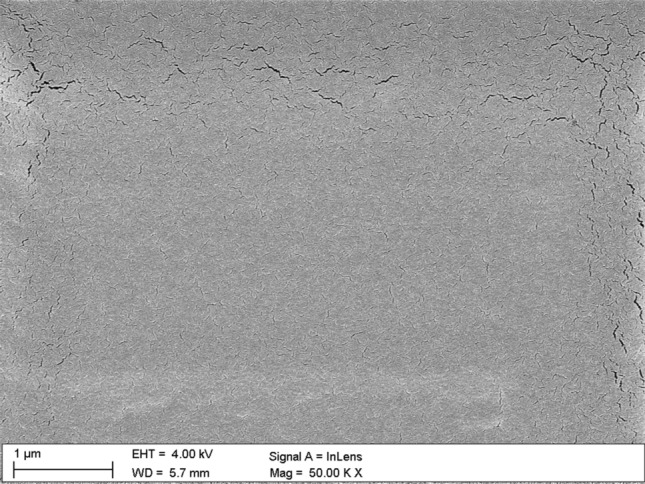
Surface of PMMA film.
Figure 8.
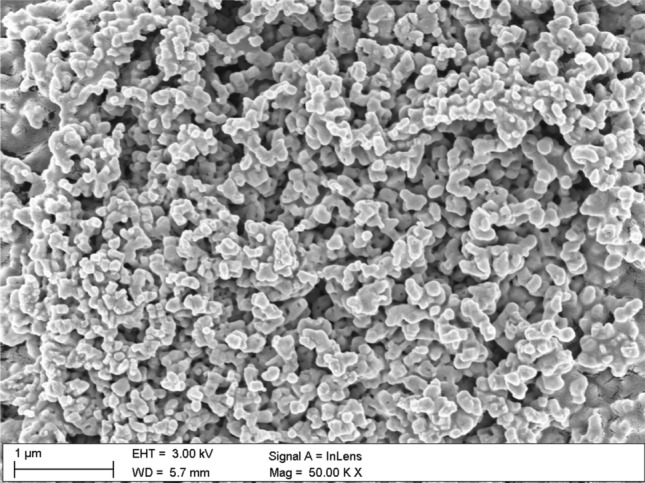
The Nb2O5 nanoparticles clusters in PMMA film.
Figure 9.
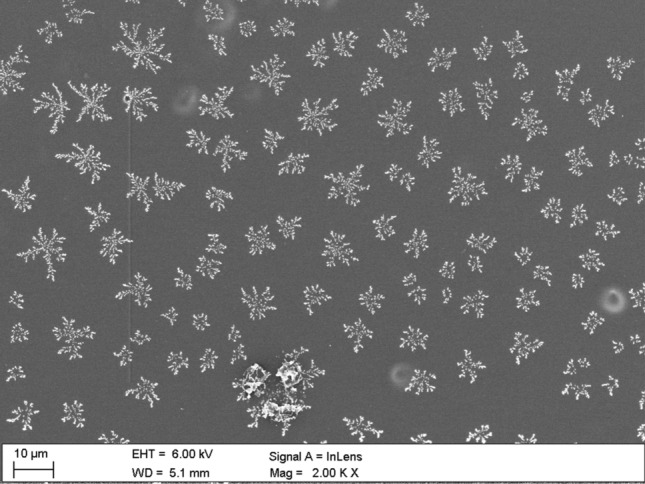
The morphology of PMMA/Nb2O5 composite film in macroscopic scale.
Figure 11.
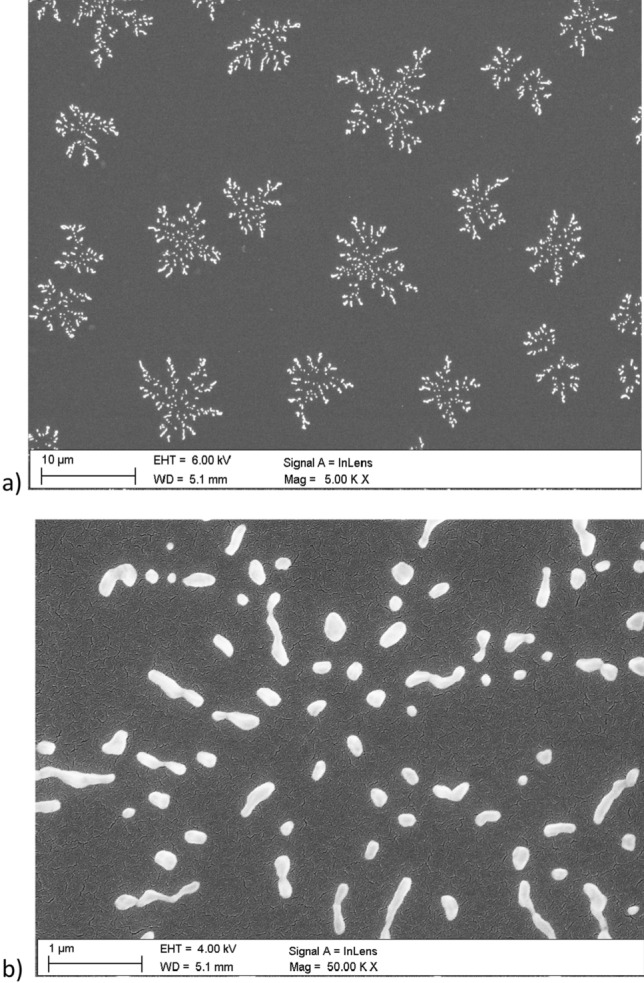
The Nb2O5 “snowflakes” in surface of PMMA/ Nb2O5 composite film with 2.5% nanoparticles content (a). The single “snowflake” (b).
Figure 12.
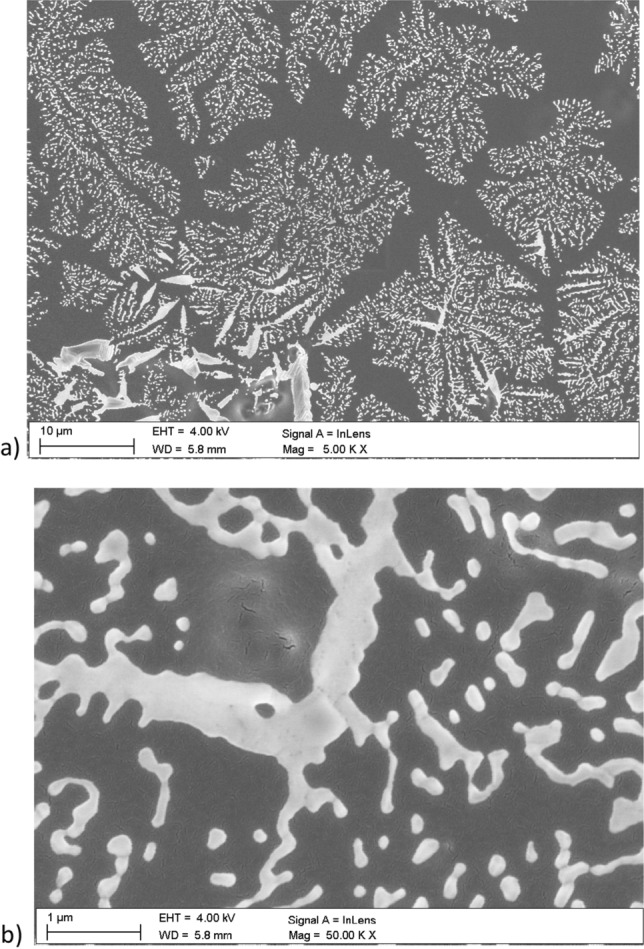
The Nb2O5 “snowflakes” in surface of PMMA/Nb2O5 composite film with 10% nanoparticles content (a). The fragment of “snowflakes” (b).
The example cluster of Nb2O5 nanoparticles, after annealing, magnified 50.000 times, is shown in Fig. 8, the no-annealed one is attached in supporting materials (Fig. 16s).
Surface of the annealed PMMA polymer films seems to be slightly cracked in relation to the no-annealed one. These visible "microcracks" are the result of local burning out of the polymer surface by an electron beam. The melting point of the used PMMA is about 180 °C and all the films were annealed to this characteristic temperature value. The melting point of Nb2O5 nanoparticles is at about 1512 °C. Therefore, the annealing temperature of composite films did not affected the formations of nanoparticles in composite films. An examples of Nb2O5 crystallization forms can be found in the literature e.g.47–52. The Nb2O5 formations can appear in spheroidal form, the so-called hollow spheres47–49. A good example is the work of Kong et al.47, where hollow spheres were created by a hydrothermal method, in a few steps. The first stage of post-treatment was calcination in air stream, at 600 °C, the second stage was heat treatment in nitrogen N2, at 800 °C, and the third stage was air oxidation at 300 °C. The diameter of obtained hollow spheres was around 500 nm to 3 µm. Another type of structures that can be formed by Nb2O5 nanoparticles are the so-called nanorods50, microcones51, and hexagrammoids52.
“Snowflakes”-shaped branched structures in Fig. 9 are presented in macroscopic scale. This formations are visible on the surface of the annealed PMMA/Nb2O5 composite film. We suppose these structures were created as a result of two processes—adhesive interactions between nanoparticles and rapid evaporation of the solvent. The adhesive effect is responsible for the formation of clusters of nanoparticles, presented in Figs. 18s–19s, in supplementary. The “snowflakes” are formed by nanoparticles aggregation during evaporation of chloroform and polymer congelation. Besides of branched structures formation, there are also typical nanoparticle clusters, which has been started to aggregate earlier, even before the solvent has been evaporated. There is no possibility to eliminate the clusters completely. The mechanisms of clusters and snowflakes formations are presented in Fig. 10a,b.
Figure 10.
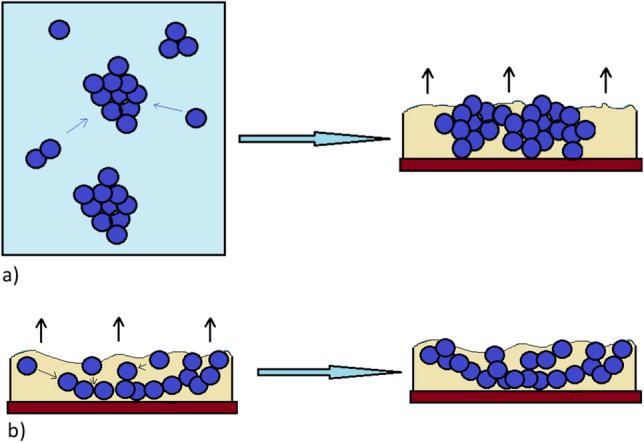
(a) Formation of clusters: the nanoparticles, which have aggregated in conglomerates in solution, are forming bigger clusters during casting the solution and evaporation of solvent. (b) Snowflake formation: individual nanoparticles and nanoparticles in small conglomerates aggregate during solvent evaporation.
The surface morphology is due to formation of snowflake-shaped nanoparticle clusters. Sometimes, evaporation of solvent from the layer is connected with coffe-ring effect53,54, but here the formation of snowflakes is rather close to nanoparticles branching effect, known in literature55,56.
Figures 11 and 12 present the surface of selected, annealed PMMA/Nb2O5 composite films. There is surface of PMMA/Nb2O5 composites with contain of 2.5%—Fig. 11a,b and 10% nanoparticles—Fig. 12a,b. The size of “snowflakes” structures, visible in Fig. 12a is in range 10–30 µm. It is a result of higher Nb2O5 weight concentration.
The branched structures strongly indicate the formation of a polymer/NPs composite, where Nb2O5 nanoparticles cross-linked into branched formations inside the investigated film. The "snowflakes", which are visible on the polymer surface are only the top of the cross-linked structures, inside the polymer.
Conclusions
In presented work, pure PMMA and PMMA/Nb2O5 composite films were investigated. Transmission, variable-angle and variable temperature spectroscopic ellipsometry, X-ray diffractometry, DSC and scanning electron microscopy were used for the analysis of the obtained samples. It was observed that the addition of a small amount of Nb2O5 nanoparticles causes the composite films to differ from pure PMMA in terms of optical and thermal properties, as well as clear changes in their morphology. Due to the higher concentration of nanoparticles, the optical transmission intensities of the investigated samples were lower, mainly in the UV wavelength region. The reduced transmission in this range means that the described composite may have potential use in optical devices. Annealing of the tested samples increased the ordering of the entire layer structure, which was confirmed by X-ray diffraction measurements. Additionally, the higher concentration of nanoparticles caused the Tg to shift towards higher temperature values. This was confirmed by elispometric and calorimetric tests. Snowflake-shaped branched structures visible on the surface of composite films were probably the result of two processes—rapid evaporation of the solvent and adhesion of nanoparticles, i.e. their aggregation. The process of the formation of branched structures requires the optimization of technological parameters, like time and energy of homogenization and is the basis for further research.
Supplementary Information
Acknowledgements
This work was supported by the National Science Centre of Poland, Grant No. 2016/23/B/ST8/02045.
Author contributions
B.H.: Conceptualization, Methodology, Investigation, Writing—original draft, Writing—review & editing, Visualization, H.B.: Supervision, Writing—review & editing, P.J.: Investigation, Writing—review & editing, H.J.: Investigation, M.G.: Investigation, T.T.: Supervision, Writing—review & editing.
Competing interests
The authors declare no competing interests.
Footnotes
Publisher's note
Springer Nature remains neutral with regard to jurisdictional claims in published maps and institutional affiliations.
Contributor Information
B. Hajduk, Email: bhajduk@cmpw-pan.edu.pl
P. Jarka, Email: pawel.jarka@polsl.pl
Supplementary Information
The online version contains supplementary material available at 10.1038/s41598-021-01282-7.
References
- 1.Hashim A, Abbas B. Recent review on poly-methyl methacrylate (PMMA)-polystyrene (PS) blend doped with nanoparticles for modern applications. Res. J. Agric. Biol. Sci. 2019;14(3):6–12. doi: 10.22587/rjabs.2019.14.3.2. [DOI] [Google Scholar]
- 2.Ali U, Juhanni K, Karim KJBtA, Buang NA. A review of the properties and applications of poly (methyl methacrylate) (PMMA) Polym. Rev. 2015;55(4):678–705. doi: 10.1080/15583724.2015.1031377. [DOI] [Google Scholar]
- 3.Albeladi HK, Al-Romaizan AN, Hussein M. Role of cross-linking process on the performance of PMMA. Int. J. Biosens. Bioelectron. 2017;3(3):279–284. doi: 10.15406/ijbsbe.2017.03.00065. [DOI] [Google Scholar]
- 4.Zafar MS. Prosthodontic applications of polymethyl methacrylate (PMMA): An update. Polymers. 2020;12/10:2299. doi: 10.3390/polym12102299. [DOI] [PMC free article] [PubMed] [Google Scholar]
- 5.Rahman F, Carbaugh DJ, Wright JT, Rajan P, Pandya SG, Kaya S. A review of polymethyl methacrylate (PMMA) as a versatile lithographic resist - With emphasis on UV exposure. Microelectron. Eng. 2020;224:111238. doi: 10.1016/j.mee.2020.111238. [DOI] [Google Scholar]
- 6.de Souza Leão R, Maior JRS, de Araújo Lemos CA, do Egito Vasconcelos BC, Montes MAJR, Pellizzer EP, Moraes SLD. Complications with PMMA compared with other materials used in cranioplasty: A systematic review and meta-analysis. Braz. Oral Res. 2018;32:e31. doi: 10.1590/1807-3107bor-2018.vol32.0031. [DOI] [PubMed] [Google Scholar]
- 7.Pawar E. A review article on acrylic PMMA. IOSR J. Mech. Civ. Eng. 2016;13(2):1–4. doi: 10.9790/1684-1302010104. [DOI] [Google Scholar]
- 8.Park BJ, Sung JH, Kim KS, Chin I, Choi HJ. Preparation and characterization of poly(methyl methacrylate) coated TiO2 nanoparticles. J. Macromol. Sci. Part B Phys. 2006;45(1):53–60. doi: 10.1080/00222340500407855. [DOI] [Google Scholar]
- 9.Matsuyama K, Mishima K. Preparation of poly(methyl methacrylate)–TiO2 nanoparticle composites by pseudo-dispersion polymerization of methyl methacrylate in supercritical CO2. J. Supercrit. Fluids. 2009;49(2):256–264. doi: 10.1016/j.supflu.2009.03.001. [DOI] [Google Scholar]
- 10.Kanth N, Xu W, Prasad U, Ravichandran D, Kannan AM, Song K. PMMA-TiO2 fibers for the photocatalytic dagradation of water pollutants. Nanomaterials. 2020;10:1279. doi: 10.3390/nano10071279. [DOI] [PMC free article] [PubMed] [Google Scholar]
- 11.Devikala S, Kamaraj P, Arthanareeswari M. AC conductivity studies of PMMA/TiO2 composites. Mater. Today Proc. 2018;5(2/3):8678–8682. doi: 10.1016/j.matpr.2017.12.293. [DOI] [Google Scholar]
- 12.Singho ND, Johan MR, Che Lah NA. Temperature-dependent properties of silver-poly (methylmethacrylate) nanocomposites synthesized by in-situ technique. Nanoscale Res. Lett. 2014;9:42. doi: 10.1186/1556-276X-9-42. [DOI] [PMC free article] [PubMed] [Google Scholar]
- 13.Deng, Y. et al. Nonlinear optical properties of Ag/PMMA nanocomposite polymer film. in 2006 International Symposium on Biophotonics, Nanophotonics and Metamaterials, Vol. 2006. 373-376. 10.1109/METAMAT.2006.334920 (IEEE, 2006).
- 14.Martínez ED, Lohr JH, Sirena M, Sánchez RD, Pastoriza H. Silver nanowires in poly(methyl methacrylate) as a conductive nanocomposite for microfabrication. Flex. Print. Electron. 2016;1(3):035003. doi: 10.1088/2058-8585/1/3/035003. [DOI] [Google Scholar]
- 15.Di Mauro A, Cantarella M, Nicotra G, Pellegrino G, Gulino A, Brundo MV, Privitera V, Impellizzeri G. Novel synthesis of ZnO/PMMA nanocomposites for photocatalytic applications. Sci. Rep. 2017;7:40895. doi: 10.1038/srep40895. [DOI] [PMC free article] [PubMed] [Google Scholar]
- 16.Cierech M, Wojnarowicz J, Szmigiel D, Bączkowski B, Grudniak AM, Wolska KI, Łojkowski W, Mierzwińska-Nastalska E. Preparation and characterization of ZnO-PMMA resin nanocomposites for denture bases. Acta Bioeng. Biomech. 2016;18(2):31–41. doi: 10.5277/ABB-00232-2014-04. [DOI] [PubMed] [Google Scholar]
- 17.Hammani S, Barhoum A, Bechelany M. Fabrication of PMMA/ZnO nanocomposite: Effect of high nanoparticles loading on the optical and thermal properties. J. Mater. Sci. 2018;53:1911–1921. doi: 10.1007/s10853-017-1654-9. [DOI] [Google Scholar]
- 18.Igamberdiev KhT, Yuldashev ShU, Cho HD, Kang TW, Rakhimova ShM, Akhmedov TKh. Study of the thermal conductivity of ZnO nanowires/PMMA composites. J. Korean Phys. Soc. 2012;60(10):1513–1516. doi: 10.3938/jkps.60.1513. [DOI] [Google Scholar]
- 19.Di Mauro A, Farrugia C, Abela S, Refalo P, Grech M, Falqui L, Nicotra G, Sfuncia G, Mio A, Buccheri MA, Rappazzo G, Brundo MV, Scalisi EM, Pecoraro R, Iaria C, Privitera V, Impellizzeri G. Ag/ZnO/PMMA nanocomposites for efficient water reuse. ACS Appl. Bio Mater. 2020;3(7):4417–4426. doi: 10.1021/acsabm.0c00409. [DOI] [PubMed] [Google Scholar]
- 20.Viorica GP, Musat V, Pimentel A, Calmeiro TR, Carlos E, Baroiu L, Martins R, Fortunato E. Hybrid (Ag)ZnO/Cs/PMMA nanocomposite thin films. J. Alloys Comp. 2019;803:922–933. doi: 10.1016/j.jallcom.2019.06.373. [DOI] [Google Scholar]
- 21.Vallabhapurapu S, Varma Sangani LD, Ghanashyam Krishna M, Das J, Tu C, Du S, Srinivasan A. Resistive switching behaviour in PMMA/Al:ZnO composite films. Acta Phys. Pol. 2018;134(1):68–70. doi: 10.12693/APhysPolA.134.68. [DOI] [Google Scholar]
- 22.Mathur V, Dixit M, Ratthore KS, Saxena NS, Sharma KB. Morphological and mechanical characterization of a PMMA/CdS nanocomposite. Front. Chem. Sci. Eng. 2011;5:258–263. doi: 10.1007/s11705-010-1014-7. [DOI] [Google Scholar]
- 23.Atta AA, El-Nahass MM, Hassanien AM, Elsabawy KM, Abd El-Raheem MM, Alhuthali A, Alomariy SE, Algamdi MS. Effect of thermal annealing on structural, optical and electrical properties of transparent Nb2O5 thin films. Mater. Today Commun. 2017;13:112–118. doi: 10.1016/j.mtcomm.2017.09.004. [DOI] [Google Scholar]
- 24.Çetinörgü-Goldenberg E, Klemberg-Sapieha J-E, Martinu L. Effect of postdeposition annealing on the structure, composition, and the mechanical and optical characteristics of niobium and tantalum oxide films. Appl. Opt. 2012;51(27):6498–6507. doi: 10.1364/AO.51.006498. [DOI] [PubMed] [Google Scholar]
- 25.Mjejri I, Grocassan R, Rougier A. Enhanced coloration for hybrid niobium-based electrochromic devices. ACS Appl. Energy Mater. 2018;1:4359–4366. doi: 10.1021/acsaem.8b00967. [DOI] [Google Scholar]
- 26.Grobelny M, Kalisz M, Mazur M, Wojcieszak D, Kaczmarek D, Domaradzki J, Świniarski M, Mazur P. unctional Nb2O5 film and Nb2O5 + CuO, Nb2O5 + graphene, Nb2O5 + CuO + graphene composite films to modify the properties of Ti6Al4V titanium alloy. Thin Solid Films. 2016;616:64–72. doi: 10.1016/j.tsf.2016.07.049. [DOI] [Google Scholar]
- 27.Boucher R, Morgenroth W, Roth H, Meyer HG, Liguda C, Eich M. Etching of submicron holes in SiO2, Ta2O5, and Nb2O5. J. Vacuum Sci. Technol. B. 2004;22(2):519–522. doi: 10.1116/1.1648068. [DOI] [Google Scholar]
- 28.El-Nasser HM. Morphology and spectroscopic ellipsometry of PMMA thin films. Appl. Phys. Res. 2017;9(2):5–11. doi: 10.5539/apr.v9n2p5. [DOI] [Google Scholar]
- 29.El Ouakili A, Vignaud G, Balnois E, Bardeau J-F, Grohens Y. Glass transition temperatures of isotactic poly(methymethacrylate) thin films and individual chains probed by multi wavelength ellipsometry. Eur. Phys. J. Appl. Phys. EDP Sci. 2011;56(1):13703. doi: 10.1051/epjap/2010100221. [DOI] [Google Scholar]
- 30.Chen J, Li J, Xu L, Hong W, Yang Y, Chen X. The glass-transition temperature of supported PMMA thin films with hydrogen bond/plasmonic interface. Polymers. 2019;11:601. doi: 10.3390/polym11040601. [DOI] [PMC free article] [PubMed] [Google Scholar]
- 31.Keddie JL, Jones RAL, Cory RA. Interface and surface effects on the glass-transition temperature in thin polymer films. Faraday Discuss. 1994;98:219–230. doi: 10.1039/FD9949800219. [DOI] [Google Scholar]
- 32.Erber M, Tress M, Mapesa EU, Serghei A, Eichhorn K-J, Voit B, Kremer F. Glassy dynamics and glass transition in thin polymer layers of PMMA deposited on different substrates. Macromolecules. 2010;43(18):7729–7733. doi: 10.1021/ma100912r. [DOI] [Google Scholar]
- 33.Hajduk B, Bednarski H, Jarząbek B, Nitschke P, Janeczek H. Phase diagram of P3HT:PC70BM thin films based on variable-temperature spectroscopic ellipsometry. Polym. Testing. 2020;84:106383. doi: 10.1016/j.polymertesting.2020.106383. [DOI] [Google Scholar]
- 34.Hajduk B, Bednarski H, Jarząbek B, Janeczek H, Nitschke P. P3HT:PCBM blend films phase diagram on the base of variable-temperature spectroscopic ellipsometry. Beilstein J. Nanotechnol. 2018;9:1108–1115. doi: 10.3762/bjnano.9.102. [DOI] [PMC free article] [PubMed] [Google Scholar]
- 35.Hajduk B, Bednarski H, Domański M, Jarząbek B, Trzebicka B. Thermal transitions in P3HT:PC60BM films based on electrical resistance measurements. Polymers. 2020;12(7):1458. doi: 10.3390/polym12071458. [DOI] [PMC free article] [PubMed] [Google Scholar]
- 36.Nitschke P, Jarząbek B, Vasylieva M, Godzierz M, Janeczek H, Musioł M, Domiński A. The effect of alkyl substitution of novel imines on their supramolecular organization, towards photovoltaic applications. Polymers. 2021;13(7):1043. doi: 10.3390/polym13071043. [DOI] [PMC free article] [PubMed] [Google Scholar]
- 37.Fakhraai Z, Forrest JA. Probing slow dynamics in supported thin polymer films. Phys. Rev. Lett. 2005;95(2):025701. doi: 10.1103/PhysRevLett.95.025701. [DOI] [PubMed] [Google Scholar]
- 38.Clough A, Peng D, Yang Z, Tsui OKC. Glass transition temperature of polymer films that slip. Macromolecules. 2011;44:1649–1653. doi: 10.1021/ma102918s. [DOI] [Google Scholar]
- 39.Wang T, Pearson AJ, Dunbar ADF, Staniec PA, Watters DC, Coles D, Yi H, Iraqi A, Lidzey DG, Jones RAL. Competition between substrate-mediated π-π stacking and surface-mediated Tg depression in ultrathin conjugated polymer films. Eur. Phys. J. E. 2012;35:129. doi: 10.1140/epje/i2012-12129-3. [DOI] [PubMed] [Google Scholar]
- 40.Kim JH, Jang J, Zin W-C. Estimation of the thickness dependence of the glass transition temperature in various thin polymer films. Langmuir. 2000;16(9):4064–4067. doi: 10.1021/la991618t. [DOI] [Google Scholar]
- 41.El Ouakili A, Vignaud G, Balnois E, Bardeau J-F, Grohens Y. Multiple glass transition temperatures of polymer thin films as probed by multi-wavelength ellipsometry. Thin Solid Films. 2011;519(6):2031–2036. doi: 10.1016/j.tsf.2010.10.015. [DOI] [Google Scholar]
- 42.Chandran S, Basu JK. Effect of nanoparticle dispersion on glass transition in thin films of polymer nanocomposites. Eur. Phys. J. E. 2011;34:99. doi: 10.1140/epje/i2011-11099-2. [DOI] [PubMed] [Google Scholar]
- 43.Geng K, Tsui OKC. Effects of polymer tacticity and molecular weight on the glass transition temperature of poly(methyl methacrylate) films on silica. Macromolecules. 2016;49(7):2671–2678. doi: 10.1021/acs.macromol.6b00108. [DOI] [Google Scholar]
- 44.Alonso MI, Campoy-Quiles M. Conjugated polymers: Relationship between morphology and optical properties. In: Hinrichs K, Eichhorn K-J, editors. Ellipsometry of Functional Organic Surfaces and Films. Springer Series in Surface Sciences 52. 2. Springer; 2018. pp. 109–114. [Google Scholar]
- 45.Xu J, Liu Z, Lan Y, Zuo B, Wang X, Yang J, Zhang W, Hu W. Mobility gradient of poly(ethylene terephthalate) chains near a substrate scaled by the thickness of the adsorbed layer. Macromolecules. 2017;50(17):6804–6812. doi: 10.1021/acs.macromol.7b00922. [DOI] [Google Scholar]
- 46.Kawana S, Jones RAL. Character of the glass transition in thin supported polymer films. Phys. Rev. E. 2001;63:021501. doi: 10.1103/PhysRevE.63.021501. [DOI] [PubMed] [Google Scholar]
- 47.Kong L, Zhang C, Wang J, Qiao W, Ling L, Long D. Nanoarchitectured Nb2O5 hollow, Nb2O5@carbon and Nb2O5@carbon core-shell microspheres for ultrahigh-rate intercalation pseudocapacitors. Sci. Rep. 2016;6:21177. doi: 10.1038/srep21177. [DOI] [PMC free article] [PubMed] [Google Scholar]
- 48.Skrodczky K, Antunes MM, Han X, Santangelo S, Scholz G, Valente AA, Pinna N, Russo PA. Niobium pentoxide nanomaterials with distorted structures as efficient acid catalysts. Commun. Chem. 2019;2:129. doi: 10.1038/s42004-019-0231-3. [DOI] [Google Scholar]
- 49.Kim K, Hwang J, Seo H, Kim H-S, Kim J-H. Surface-controlled Nb2O5 nanoparticle networks or fast Li transport and storage. J. Mater. Sci. 2019;54:2493–2500. doi: 10.1007/s10853-018-3010-0. [DOI] [Google Scholar]
- 50.Liu J, Xue D, Li K. Single-crystalline nanoporous Nb2O5 nanotubes. Nanoscale Res. Lett. 2011;6:138. doi: 10.1186/1556-276X-6-138. [DOI] [PMC free article] [PubMed] [Google Scholar]
- 51.Karlinsey RL, Hara AT, Yi K, Duhn CW. Bioactivity of novel self-assembled crystalline Nb2O5 microstructures in simulated and human salivas. Biomed. Mater. 2006;1:16–23. doi: 10.1088/1748-6041/1/1/003. [DOI] [PubMed] [Google Scholar]
- 52.Wu J, Xue D. Localized crystallization: A chemical transformation of Nb2O5 rod-like arrays into ordered niobate arrays. CrystEngComm. 2011;13:1966–1975. doi: 10.1039/c0ce00449a. [DOI] [Google Scholar]
- 53.Larson RG. Twenty years of drying droplets. Nature. 2017;550:466–467. doi: 10.1038/550466a. [DOI] [PubMed] [Google Scholar]
- 54.Larson RG, Lopez MA, Lim DW, Lahann J. Complex protein patterns in drying droplets. MRS Proc. 2010;1273:1273-MM03-01. doi: 10.1557/PROC-1273-MM03-01. [DOI] [Google Scholar]
- 55.Raja SN, Olson ACK, Limaye A, Thorkelsson K, Luong A, Lin L, Ritchie RO, Xu T, Alivisatos AP. Influence of three-dimensional nanoparticle branching on the Young’s modulus of nanocomposites: Effect of interface orientation. Proc. Natl. Acad. Sci. U.S.A. 2015;112(21):6533–6538. doi: 10.1073/pnas.1421644112. [DOI] [PMC free article] [PubMed] [Google Scholar]
- 56.AbuTalib NH, LaGrow AP, Besenhard MO, Bondarchuk O, Sergides A, Famiani S, Ferreira LP, Cruz MM, Gavriilidis A, Thanh NTK. Shape controlled iron oxide nanoparticles: inducing branching and controlling particle crystallinity. CrystEngComm. 2021;23:550–561. doi: 10.1039/D0CE01291B. [DOI] [Google Scholar]
Associated Data
This section collects any data citations, data availability statements, or supplementary materials included in this article.


