Correction to: GeroScience (2021) 43:1265–1281
https://doi.org/10.1007/s11357-021-00369-3
The original version of this article unfortunately contained a mistake.
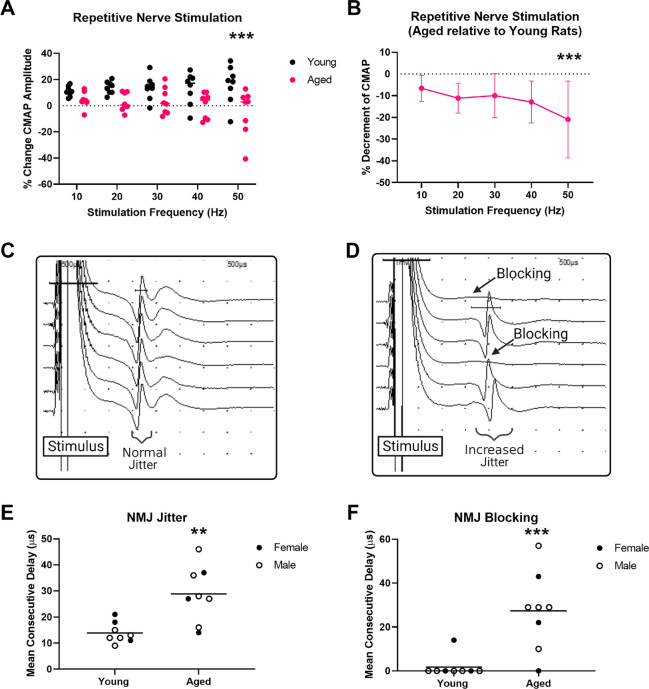
The Figure 1 image and legend were published erroneously.
Fig. 1.
Aged rats demonstrate significant deficits in neuromuscular junction transmission a-b. Repetitive nerve stimulation demonstrated significant reduction of compound muscle action potential (CMAP) amplitudes in aged versus young rats during trains of 10 stimuli delivered at 10, 20, 30, 40, and 50 Hz. (a: absolute in aged and young rats. b. aged shown relative to young). (Repeat measure two-way ANOVA: frequency: p = 0.6070, age: p = 0.0099, interaction: age X frequency: p = 0.0695; Sidak’s multiple comparisons demonstrates significantly reduced amplitudes at 50 Hz stimulation in aged versus young rats, adjusted p = 0.0007) c. Representative single fiber electromyography traces showing single muscle fiber action potentials recorded from a healthy synapse with no blocking and normal jitter (Scale: amplitude: 0.5 mV/division and 500 µs/division). d. Representative single fiber electromyography traces showing single muscle fiber action potentials recorded from a failing synapse with evidence of action potential blocking and increased jitter (Scale: amplitude: 1 mV/division and 500 µs/division). e. NMJ jitter on single fiber electromyography showed increased variability of transmission (jitter) in aged versus young rats (t-test: p = 0.0023). f. NMJ % blocking on single fiber electromyography was increased in aged versus young rats (Mann Whitney test: p = 0.0025). Young rats, n = 8 (3 females, 5 males) and aged rats, n = 8 (3 females, 5 males). ** p < 0.01, *** p < 0.001
The corrected Figure 1 and legend are shown in the next page.
Footnotes
Publisher's Note
Springer Nature remains neutral with regard to jurisdictional claims in published maps and institutional affiliations.


