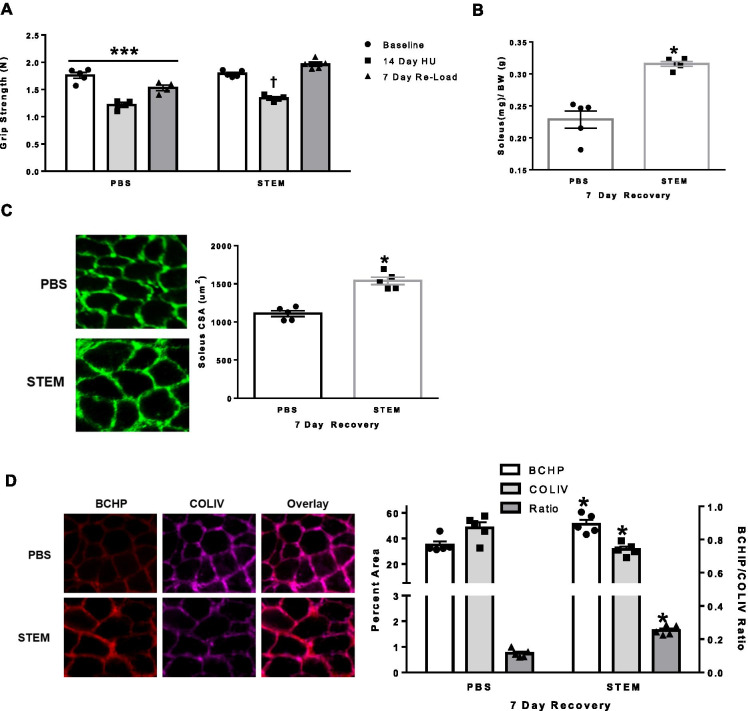
Fig. 6.
STEM effects on skeletal muscle after 7 days of recovery following hindlimb unloading: panels represent A grip strength of PBS- and STEM-treated mice at baseline (1 day prior to treatment), repeated at day 14 of HU (hindlimb unloading), and day 6 of RL (reload,1 day prior to tissue harvest). B Soleus muscle mass (mg/g); C soleus muscle cross-sectional area (CSA) displayed in um2; and D soleus muscle BCHP, COLIV, and BCHP/COLIV ratio in STEM- and PBS-treated mice after 7 days of recovery following 14 days of hindlimb unloading. Representative immunohistochemistry images are depicted next to panel. N = 5 mice in each group. Results are mean with standard error of the mean. Two-way ANOVA-repeated measures used for panel A. T-test between PBS and STEM (B–D). *** = all PBS groups different to each other. † = different to all groups. * = different to PBS

