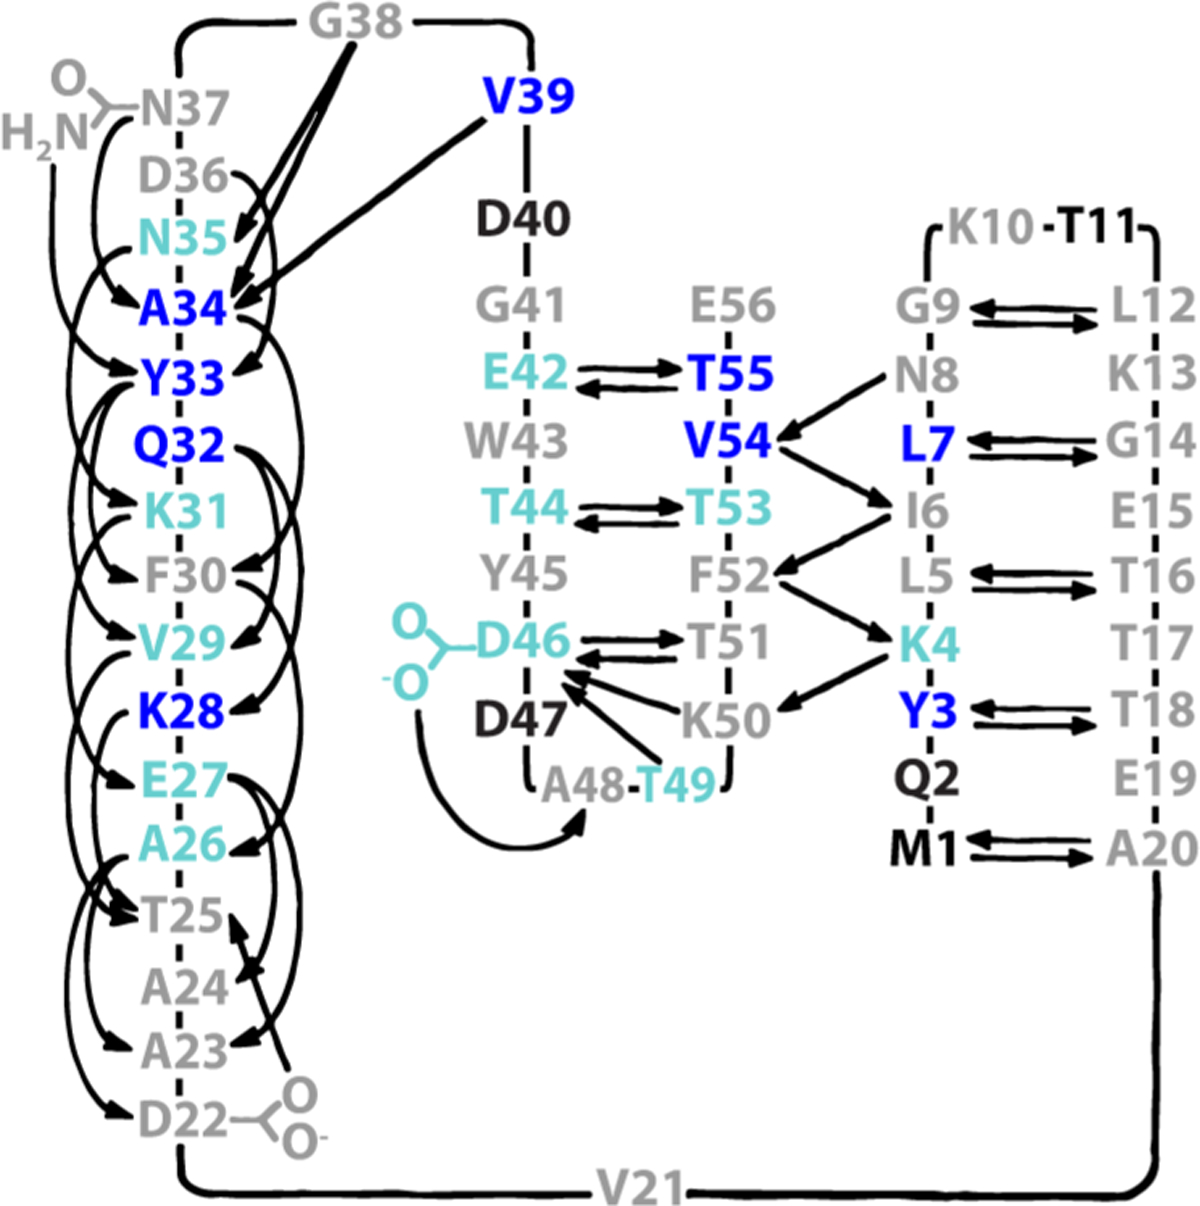
Figure 5.

Trehalose protection mapped onto the native H-bonding pattern of GB1.37 Residues colored dark blue exhibit a Δ% protected >1 standard deviation (SD) above average, light blue values within 1 SD and not within uncertainty of zero, gray values within <1 SD or within uncertainty of zero, and black values of undefined protection (i.e., 100% quench-labeled). Adapted with permission from ref 37. Copyright 1991 American Association for the Advancement of Science.
