Abstract
Collagen VI-related dystrophies (COL6-RDs) and Duchenne muscular dystrophy (DMD) cause progressive muscle weakness and disability. COL6-RDs are caused by mutations in the COL6 genes (COL6A1, COL6A2 and COL6A3) encoding the extracellular matrix protein collagen VI, and DMD is caused by mutations in the DMD gene encoding the cytoplasmic protein dystrophin. Both COL6-RDs and DMD are characterized by infiltration of the muscles by fatty and fibrotic tissue. This study examined the effect of disease pathology on skeletal muscles in lower extremity muscles of COL6-RDs using timed functional tests, strength measures and qualitative/ quantitative magnetic resonance imaging/spectroscopy measures (MRI/MRS) in comparison to unaffected (control) individuals. Patients with COL6-RD were also compared to age and gender matched patients with DMD.
Patients with COL6-RD presented with a typical pattern of fatty infiltration of the muscle giving rise to an apparent halo effect around the muscle, while patients with DMD had evidence of fatty infiltration throughout the muscle areas imaged. Quantitatively, fat fraction, and transverse relaxation time (T2) were elevated in both COL6-RD and DMD patients compared to unaffected (control) individuals. Patients with COL6-RD had widespread muscle atrophy, likely contributing to weakness. In contrast, patients with DMD revealed force deficits even in muscle groups with increased contractile areas.
Keywords: Collagen VI-related dystrophies, duchenne muscular dystrophy, magnetic resonance imaging, force production
INTRODUCTION
The congenital muscular dystrophies are a genetically and clinically diverse group of muscle conditions which present congenitally, are characterized by hypotonia and muscle weakness and are associated with a dystrophic-appearing muscle biopsy. The collagen VI-related dystrophies (COL6-RDs) are caused by mutations in the collagen 6 genes (COL6A1, COL6A2, and COL6A3) encoding proteins involved in linking the extracellular matrix and sarcolemma proteins [1, 2]. Both autosomal dominant as well as recessive mutations in the COL6 genes, can lead to COL6-RD. Based on clinical severity, the COL6-RD phenotypic spectrum can be subdivided into: Ullrich congenital muscular dystrophy (UCMD) for patients who either never achieve independent ambulation or lose the ability to walk independently by 10 years of age, the milder phenotype of Bethlem myopathy for patients who are able to walk independently until adulthood, and a phenotype of intermediate severity between the two. In contrast to the COL6-RDs which are characterized as extracellular matrix disorders resulting in a phenotype of a combined connective tissue/congenital muscular dystrophy, Duchenne muscular dystrophy (DMD) is a childhood-onset muscular dystrophy caused by the absence of the intracellular sarcolemmal protein dystrophin which serves to link the cytoskeleton to a transmembrane protein. Despite these differences, muscle histopathology findings in both DMD and COL6-RD are characterized by fatty tissue infiltration, excessive fibrosis and necrosis of muscle fibers.
Muscle biopsy can often be essential for diagnosing a muscular dystrophy, but has some limitations in monitoring these diseases over time, including limited tissue sampling [3, 4] resulting in regional sampling bias due to the variable tissue involvement. Non-invasive measures of motor function such as timed function tests including the 6-minute walk test [5], qualitative assessment tools [5–8], strength testing [9–11], pulmonary function tests [11–13] and muscle functional scales such as the Motor Function Measure 32 [11] have all been used to determine disease progression in COL6-RD and DMD. These measures though effective, have limited sensitivity, especially early in the disease process. With the limitations of the currently available outcome measures, there is a need for non-invasive quantitative measures of musculoskeletal changes with high sensitivity in order to assess both disease progression as well as potential efficacy of therapeutic interventions.
Magnetic resonance imaging (MRI) has been shown to be an objective, sensitive and specific marker of musculoskeletal injuries [9, 14–18]. In COL6-RDs, however, muscle MRI has mainly been used to provide a qualitative assessment of muscle appearance [16, 19]. The overall objective of this study was to assess if muscle MRI could be used as a quantitative, non-invasive biomarker in collagen VI-related dystrophies. We hypothesized that patients with COL6-RDs are characterized by muscle atrophy and the progressive replacement of muscle by connective and fatty tissue as measured by quantitative MRI in comparison to age-matched controls. We also hypothesized that muscle involvement as measured by quantitative MRI in patients with COL6-RD would occur in patterns different from those in patients with DMD. Finally, we hypothesized whereas both dystrophies are characterized by inflammation and replacement of the muscle with fatty tissue, the relationship between muscle size and ability to produce force will be different between DMD and COL6-RDs.
METHODS
In the first aim of the study, thirteen patients with a genetically confirmed diagnosis of COL6-RD and a clinical phenotype of either Bethlem myopathy or Intermediate COL6-RD volunteered to take part in this study (male = 12, female = 1) (Table 1). Patients with COL6-RD were compared to 14 age-matched unaffected (control) individuals (Male = 10, Female = 4) (Table 1).
Table 1.
Demographics of age matched COL6-RD, DMD and control healthy participants
| Age (Years) | Sex (M/F) | Height (cm) | Body Weight (kg) | BSA (kg/cm2) | |
|---|---|---|---|---|---|
| Aim 1: COL6-RD and Control healthy | |||||
| COL6-RDs (n = 13) | 19.2 ± 15.1 | 12/1 | 147.6 ± 21.7 | 39.7 ± 20.2 | 1.5 ± 0.5 |
| Range = 5.9–46.3 | |||||
| Controls (n = 14) | 19.1 ± 14.4 | 10/4 | 150.3 ± 25.4 | 52.8 ± 27.0 | 1.3 ± 0.4 |
| Range = 5.6–44.6 | |||||
| Aim 2: Age Matched Control healthy, COL6-RD and DMD | |||||
| Controls (n = 7) | 9.0 ± 2.0 | 7/0 | 137.3 ± 16.6 | 37.1 ± 11.6 | 1.2 ± 0.3 |
| Range = 5.6–11.9 | |||||
| COL6-RDs (n = 7) | 10.5 ± 3.4 | 7/0 | 140.0 ± 19.8 | 32.2 ± 8.3 | 1.1 ± 0.2 |
| Range = 5.9–14.6 | |||||
| DMD (n = 8) | 9.0 ± 3.0 | 8/0 | 121.9 ± 13.9 | 43.1 ± 38.6 | 1.1 ± 0.5 |
| Range = 5.3–13.3 | |||||
COL6-RD – Collagen VI related dystrophy, DMD- Duchenne Muscular Dystrophy, M- Male, F- Female, BSA – Body surface area.
In second sub-aim, a subgroup of patients with COL6-RD (n = 7) was age and gender- matched to a group of patients with DMD (n = 8) and unaffected (control) individuals (n = 7) (Table 1). Diagnosis of DMD was confirmed on the basis of (1) DMD specific clinical feature before 5 years of age, (2) serum creatine kinase level above normal, and (3) absence of dystrophin expression, on immunostaining or Western blot (<2%), and/or DNA confirmation of a dystrophin mutation. The study was approved by the University of Florida Institutional Review Board. Written informed consent was obtained from the patient or parents/legal guardians of the subject (if the subject was below 18 years) before beginning the study. All patients underwent a muscle MRI scan of approximately 60–90 minutes duration. Following the MRI scan, patients performed strength testing on a computerized isokinetic dynamometer (Biodex, System 3.0, Biodex Corp, Shirley, NY) and were asked to perform a battery of functional tests as described below.
MR acquisition
MR images of lower extremity were acquired using a 3.0 T whole body scanner (Philips Achieva Quasar Dual 3T, Philips, Best, the Netherlands). All patients were asked to avoid any excessive physical activity 48 hours prior to MRI. While on site, patients were transported between different testing locations in a wheelchair to minimize the effect of fatigue. To acquire the MRI scans, the patients were asked to lie down in a supine position, and the right leg was secured using foam wraps and sandbags to minimize motion artifacts during the MRI. For the children, a parent and one of the team members accompanied the patients inside the MR environment during the scan. A sixteen channel transmit/receive coil (Invivo, Gainesville, Florida) and an eight-channel FLEX coil (Invivo, Gainesville, Florida) were used to acquire images from the lower leg and thigh, respectively. T1-weighted 3D gradient echo transaxial images of right lower leg and thigh were acquired (In subjects where we were not able to image right leg due to contractures or metal implants, left leg was scanned) with spectral selection attenuated inversion recovery with fat suppression (SPIR). Specific MRI acquisition parameters were as follows for the lower leg: Field of View (FOV) = 120 × 120 × 146 mm3, repetition time/echo time (TR/TE = 17/1.9 ms; thigh: FOV = 170 × 170 × 146 mm3, TR/TE = 24/1.8 ms) and without fat suppression [lower leg: Field of View (FOV) = 120 × 120 × 146 mm3, TR/TE = 4.9/1.9 ms and thigh: FOV = 170 × 170 × 146 mm3, TR/TE = 6.1/1.4 ms). T2-weighted multi-slice spin echo (SE) images without fat suppression were also acquired from the thigh and the calf as described previously by Forbes et al (2013)[20] and Willcocks et al (2014)[21] (12 to 18 axial slices, slice thickness = 7 mm, TR = 3 s, 5 echo train (TE = 20, 40, 60, 80, and 100 ms), with a refocusing angle of 180°
In addition to these MRIs, single voxel 1H-MRS data were acquired (TE = 108 ms; TR = 3 s; NA = 64) for assessment of lipid fraction using stimulated-echo acquisition mode (STEAM) from the soleus (Sol) and vastus lateralis muscle (VL) and were corrected for T1 and T2 relaxation. Details of MR acquisition parameters were reported earlier by Forbes et al. (2013) [22] and Triplett et al. (2013) [23].
Qualitative MR measures
T1-weighted trans-axial images of lower leg and thigh were observed qualitatively by trained analyzers to examine the pattern of muscle involvement in patients with COL6-related dystrophies. Further, these images were compared with images from patients with DMD to differentiate between both muscular dystrophies.
Quantitative MR measures
Maximum Cross-Sectional Area (CSAmax):
T1 weighted images were used to determine the (CSAmax) of the quadriceps [vastus lateralis (VL), vastus medialis (VM), vastus intermedius (VI), rectus femoris (RF)] and the plantarflexors [lateral gastrocnemius (LG), medial gastrocnemius (MG), soleus (Sol)]. Regions of interest (ROIs) were manually traced using OSIRIX (Pixmeo SARL 8.0) software to obtain the CSA of each muscle. CSAmax was defined as the average of the slice with the largest CSA and one slice proximal and distal to it [9, 22, 24].
Non-fat Area:
The ROIs used for the measurement of CSAmax were also used to calculate the degree of muscle replacement by fat. The images acquired were corrected for heterogeneity using N4 correction algorithm(25) A custom written IDL (Interactive Data Language; Harris Geospatial Solution, v8.5) program was used to obtain a non-fat area based on signal intensity thresholding(22) using a center of valley output (based on the signal intensity of fat and the preserved muscle). This acquired percentage was then multiplied by CSAmax to obtain an estimate of non-fat area(22). ROIs for CSA, ROIs were also drawn in subcutaneous fat just external to the muscle for fat content analysis. To determine the signal intensity of unaffected muscle, ROIs were traced from muscles that are typically less affected including tibialis posterior (TP) in the lower leg and the sartorius (Sar) and gracilis (Gra) of the thigh [16, 22, 26].
T2 measurement:
T2 maps were generated using custom-written IDL software (Harris Geospatial Solution, 8.5). This software applied a monoexponential decay model to four echo times (40, 60, 80, and 100 ms) to determine the T2 for each pixel in the image. The VL, Bicep Femoris Long Head (BFLH), Gracilis (Gra), Medial Gastrocnemius (MG), Peroneals (Per), Soleus (Sol), Tibialis Anterior (TA) were manually circled on three slices in a T2 map.Values from each slice were averaged to obtain MRI T2 values of the muscle of interest. The details of T2 analysis were reported by Willcocks et al (2014) [21].
IH MRS Fat Fraction (FF):
1H-MRS measures of lipid fraction and T2 were performed for the Sol and VL using automated processing of spectra. FF was assessed using area integration of the phase corrected spectra for the lipid (0.5–2.75 ppm) and 1H2O (4.3–5.10 ppm) region of the spectrum using custom-written software in IDL(Harris Geospatial Solution, 8.5) and corrected for T1 and T2 relaxation. The details of the analysis were reported earlier by Lott et al (2014) [27] and Forbes et al (2013) [22].
Strength testing
Isometric muscle strength testing was performed for both the knee extensor (KE) and plantar flexor (PF) muscle groups using an isokinetic computerized Biodex dynamometer (Biodex; Shirley, NY). For KE strength testing, patients’ right knee and hip were placed at 90 degrees of flexion. For PF strength testing, the knee was placed at 0 to 10 degrees of flexion, while the ankle was placed in a neutral position. For both KE and PF testing, the subject was asked to push against a static pad as hard as possible for approximately five seconds to calculate isometric torque, followed by a rest period of one minute. Patients were asked to perform a minimum of five trials but continued to perform trials until at least a 10% decrement in torque production was observed [9, 28]. Torque was normalized to the non-fat area for quadriceps and calf muscles to obtain specific torque per unit area of muscle.
Functional testing
Participants were asked to perform three timed performance tasks (the 10m walk/run, climbing 4 stairs, supine to stand) [11, 21, 28, 29] and a six-minute walk test [18, 30]. Patients performed all timed tasks except the six-minute walk test three times, and the fastest time recorded was used for analysis. During timed functional tests, patients were given an adequate time interval between each trial and also each test, to minimize the effect of fatigue. In the six-minute walk test, patients were asked to walk around cones placed 25 meters apart for six minutes and the total distance traveled was recorded [30].
Graphpad Prism (Version 8.0) was used for statistical analysis. Independent t test with Bonferroni correction was used to compared control to COL6RD. One-way ANOVA with Tukey post hoc analysis was used to compare control, COL6 RD and DMD. Level of significance was set at p < 0.05.
RESULTS
Patients with COL6-RD in this study had a unique pattern of muscle involvement on MRI, namely an inward (outside-in) progression (starting from fascial planes and progressing into the vastus lateralis (VL), lateral gastrocnemius (LG) and central shadowing in rectus femoris (RF)) of fibro-fatty material based on T1 weighted images. This inward progression of fibro-fatty transformation leads to the formation of a ring of lipid rich structure around the muscle (Fig. 1), the thickness of which increases with disease severity, as the muscle tissue gives way to fibro-fatty material as the disease progresses (Fig. 1).
Fig. 1.
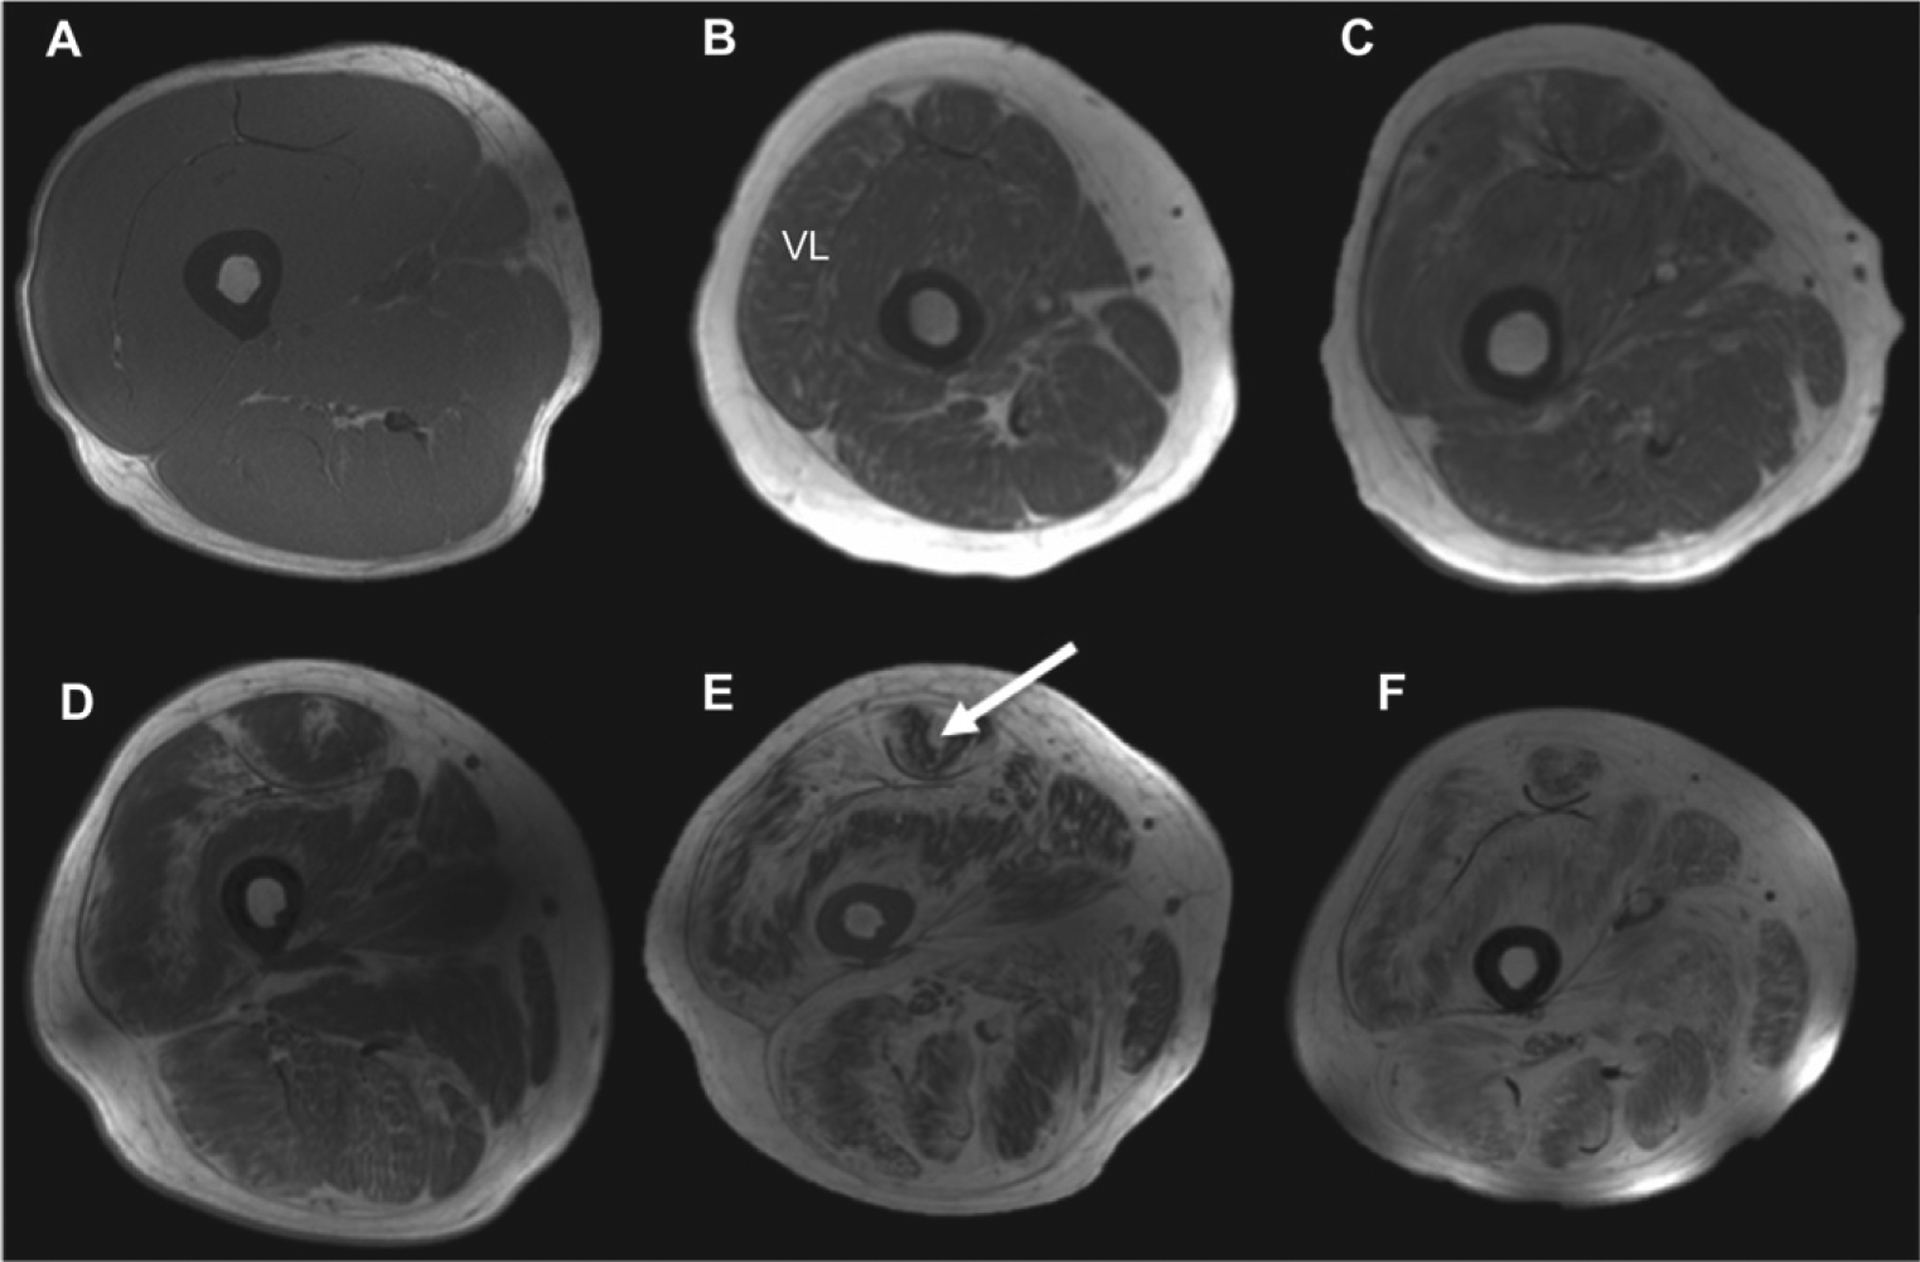
T1-weighted images (thigh muscles) of patients with COL6-RD in comparison to unaffected (control) individuals (first axial slice), indicating the pattern of fibro-fatty material with increased disease severity (B–E). There is a characteristic inward progression of fibro-fatty material from fascia to deep inside the vastus lateralis muscle. Also, there is a characteristic central shadow (target)-like appearance in the rectus femoris (RF) muscle (white arrow).
In contrast, the pattern of muscle involvement in patients with DMD was characterized by a diffuse infiltration pattern of lipids throughout the muscle compartments (Fig. 2).
Fig. 2.
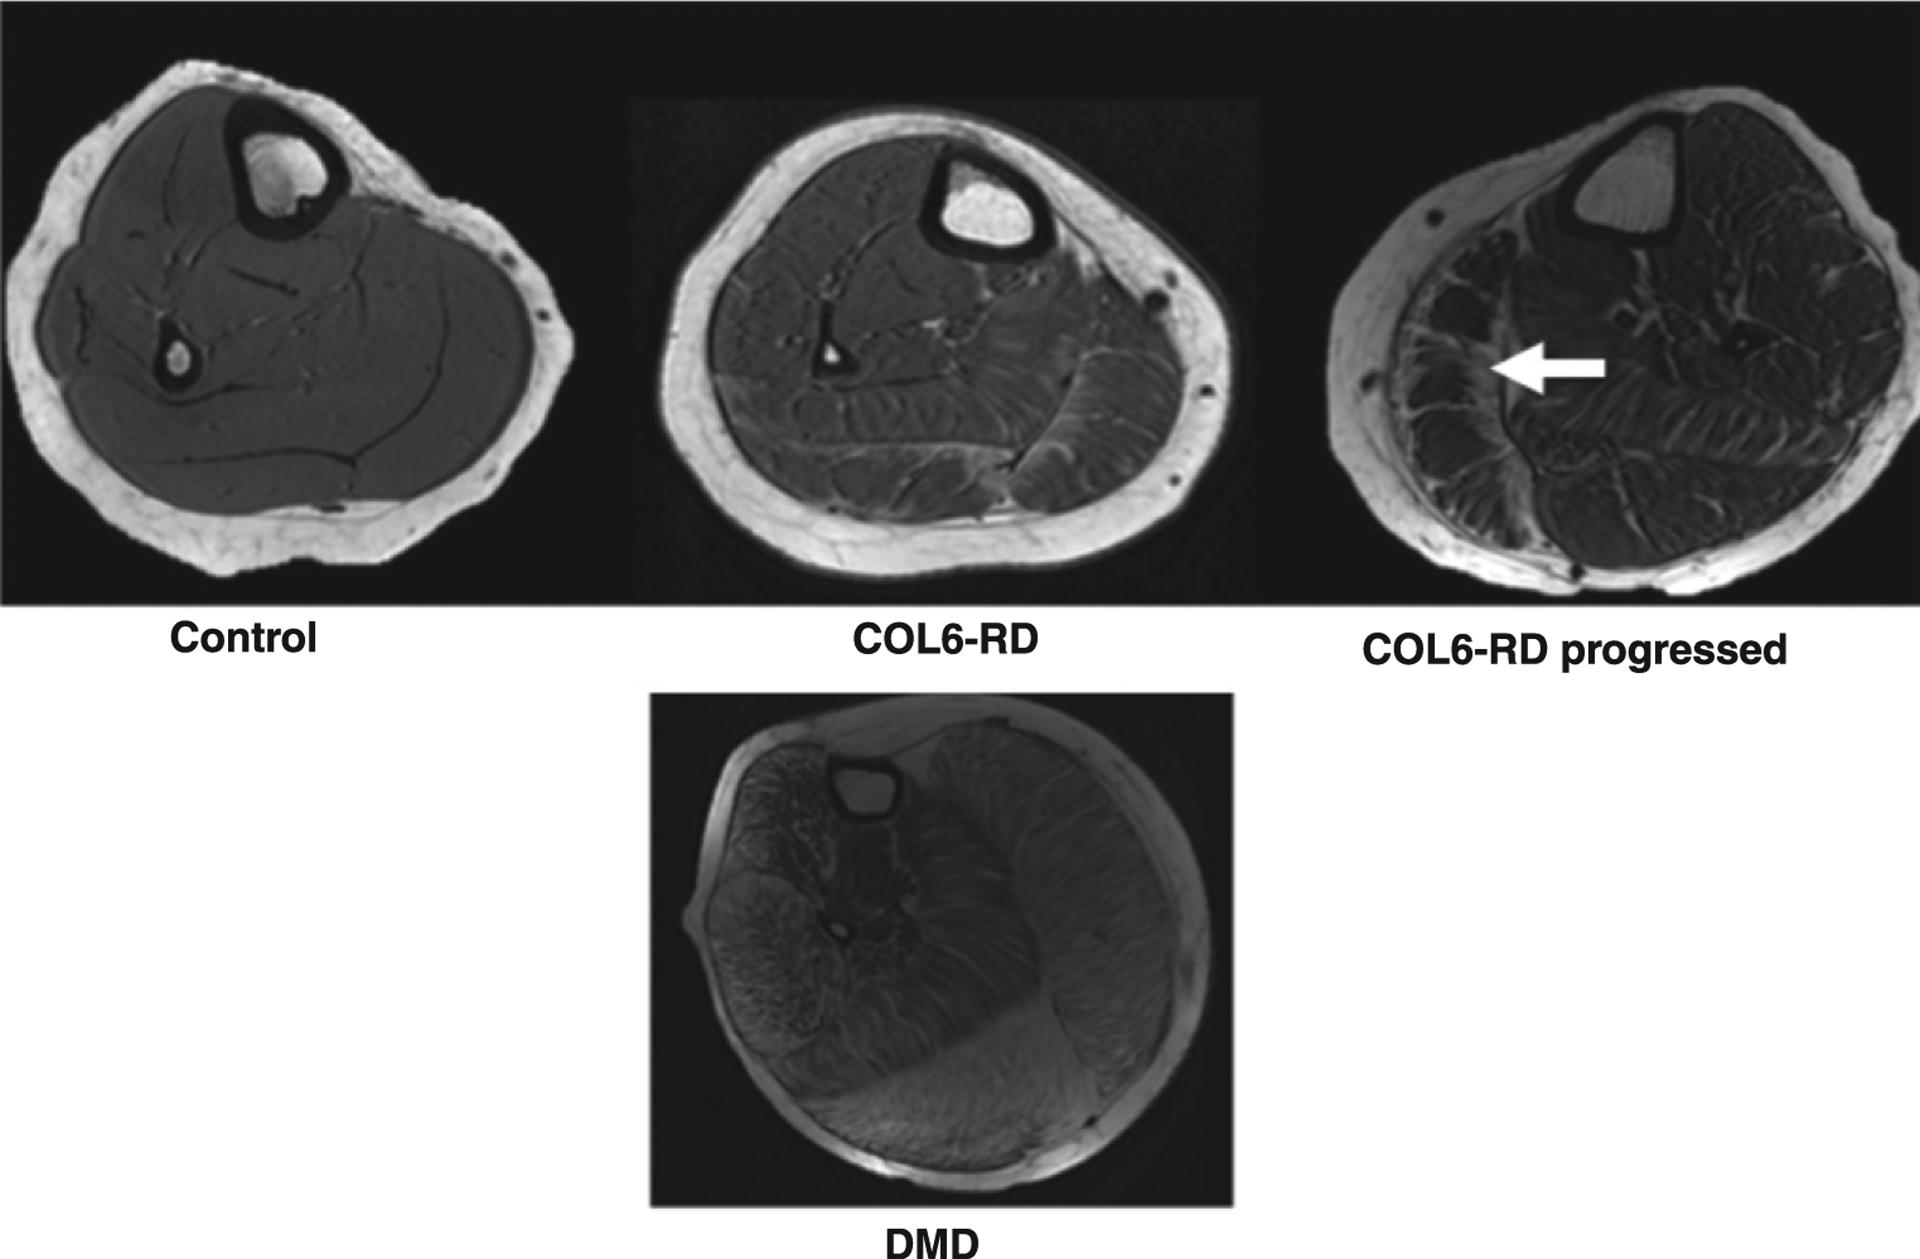
T1-weighted trans-axial images of the lower leg of age-matched patients with COL6-RD, DMD and unaffected (control) individuals showing the different patterns of disease progression with fibro-fatty infiltration in two different forms of muscular dystrophies. The characteristic inwards progression (fascia to deep inside muscle compartment) of fibro-fatty material (shown by white arrow) in the lateral gastrocnemius (LG) of subject with COL6-related dystrophy is seen. Note: Representative scans of COL6-RD progressed in figure are from left lower leg.
CSAmax
CSAmax of individual muscles in both thigh and lower leg of all patients are shown in Table 2. CSAmax was reduced for all muscles analyzed in patients with COL6-RD in comparison to controls. This decrement in CSAmax was more pronounced and significant in thigh muscles (average 43% lower for thigh muscles; a significant decline in CSAmax of VI, VM, and RF; p < 0.05) in comparison to lower leg muscles (26% lower for lower leg muscles).
Table 2.
Comparison of CSA and Non-fat Area of COL6-RD and control participants (thigh and lower leg)
| Group | Muscles | CONTROL | COL6-RD | ||
|---|---|---|---|---|---|
| CSAmax (cm2) | Non-Fat Area (cm2) | CSAmax (cm2) | Non-Fat Area (cm2) | ||
| Thigh | VI | 16.1 ± 8.2 | 15.9 ± 8.2 | 8.3 ± 3.0+ | 7.1 ± 3.2+ |
| VL | 19.0 ± 8.4 | 18.7 ± 8.3 | 13.1 ± 6.1 | 10.7 ± 4.7+ | |
| VM | 15.8 ± 8.1 | 15.4 ± 8.1 | 7.7 ± 3.8+ | 5.7 ± 2.7+ | |
| RF | 8.4 ± 2.9 | 8.2 ± 2.8 | 5.0 ± 2.3+ | 4.5 ± 2.2+ | |
| Lower leg | Sol | 19.6 ± 9.4 | 19.0 ± 9.5 | 14.0 ± 9.0 | 13.6 ± 8.7 |
| MG | 10.8 ± 6.2 | 10.6 ± 6.0 | 8.0 ± 4.8 | 7.7 ± 4.6 | |
| LG | 7.3 ± 4.3 | 7.2 ± 4.2 | 5.7 ± 3.4 | 5.3 ± 2.8 | |
Significantly different from control at p < 0.05.
COL6-RD – Collagen VI related dystrophy, CSAmax- Maximum cross-sectional area, VIVastus Intermedius, VL- Vastus Lateralis, VM- Vastus Medialis, RF- Rectus Femoris, Sol- Soleus, MG- Medial Gastrocnemius, LG- Lateral Gastrocnemius.
When comparing a subgroup of patients with COL6-RD to age and gender- matched patients with DMD and unaffected (control) participants, patients with DMD were found to have the highest CSAmax for all the lower leg muscles analyzed (p < 0.05) (Fig. 3), and patients with COL-6RD had the smallest CSAmax. Both patients with DMD and patients with COL6-RD had lower CSAmax in the thigh muscles when compared to the control group (Fig. 3). Patients with COL6-RD had the smallest CSAmax of all three groups for thigh muscles with significantly atrophied VL, VM and RF muscles (p < 0.05) (Fig. 3)
Fig. 3.
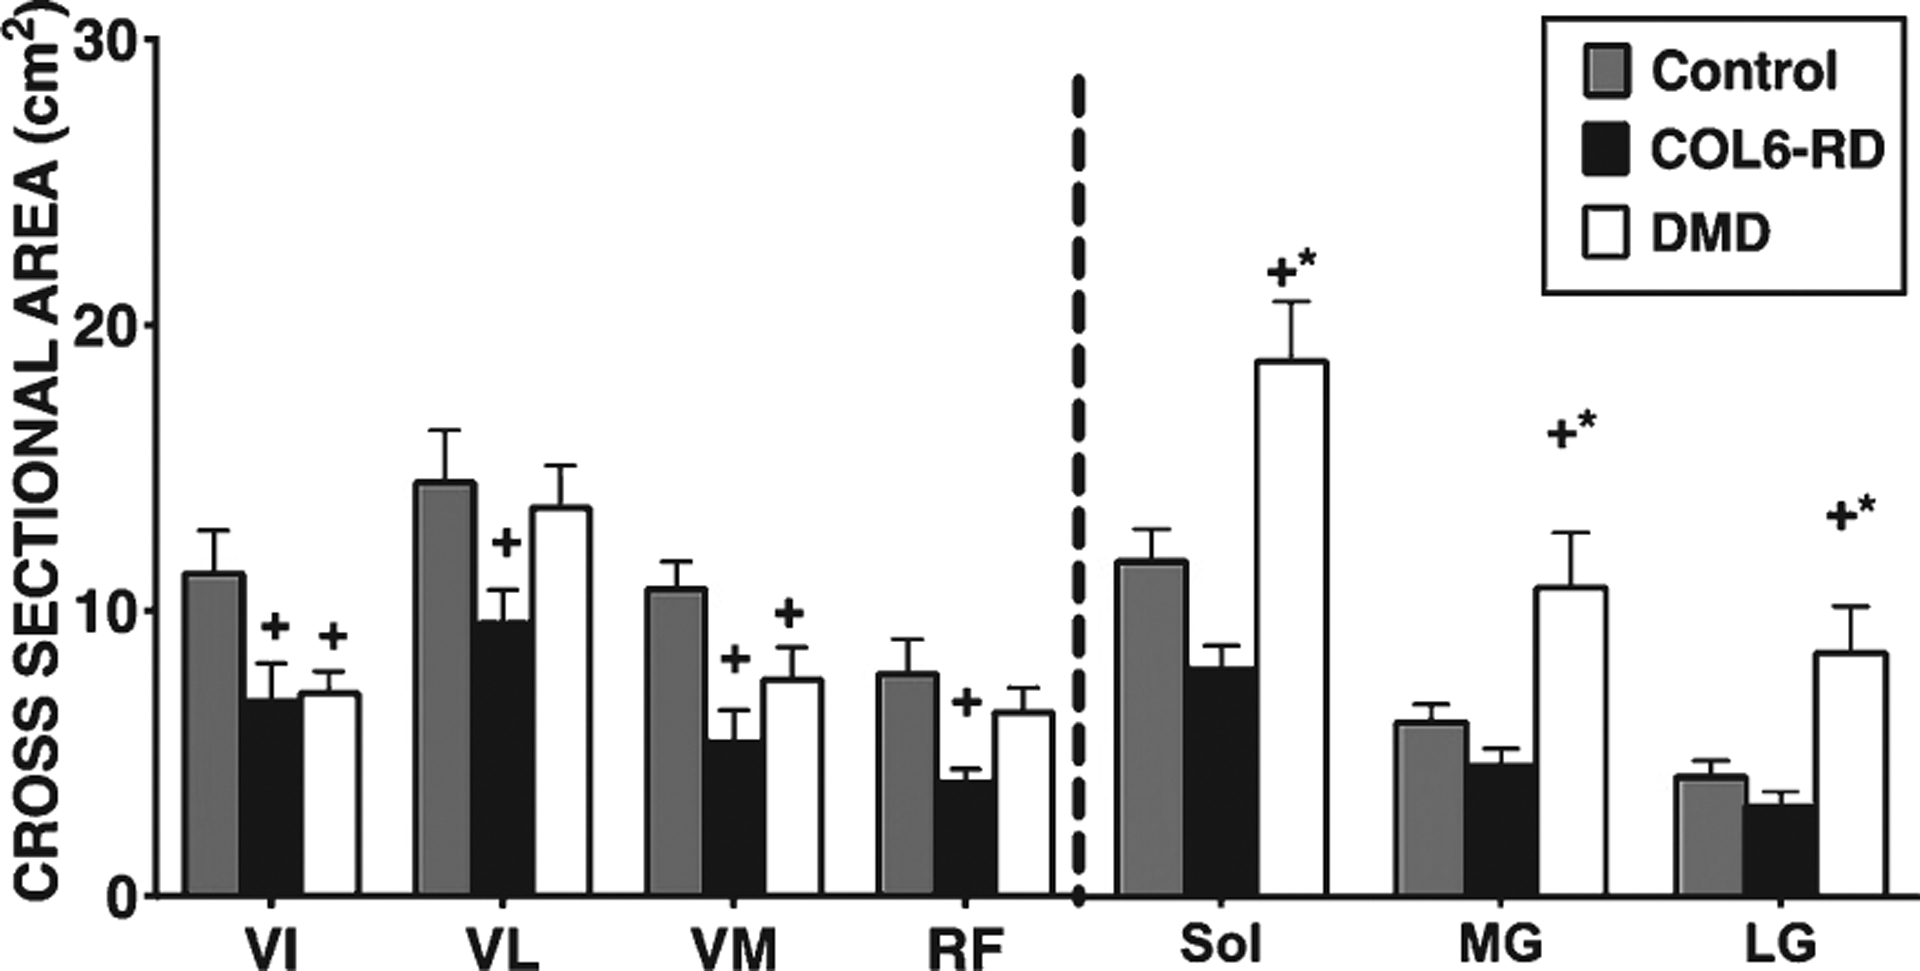
Comparison of cross-sectional area max (CSAmax) between COL6-RD, DMD and control groups. +significantly different from control; * significantly different from COL6 p < 0.05; COL6-RD-Collagen VI related dystrophy, DMD- Duchenne Dystrophy, VIVastus Intermedius, VL- Vastus Lateralis, VM- Vastus Medialis, RF- Rectus Femoris, Sol- Soleus, MG- Medial Gastrocnemius, LG- Lateral Gastrocnemius.
Non-fat area
Non-fat area measurements showed similar trends as for CSAmax. The non-fat areas of the thigh muscles (VI, VM, RF) for patients with COL6-RD were significantly lower than those of the control group (p < 0.05; average 52% lower than controls) (Table 2). Also, the lower leg muscles of patients with COL6-RD had a lower non-fat area when compared to the controls, but this difference did not reach significance (average 27% lower than controls).
Similar to CSAmax, patients with DMD had the greatest non-fat area for the lower leg muscles of all three groups (Fig. 4), while patients with COL6-RD possessed the smallest non-fat areas. Both patients with COL6-RD and those with DMD had significantly lower non-fat areas for all the thigh muscles (except for the RF in patients with DMD) (Fig. 4) compared to the control group (p < 0.05). Between patients with DMD and those with COL6-RD, individuals with COL6-RD had lower non-fat areas (p < 0.05).
Fig. 4.
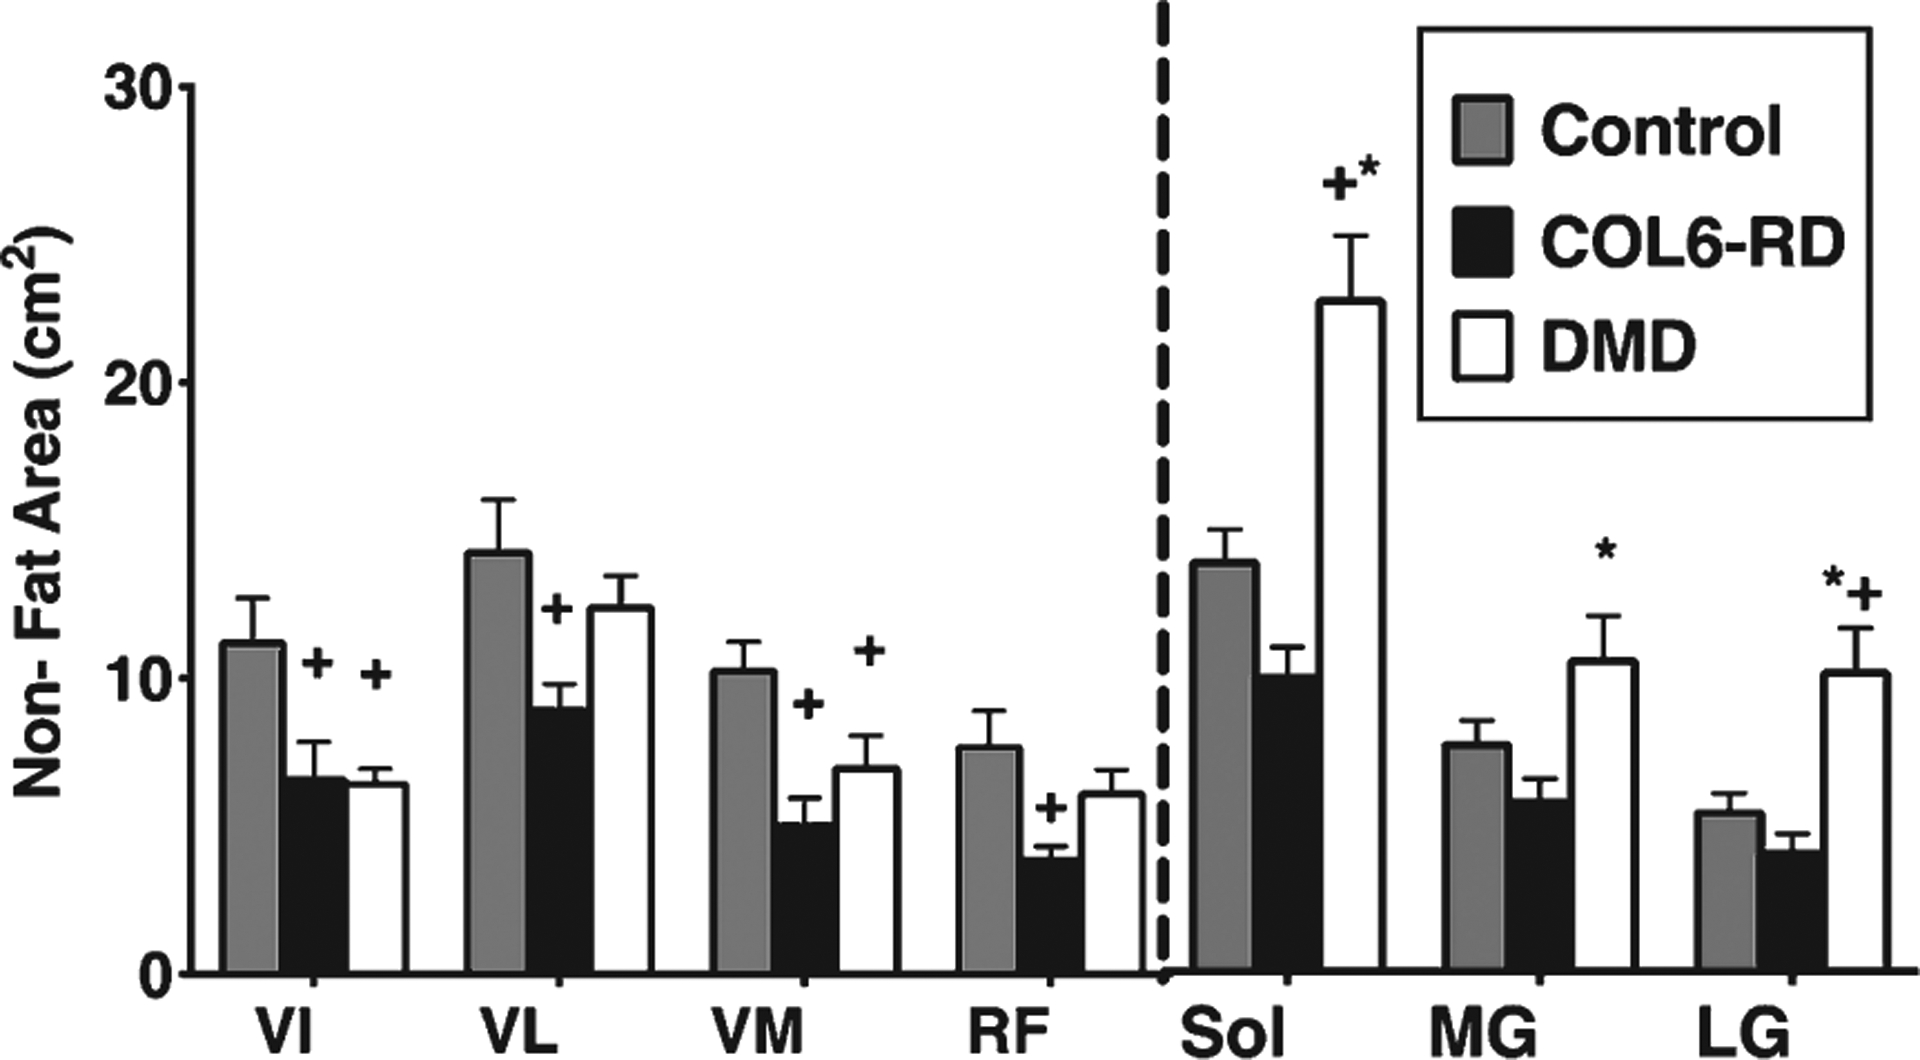
Comparison of thigh and lower leg Non-Fat area between COL6-RD, DMD and control groups. +significantly different from control. *significantly different from COL6; p < 0.05; COL6-RD-Collagen VI related dystrophy, DMD- Duchenne Muscular Dystrophy, VI- Vastus Intermedius, VL- Vastus Lateralis, VM- Vastus Medialis, RF- Rectus Femoris, Sol- Soleus, MG- Medial Gastrocnemius, LG- Lateral Gastrocnemius.
MRI T2 and 1H MRS FF
MRI T2 for all the thigh and lower leg muscles of interest were significantly higher in patients with COL6-RD compared to the controls (Fig. 5A; p < 0.05). When comparing 1H MRS fat fraction for VL and soleus muscles between the two age and sex matched groups, FF for both the muscles was also significantly higher in patients with COL6-RD (Sol = 0.17 ± 0.1; VL = 0.37 ± 0.3) than controls (Sol = 0.03 ± 0.01; VL = 0.03 0.01; p < 0.05).
Fig. 5.
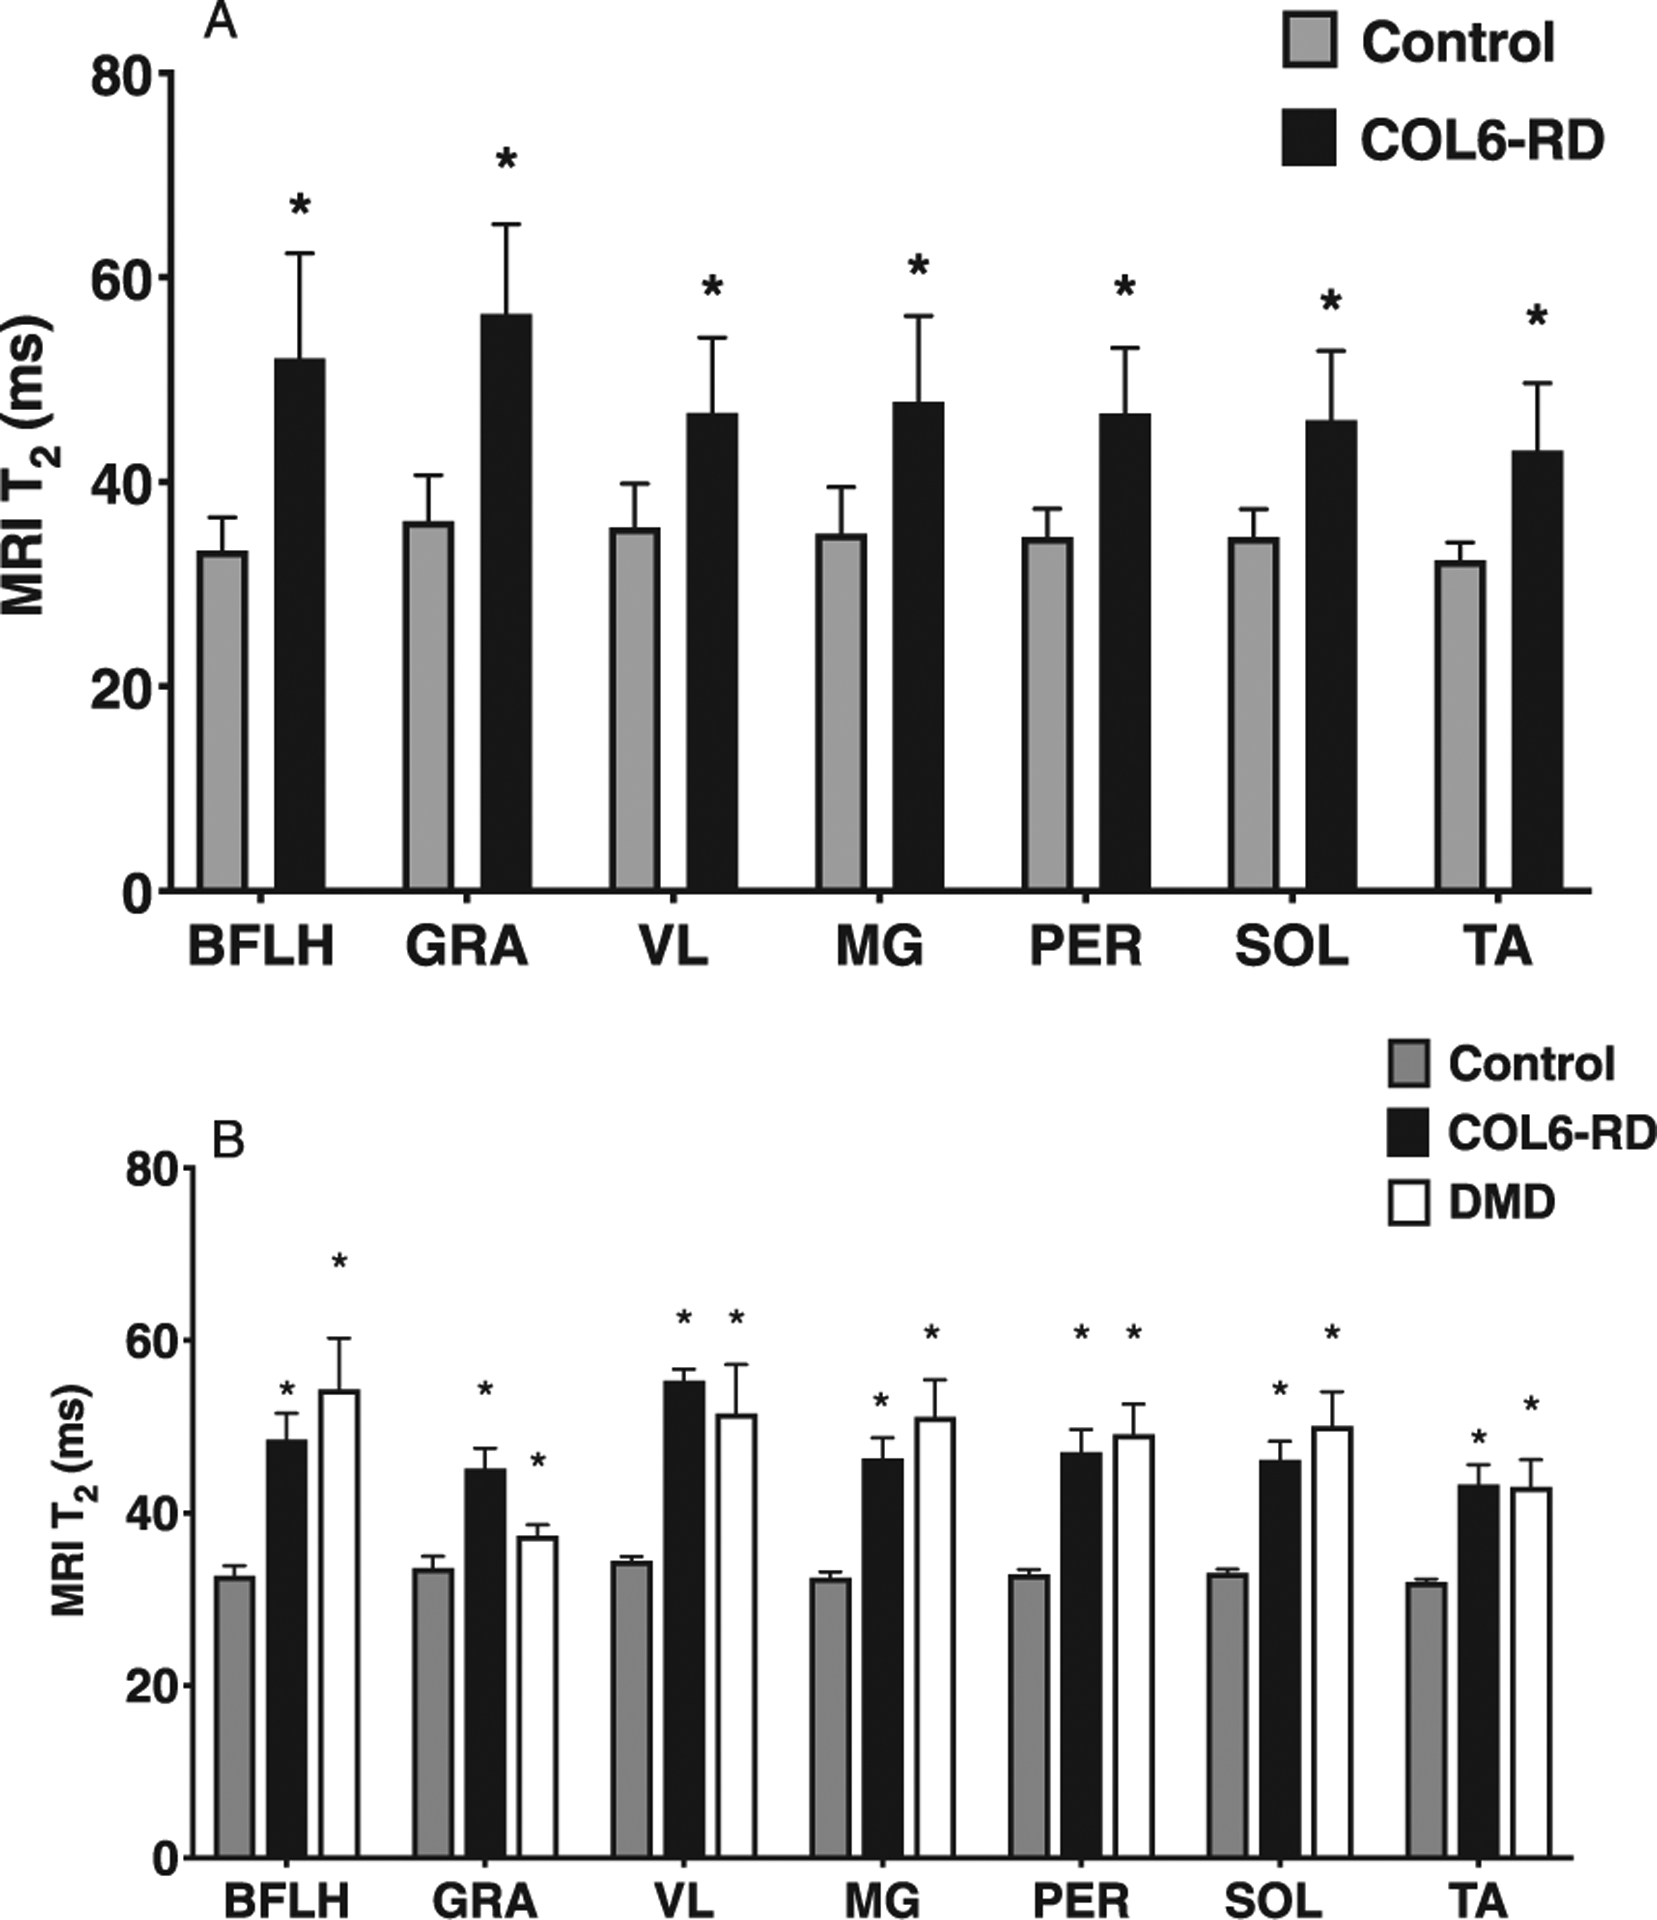
(A) Comparison of MR T2 in both thigh and lower leg muscles between COL6-RD, DMD, and control groups (Whole data). (B) Comparison of MRI T2 between Control, COL6-RD and DMD groups (Age and Sex Matched subset). *Significantly different from controls at p < 0.05. COL6-RD- Collagen VI related dystrophy, VL- Vastus Lateralis, Sol- Soleus, MG- Medial Gastrocnemius, BFLH – Bicep Femoris Long Head, GRA - Gracilis, PER - Peroneus, TA – Tibialis Anterior.
Patients with COL6-RD and those with DMD had a significantly higher MRI T2 (Fig. 5B; p < 0.05) and 1H MRS FF (Fig. 6; p < 0.05) in comparison to age-matched controls. Further, there was no significant difference found in MRI T2 and 1H MRS FF between age and sex matched patients with COL6-RD and DMD (Fig. 6).
Fig. 6.
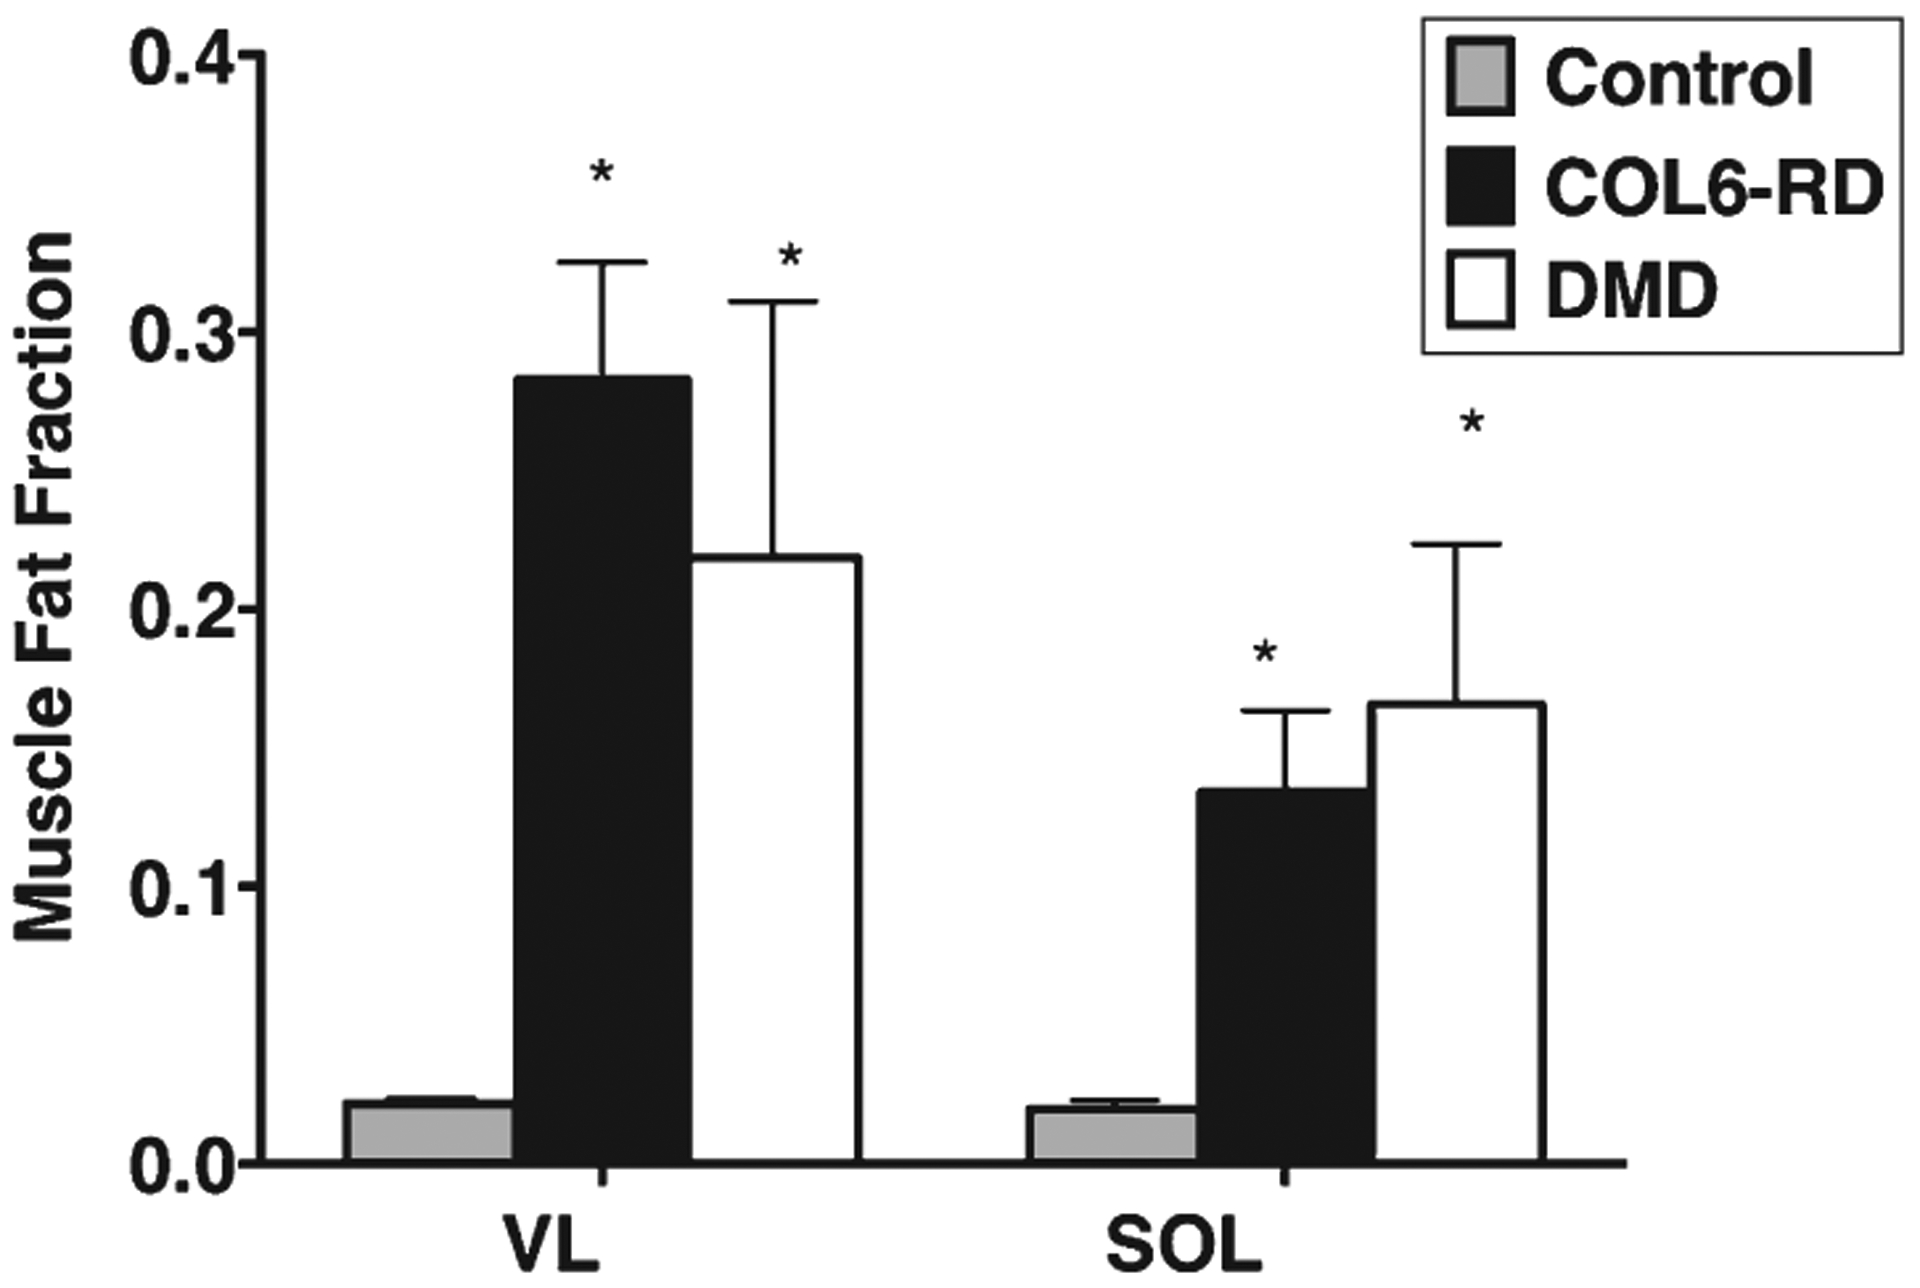
1H MRS FF comparison between age matched COL6-RD, DMD and control groups for Sol and VL muscles. *Signifcantly different from controls at p < 0.05. COL6-RD- Collagen VI related dystrophy, VL- Vastus Lateralis, Sol- Soleus, 1H MRS - 1H Magnetic Resonance Spectroscopy.
Torque production
Torque production for both KE and PF was significantly lower in patients with COL6-RD (KE = 21.2 ± 17.9 ft lb; PF = 37.6 ± 28.0 ft lb) compared to the controls (KE = 89.9 ± 61.4 ft lb; PF = 79.8 ± 35.2 ft lb) p < 0.01 and p < 0.05, respectively (Table 3). KE and PF torque, when normalized to non-fat area (specific torque) showed a significantly lower amount of force production per unit area in patients with COL6-RD compared to the healthy participants (Table 3).
Table 3.
Comparison of strength and functional test between COL6-RD and control participants
| CONTROL | COL6-RD | |
|---|---|---|
| KE Peak Torque (ftlb) | 89.9 ± 61.4 | 22.7 ± 17.2 +++ |
| Normalized KE peak Torque (ftlb/cm2) | 1.4 ± 0.4 | 0.8 ± 0.3 +++ |
| PF Peak Torque (ftlb) | 79.8 ± 35.2 | 38.8 ± 28.7 ++ |
| Normalized PF Peak Torque (ftlb/cm2) | 2.5 ± 1.2 | 1.4 ± 0.4 +++ |
| Climbing 4 Stairs (sec) | 1.5 ± 0.3 | 4.0 ± 2.0 +++ |
| 10m walk/ run (sec) | 3.0 ± 0.4 | 6.2 ± 2.0 +++ |
| Supine to Stand (sec) | 2.0 ± 0.4 | 8.9 ± 6.9 +++ |
| Six min walk (m) | 570.1 ± 85.5 | 391.1 ± 97.4 ++++ |
Significantly different from control at p < 0.01;
Significantly different at p < 0.001;
Significantly different at p < 0.0001;
COL6 - Collagen VI myopathy, KE- Knee Extensors, PF- Plantar Flexors.
Isometric torque for both KE (Fig. 7A) and PF (Fig. 7B) demonstrated that patients with COL6-RD (KE = 15.1 ± 7.1 ft lb; PF = 27.5 ± 13.8 ft lb) and DMD (KE = 11.0 ± 5.8 ft lb; PF = 31.4 ± 10.8 ft lb) have significantly lower torque production than the unaffected age match control group (KE = 57.5 ± 31.4 ft lb; PF = 74.9 ± 26.7 ft lb, p < 0.05). Patients with COL6-RD (KE = 0.7 ± 0.1 ft lb/cm2; PF = 1.5 ± 0.5 ft lb/cm2) and DMD (KE = 0.3 ± 0.2 ft lb/cm2; PF = 0.7 ± 0.4 ft lb/cm2) had significantly lower specific torque production compared to the controls for both KE (Fig. 7B) and PF (Fig. 7B) (KE = 1.2 ± 0.4 ft lb/cm2; PF = 3.0 ± 0.8 ft lb/cm2, p < 0.05). Further, when comparing patients with COL6-RD to DMD, patients with COL6-RD had significantly higher specific torque production in comparison to patients with DMD in their knee extensors (Fig. 7B).
Fig. 7.
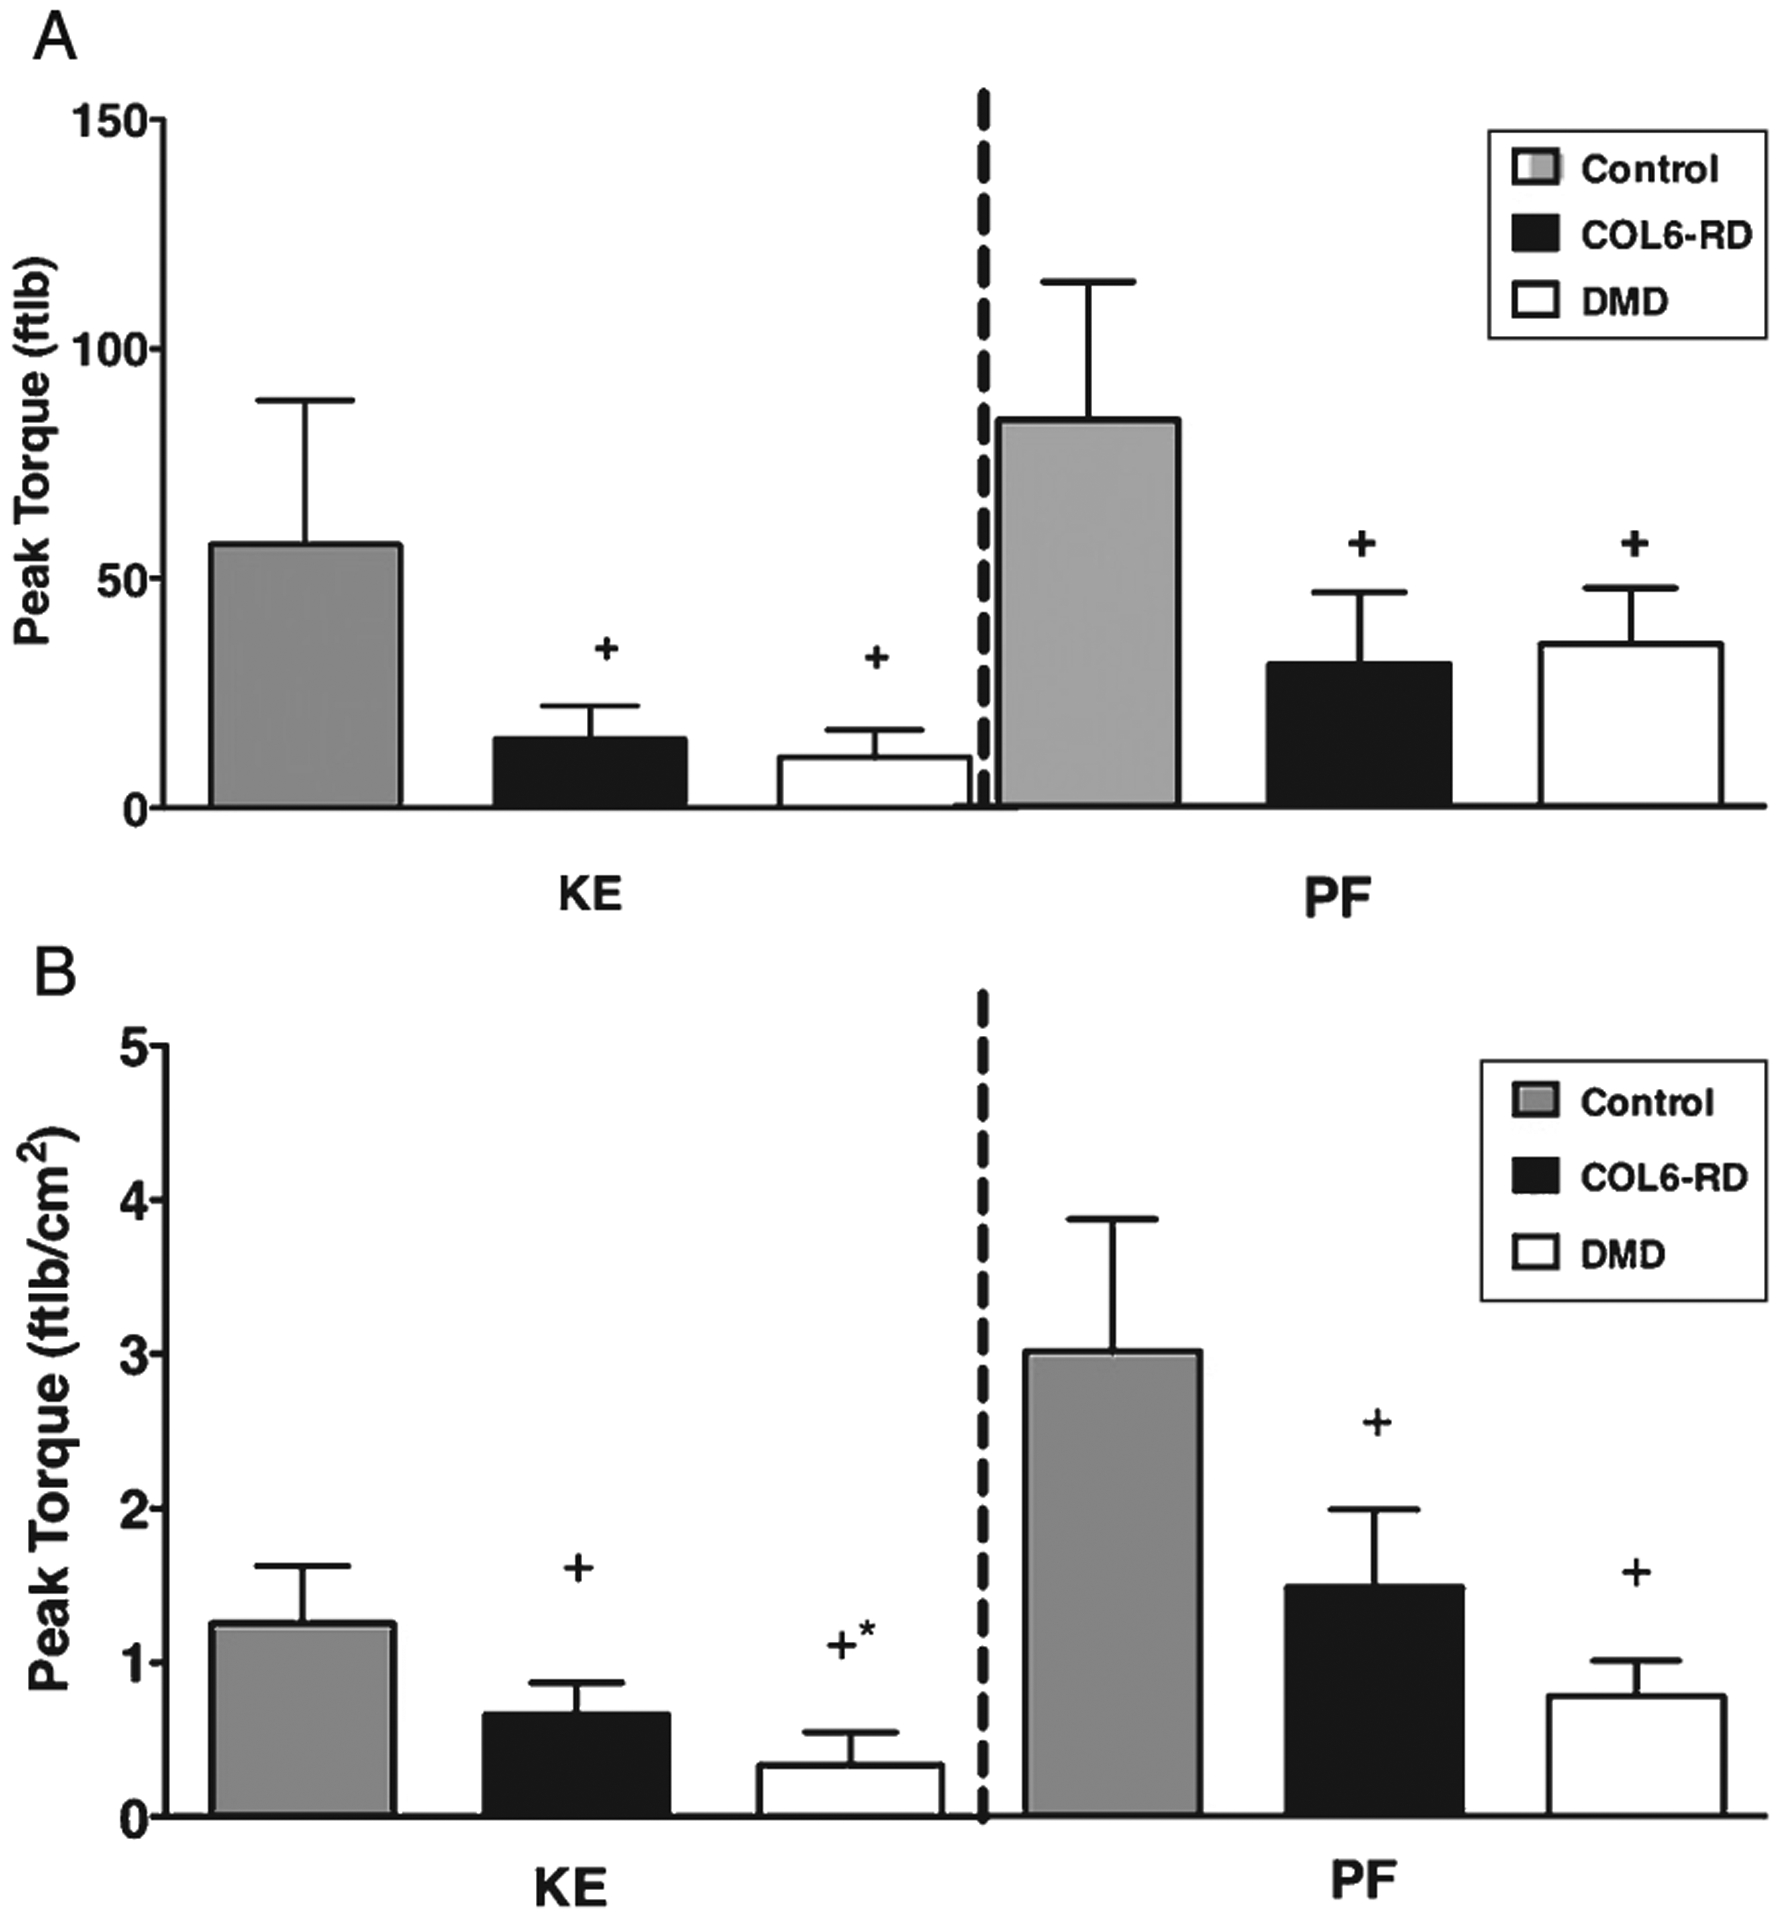
(A) Comparison of peak torque production in COL6-RD, DMD and control groups. (B) Comparison of peak torque normalized to Non-Fat area between COL6-RD, DMD and control groups. *significantly different between DMD and COL6-RD at p < 0.05. +Significantly different from control at p < 0.05. COL6-RD- Collagen VI related dystrophy, DMD- Duchenne Muscular Dystrophy, KE – Knee extensors, PF – Plantar Flexors.
Functional performance
Patients with COL6-RD required significantly more time to complete timed performance tasks compared to the controls (Table 3). Ability to perform all the timed performance tasks was significantly decreased in patients with DMD and those with COL6-RD when compared to their control counterparts (Table 4). When comparing patients with DMD to those with COL6-RD, patients with COL6-RDs performed significantly better than DMD (Table 4). In comparison to patients with COL6-RD, only 50% of patients with DMD were able to complete all timed performance tasks.
Table 4.
Comparison of timed performance test between COL6-RD, DMD and control groups
| CONTROL | COL6-RD | DMD | |
|---|---|---|---|
| Climbing 4 Stairs (sec) | 1.5 ± 0.3 | 3.6 ± 1.4++ | 7.6 ± 5.7++* |
| 10m walk/run (sec) | 3.1 ± 0.4 | 5.9 ± 1.6++ | 10.6 ± 6.2++* |
| Supine to Stand (sec) | 1.9 ± 0.5 | 8.4 ± 3.3++ | 6.4 ± 0.6++ |
| Six min walk (m) | 547.0 ± 79.2 | 423.3 ± 95.7+ | 292.0 ± 123.5++* |
significantly different from control at p < 0.05;
significantly different from controls at p < 0.01;
significantly different from COL6-RD at p < 0.05;
COL6-RD- Collagen VI related dystrophy, DMD- Duchenne Muscular Dystrophy.
DISCUSSION
This study provides quantitative insight into previously confirmed qualitative muscle MRI findings of a classically associated pattern of muscle involvement in COL6-RDs. Furthermore, this study also demonstrates the ability of MR to differentiate between two different forms of muscular dystrophy on a morphological as well as functional level, pointing to fundamentally different mechanisms of disease causation. Patients with COL6-RD presented with striking muscle atrophy in comparison to patients with DMD; yet, those with COL6-RD performed functional tasks significantly better and demonstrated higher force production in lower extremities than in age-matched patients with DMD.
As reported previously, fatty infiltration in highly involved muscles of COL6-RDs demonstrate the specific pattern which are a hallmark of these conditions, including a “sandwich” and a “rim” [6, 13, 40] except for the RF where a high-intensity area around the prominent fascia in the middle of the muscle gives rise to a “central shadow” or “target” [13, 40] (Fig. 1). In contrast, patients with DMD were noted to have a diffuse pattern of fatty tissue deposition throughout the muscle that increased with disease progression (Fig. 2). Following qualitative findings, quantitatively, both COL6RD and DMD, presented with increased MRI T2 and FF in COL6-RD patients when compared to the control group. These findings are similar to previous results from our lab showing increased FF in a large cohort of DMD and COL6-RD patients (Triplett et al., 2014) [31]. Thus, using quantitative rather than qualitative measures for both fatty infiltration and muscle damage across different lower leg muscles, we provide objective MR tools for following COL6-RD disease progression longitudinally.
MRI analysis revealed that among all the three groups, patients with COL6-RD presented with the highest degree of muscle atrophy. It has been reported that early myofiber atrophy presents prior to the appearance of more overtly dystrophic findings in muscle biopsies from COL6-RD patients [1]; however, the exact pathophysiology of COL6-RD is not fully understood. Defects in cell growth, myofiber apoptosis, defective autophagy and protein turnover have all been identified as potential contributors to the development of muscle atrophy in the mouse model of COL6-RD as well as in patients with COL6-RD [32–36]. Other potential contributors to the pathophysiology of the COL6-RDs include changes in calpain 3 and nuclear factor-kB signaling [35] as well as the satellite cell niche resulting in limited regeneration [36].
Muscle quality along with muscle mass is known to play a critical role in maintaining strength and functional abilities in dystrophies [9, 37] and sarcopenia [38]. Patients with COL6-RD in this study presented with atrophied muscles and had both lower force production (strong correlation was found between non-fat area of the muscle and total force produced; data not shown) and a decreased ability to perform timed performance tasks in comparison to an unaffected (control) population. Interestingly, when comparing muscle quality between DMD and COL6 RD patients, it appears that the muscles in patients with COL6-RD have a higher capacity to generate force. Similar to our results here comparing COL6-RDs and DMD, a previous study, examining the less severe form of DMD, Becker muscular dystrophy (BMD), to a form of limb-girdle muscular dystrophy (LGMD2I), reported less torque in BMD than in LGMD2I, albeit with a higher non-fat area [39]. Based on previous findings in BMD and our conclusions in DMD, a possible explanation for the lower force production albeit higher non-fat area can be attributed to the disruption of the dystrophin-glycoprotein complex (DGC), which acts as a connection between sarcolemma and muscle contraction machinery [39]. This disruption can lead to impairment of various other factors that are important in force production such as displaced nNOS [40, 41], a lack of sarcolemma integrity due to lack of dystrophin [42] and the inability to transfer force laterally in dystrophic muscles [43]. The COL6-RDs, on the other hand, are extracellular matrix diseases which maintain an intact DGC complex, and thus collagen VI deficiency may have a more indirect effect on the integrity of muscle fibers. A study examining the force production in COL6A3 deficient mice found a reduction in both absolute and specific force and a decline in specific force was enhanced because of reduced muscle weight albeit intact DGC complex [44]. In fact, since the collagen VI protein is produced by interstitial muscle fibroblasts, COL6-RDs is a cell-non-autonomous muscular dystrophy [45]. These factors in combination could potentially explain lower specific force production in patients with DMD when compared to patients with COL6-RD.
CONCLUSION
The current study provides insight into the effect of disease on skeletal muscle in patients with COL6-RDs, a congenital muscular dystrophy subtype, and its comparison to DMD using quantitative MRI/MRS in addition to strength and functional measures. It should be emphasized that the current study focused only on milder patients with COL6-RD and does not include patients with the more severe COL6-RD phenotype of Ullrich congenital muscular dystrophy (UCMD). Findings from this current study underlie the importance of muscle MRI/MRS as a potential noninvasive marker to monitor and differentiate the effect of disease pathology on skeletal muscle in different muscular dystrophies and also highlight muscle MRI/MRS as a possible outcome measure in clinical trials. Future studies can build upon this study to quantify the disease progression in the more severe form of COL6-RD and also help to improve our understanding of the mechanisms underlying the loss of strength in different forms of muscular dystrophies.
ACKNOWLEDGMENTS
We would like to thank the all the participants for their participation in the study. The work and first author were supported by Senator Paul D. Well-stone Muscular Dystrophy Cooperative Research Center Grant (NIAMS: U54AR052646) and intramural funds of the National Institute of Neurologic Disorders and Stroke, National Institutes of Health (CGB).
Footnotes
CONFLICT OF INTERESTS
The authors declare that they have no conflict of interests.
REFERENCES
- [1].Bönnemann CG. The collagen VI-related myopathies: Muscle meets its matrix. Nature Reviews Neurology. 2011;7(7):379–90. [DOI] [PMC free article] [PubMed] [Google Scholar]
- [2].Lampe AK, Bushby KMD. Collagen VI related muscle disorders. J Med Genet. 2005;42(9):673–85. [DOI] [PMC free article] [PubMed] [Google Scholar]
- [3].Sookhoo S, MacKinnon I, Bushby K, Chinnery PF, Birchall D. MRI for the demonstration of subclinical muscle involvement in muscular dystrophy. Clinical Radiology. 2007;62(2):160–5. [DOI] [PubMed] [Google Scholar]
- [4].Dastgir J, Rutkowski A, Alvarez R, Cossette SA, Yan K, Hoffmann RG, et al. Common Data Elements for Muscle Biopsy Reporting. Archives of Pathology & Laboratory Medicine. 2015;140(1):51–65. [DOI] [PMC free article] [PubMed] [Google Scholar]
- [5].McDonald CM, Henricson EK, Abresch RT, Florence JM, Eagle M, Gappmaier E, et al. THE 6-minute walk test and other endpoints in Duchenne muscular dystrophy: Longitudinal natural history observations over 48 weeks from a multicenter study. Muscle & Nerve. 2013;48(3):343–56. [DOI] [PMC free article] [PubMed] [Google Scholar]
- [6].Mazzone ES, Messina S, Vasco G, Main M, Eagle M, D’Amico A, et al. Reliability of the North Star Ambulatory Assessment in a multicentric setting. Neuromuscular Disorders. 2009;19(7):458–61. [DOI] [PubMed] [Google Scholar]
- [7].Mazzone ES, Vasco G, Palermo C, Bianco F, Galluccio C, Ricotti V, et al. A critical review of functional assessment tools for upper limbs in Duchenne muscular dystrophy. Developmental Medicine & Child Neurology. 2012;54(10):879–85. [DOI] [PubMed] [Google Scholar]
- [8].Pane M, Mazzone ES, Fanelli L, De Sanctis R, Bianco F, Sivo S, et al. Reliability of the Performance of Upper Limb assessment in Duchenne muscular dystrophy. Neuromuscul Disord. 2014;24(3):201–6. [DOI] [PubMed] [Google Scholar]
- [9].Mathur S, Lott DJ, Senesac C, Germain SA, Vohra RS, Sweeney HL, et al. Age-Related Differences in Lower-Limb Muscle Cross-Sectional Area and Torque Production in Boys With Duchenne Muscular Dystrophy. Archives of Physical Medicine and Rehabilitation. 2010;91(7):1051–8. [DOI] [PMC free article] [PubMed] [Google Scholar]
- [10].Lerario A, Bonfiglio S, Sormani M, Tettamanti A, Marktel S, Napolitano S, et al. Quantitative muscle strength assessment in duchenne muscular dystrophy: Longitudinal study and correlation with functional measures. BMC Neurology. 2012;12(1):91. [DOI] [PMC free article] [PubMed] [Google Scholar]
- [11].Meilleur KG, Jain MS, Hynan LS, Shieh C-Y, Kim E, Waite M, et al. Results of a two-year pilot study of clinical outcome measures in collagen VI- and laminin alpha2-related congenital muscular dystrophies. Neuromuscular Disorders. 2015;25(1):43–54. [DOI] [PMC free article] [PubMed] [Google Scholar]
- [12].Gozal D Pulmonary manifestations of neuromuscular disease with special reference to Duchenne muscular dystrophy and spinal muscular atrophy. Pediatr Pulmonol. 2000;29(2):141–50. [DOI] [PubMed] [Google Scholar]
- [13].Mayer OH, Finkel RS, Rummey C, Benton MJ, Glanzman AM, Flickinger J, et al. Characterization of pulmonary function in Duchenne Muscular Dystrophy. Pediatr Pulmonol. 2015;50(5):487–94. [DOI] [PMC free article] [PubMed] [Google Scholar]
- [14].Vohra RS, Lott D, Mathur S, Senesac C, Deol J, Germain S, et al. Magnetic Resonance Assessment of Hypertrophic and Pseudo-Hypertrophic Changes in Lower Leg Muscles of Boys with Duchenne Muscular Dystrophy and Their Relationship to Functional Measurements. PLOS ONE. 2015;10(6):e0128915. [DOI] [PMC free article] [PubMed] [Google Scholar]
- [15].Fu J, Zheng Y-M, Jin S-Q, Yi J-F, Liu X-J, Lyn H, et al. “Target” and “Sandwich” Signs in Thigh Muscles have High Diagnostic Values for Collagen VI-related Myopathies. Chin Med J (Engl). 2016;129(15):1811–6. [DOI] [PMC free article] [PubMed] [Google Scholar]
- [16].Mercuri E, Lampe A, Allsop J, Knight R, Pane M, Kinali M, et al. Muscle MRI in Ullrich congenital muscular dystrophy and Bethlem myopathy. Neuromuscular Disorders. 2005;15(4):303–10. [DOI] [PubMed] [Google Scholar]
- [17].Mercuri E, Pichiecchio A, Allsop J, Messina S, Pane M, Muntoni F. Muscle MRI in inherited neuromuscular disorders: Past, present, and future. Journal of Magnetic Resonance Imaging. 2007;25(2):433–40. [DOI] [PubMed] [Google Scholar]
- [18].Willcocks RJ, Rooney WD, Triplett WT, Forbes SC, Lott DJ, Senesac CR, et al. Multicenter prospective longitudinal study of magnetic resonance biomarkers in a large duchenne muscular dystrophy cohort. Ann Neurol. 2016;79(4):535–47. [DOI] [PMC free article] [PubMed] [Google Scholar]
- [19].Mercuri E, Clements E, Offiah A, Pichiecchio A, Vasco G, Bianco F, et al. Muscle magnetic resonance imaging involvement in muscular dystrophies with rigidity of the spine. Ann Neurol. 2010;67(2):201–8. [DOI] [PubMed] [Google Scholar]
- [20].Forbes SC, Walter GA, Rooney WD, Wang DJ, DeVos S, Pollaro J, et al. Skeletal muscles of ambulant children with Duchenne muscular dystrophy: Validation of multicenter study of evaluation with MR imaging and MR spectroscopy. Radiology. 2013;269(1):198–207. [DOI] [PMC free article] [PubMed] [Google Scholar]
- [21].Willcocks RJ, Arpan IA, Forbes SC, Lott DJ, Senesac CR, Senesac E, et al. Longitudinal measurements of MRIT2 in boys with Duchenne muscular dystrophy: Effects of age and disease progression. Neuromuscular Disorders. 2014;24(5):393–401. [DOI] [PMC free article] [PubMed] [Google Scholar]
- [22].Forbes SC, Walter GA, Rooney WD, Wang D-J, DeVos S, Pollaro J, et al. Skeletal Muscles of Ambulant Children with Duchenne Muscular Dystrophy: Validation of Multicenter Study of Evaluation with MR Imaging and MR Spectroscopy. Radiology. 2013:121948. [DOI] [PMC free article] [PubMed] [Google Scholar]
- [23].Triplett WT, Baligand C, Forbes SC, Willcocks RJ, Lott DJ, DeVos S, et al. Chemical shift-based MRI to measure fat fractions in dystrophic skeletal muscle. Magnetic Resonance in Medicine. 2013. [DOI] [PMC free article] [PubMed] [Google Scholar]
- [24].Md AR, Md LS, Osman Ratib Md P. OsiriX: An Open-Source Software for Navigating in Multidimensional DICOM Images. Journal of Digital Imaging. 2004;17(3):205–16. [DOI] [PMC free article] [PubMed] [Google Scholar]
- [25].Tustison NJ, Avants BB, Cook PA, Zheng Y, Egan A, Yushkevich PA, et al. N4ITK: Improved N3 bias correction. IEEE Trans Med Imaging. 2010;29(6):1310–20. [DOI] [PMC free article] [PubMed] [Google Scholar]
- [26].Akima H, Lott D, Senesac C, Deol J, Germain S, Arpan I, et al. Relationships of thigh muscle contractile and noncontractile tissue with function, strength, and age in boys with Duchenne muscular dystrophy. Neuromuscular Disorders. 2012;22(1):16–25. [DOI] [PMC free article] [PubMed] [Google Scholar]
- [27].Lott DJ, Forbes SC, Mathur S, Germain SA, Senesac CR, Lee Sweeney H, et al. Assessment of intramuscular lipid and metabolites of the lower leg using magnetic resonance spectroscopy in boys with Duchenne muscular dystrophy. Neuromuscular Disorders. 2014;24(7):574–82. [DOI] [PMC free article] [PubMed] [Google Scholar]
- [28].Arpan I, Willcocks RJ, Forbes SC, Finkel RS, Lott DJ, Rooney WD, et al. Examination of effects of corticosteroids on skeletal muscles of boys with DMD using MRI and MRS. Neurology. 2014;83(11):974–80. [DOI] [PMC free article] [PubMed] [Google Scholar]
- [29].McDonald CM, Abresch RT, Carter GT, Fowler WM, Johnson ER, Kilmer DD, et al. Profiles of neuromuscular diseases. Duchenne muscular dystrophy. Am J Phys Med Rehabil. 1995;74(5 Suppl):S70–92. [DOI] [PubMed] [Google Scholar]
- [30].McDonald CM, Henricson EK, Han JJ, Abresch RT, Nicorici A, Elfring GL, et al. The 6-minute walk test as a new outcome measure in Duchenne muscular dystrophy. Muscle & Nerve. 2010;41(4):500–10. [DOI] [PubMed] [Google Scholar]
- [31].Triplett WT, Baligand C, Forbes SC, Willcocks RJ, Lott DJ, DeVos S, et al. Chemical shift-based MRI to measure fat fractions in dystrophic skeletal muscle. Magn Reson Med. 2013;72(1):8–19. [DOI] [PMC free article] [PubMed] [Google Scholar]
- [32].Grumati P, Coletto L, Sabatelli P, Cescon M, Angelin A, Bertaggia E, et al. Autophagy is defective in collagen VI muscular dystrophies, and its reactivation rescues myofiber degeneration. Nat Med. 2010;16(11):1313–20. [DOI] [PubMed] [Google Scholar]
- [33].Grumati P, Coletto L, Schiavinato A, Castagnaro S, Bertaggia E, Sandri M, et al. Physical exercise stimulates autophagy in normal skeletal muscles but is detrimental for collagen VI-deficient muscles. Autophagy. 2011;7(12):1415–23. [DOI] [PMC free article] [PubMed] [Google Scholar]
- [34].Atkinson JC, Rühl M, Becker J, Ackermann R, Schuppan D. Collagen VI Regulates Normal and Transformed Mesenchymal Cell Proliferation in Vitro. Experimental cell research. 1996;228(2):283–91. [DOI] [PubMed] [Google Scholar]
- [35].Paco S, Ferrer I, Jou C, Cusí V, Corbera J, Torner F, et al. Muscle Fiber Atrophy and Regeneration Coexist in Collagen VI-Deficient Human Muscle: Role of Calpain-3 and Nuclear Factor-κB Signaling. Journal of Neuropathology & Experimental Neurology. 2012;71(10):894–906. [DOI] [PubMed] [Google Scholar]
- [36].Urciuolo A, Quarta M, Morbidoni V, Gattazzo F, Molon S, Grumati P, et al. Collagen VI regulates satellite cell self-renewal and muscle regeneration. Nat Commun. 2013;4:1964. [DOI] [PMC free article] [PubMed] [Google Scholar]
- [37].Wokke BH, van den Bergen JC, Versluis MJ, Niks EH, Milles J, Webb AG, et al. Quantitative MRI and strength measurements in the assessment of muscle quality in Duchenne muscular dystrophy. Neuromuscul Disord. 2014;24(5):409–16. [DOI] [PubMed] [Google Scholar]
- [38].Moore AZ, Caturegli G, Metter EJ, Makrogiannis S, Resnick SM, Harris TB, et al. Difference in muscle quality over the adult life span and biological correlates in the Baltimore Longitudinal Study of Aging. J Am Geriatr Soc. 2014;62(2):230–6. [DOI] [PMC free article] [PubMed] [Google Scholar]
- [39].Løkken N, Hedermann G, Thomsen C, Vissing J. Contractile properties are disrupted in Becker muscular dystrophy, but not in limb girdle type 2I. Annals of Neurology. 2016. [DOI] [PubMed] [Google Scholar]
- [40].Kobayashi YM, Rader EP, Crawford RW, Iyengar NK, The-dens DR, Faulkner JA, et al. Sarcolemma-localized nNOS is required to maintain activity after mild exercise. Nature. 2008;456(7221):511–5. [DOI] [PMC free article] [PubMed] [Google Scholar]
- [41].Percival JM, Whitehead NP, Adams ME, Adamo CM, Beavo JA, Froehner SC. Sildenafil reduces respiratory muscle weakness and fibrosis in the mdx mouse model of Duchenne muscular dystrophy. J Pathol. 2012;228(1):77–87. [DOI] [PMC free article] [PubMed] [Google Scholar]
- [42].Lovering RM, Deyne PGD. Contractile function, sarcolemma integrity, and the loss of dystrophin after skeletal muscle eccentric contraction-induced injury. American Journal of Physiology - Cell Physiology. 2004;286(2):C230–C8. [DOI] [PMC free article] [PubMed] [Google Scholar]
- [43].Ramaswamy KS, Palmer ML, van der Meulen JH, Renoux A, Kostrominova TY, Michele DE, et al. Lateral transmission of force is impaired in skeletal muscles of dystrophic mice and very old rats. The Journal of Physiology. 2011;589(5):1195–208. [DOI] [PMC free article] [PubMed] [Google Scholar]
- [44].Pan TC, Zhang RZ, Markova D, Arita M, Zhang Y, Bogdanovich S, et al. COL6A3 protein deficiency in mice leads to muscle and tendon defects similar to human collagen VI congenital muscular dystrophy. J Biol Chem. 2013;288(20):14320–31. [DOI] [PMC free article] [PubMed] [Google Scholar]
- [45].Zou Y, Zhang RZ, Sabatelli P, Chu ML, Bonnemann CG. Muscle interstitial fibroblasts are the main source of collagen VI synthesis in skeletal muscle: Implications for congenital muscular dystrophy types Ullrich and Bethlem. J Neuropathol Exp Neurol. 2008;67(2):144–54. [DOI] [PubMed] [Google Scholar]


