Abstract
Organs consist of multiple cell types that ensure proper architecture and function. How different cell types coexist and interact to maintain their homeostasis in vivo remains elusive. The skin epidermis comprises mostly epithelial cells, but also harbours Langerhans cells (LCs) and dendritic epidermal T cells (DETCs). Whether and how distributions of LCs and DETCs are regulated during homeostasis is unclear. Here, by tracking individual cells in the skin of live adult mice over time, we show that LCs and DETCs actively maintain a non-random spatial distribution despite continuous turnover of neighbouring basal epithelial cells. Moreover, the density of epithelial cells regulates the composition of LCs and DETCs in the epidermis. Finally, LCs require the GTPase Rac1 to maintain their positional stability, density and tiling pattern reminiscent of neuronal self-avoidance. We propose that these cellular mechanisms provide the epidermis with an optimal response to environmental insults.
The skin epidermis is the outermost layer of the human body and acts as a barrier to protect from the environment. The epidermis is composed mainly of epithelial cells, which are continuously replenished by epithelial stem cells that reside in the basal layer1-6. These basal epithelial cells are closely intermingled with two main populations of skin-resident immune cells, LCs and DETCs7-9. Many studies have advanced our understanding of the immunological functions of skin-resident immune cells during injury or inflammation, as well as of the signalling supporting their surveillance role in the epidermis10-20. Additionally, previous work has also captured immune cells actively surveilling the surface of the skin epidermis21-27. Nevertheless, it is not known how these skin-resident immune cells regulate their homeostasis within the continuously regenerating epidermis, and to what extent the dynamic behaviours of these diverse cell types are coordinated.
Results
LCs and DETCs maintain their positions despite turnover of epithelial cells.
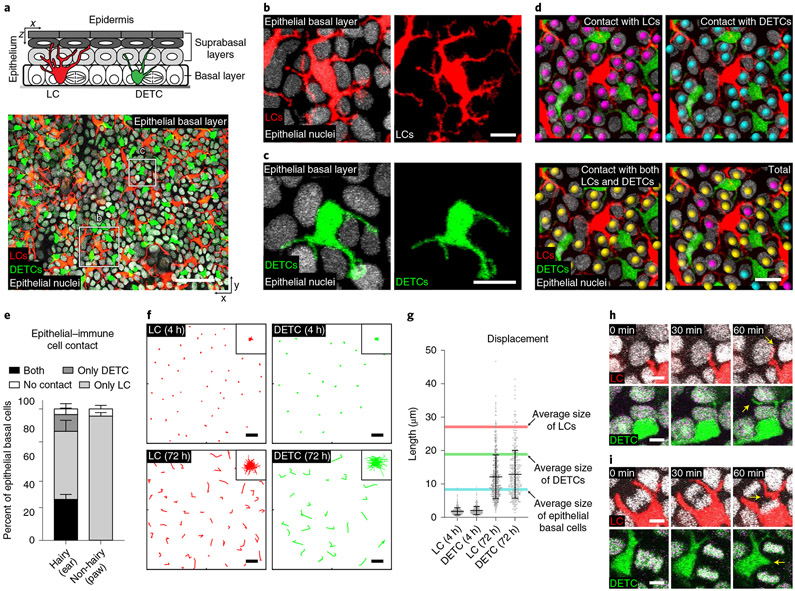
To investigate the behaviours of LCs and DETCs in the presence of epithelial cells in live mice, we developed a mouse line in which the three main cell types in the skin epidermis are labelled with distinct fluorescent markers (Fig. 1a) These mice contain a CD207-CreER;Rosa-stop-tdTomato reporter28,29 (the human CD207 and mouse Cd207 genes are hereafter referred to as huLangerin and Langerin, respectively) that labels LCs with tdTomato after tamoxifen injection. In addition, the mice express GFP under the control of the Cx3cr1 promoter30, which labels DETCs in the epidermis, as well as histone H2B–Cerulean31,32 under the control of the Krt14 promoter (hereafter K14), which labels all epithelial stem cell nuclei and derived lineages. We used our previously established intravital imaging approach33,34 to visualize all three populations (LCs, DETCs and epithelial cells). By acquiring image stacks along the whole apical–basal axis of the epidermis, we revealed that LCs and DETCs are embedded within the basal layer of the epidermis (Fig. 1a-c and Supplementary Video 1). The dendritic radial morphology of these immune cells prompted us to investigate how many epithelial basal cells they contact. To this end, we quantified the immune cell–epithelial basal cell contacts in skin from different parts of the mouse: the ear, which harbours LCs and DETCs; and the paw, which harbours only LCs. In both regions, nearly all epithelial basal cells were in contact with either LCs and/or DETCs. This reveals that LCs and DETCs extensively cover the basal layer (Fig. 1d,e).
Fig. 1 ∣. LCs and DETCs maximally cover and adapt to changes of neighbouring epithelial basal cells during homeostasis.
a, Top: schematic of mouse epidermis with the basal layer highlighted in grey. Bottom: x–y view of the basal layer containing LCs (red), DETCs (green) and epithelial basal cells. Bottom: Representative x–z views from three mice. Red, LCs (huLangerin-CreER;Rosa-stop-tdTomato); green, DETCs (CX3CR1-GFP+/−); white, nuclei of epithelial cells (K14-H2B-Cerulean). Scale bar, 50μm. b,c, LCs (b) and DETCs (c) embed between epithelial basal cell neighbours. Red, LCs (huLangerin-CreER;Rosa-stop-tdTomato); green, DETCs (CX3CR1-GFP+/−); white, nuclei of epithelial cells (K14-H2B-Cerulean). Representative images from three mice. Scale bars, 10 μm. d, Direct contact of epithelial basal cells (K14-H2B-Cerulean) with LCs (huLangerin-CreER;Rosa-stop-tdTomato) (magenta spheres), DETCs (CX3CR1-GFP+/−) (cyan spheres) and with both LCs and DETCs (yellow spheres). Representative images from 3 mice; scale bar, 20 μm. e, Quantification of cell–cell contacts between basal epithelial cell nuclei and LCs only, DETCs only, both LCs and DETCs or neither (n = 3 mice for each). Data are percentage ±s.d. f, Displacement track analysis of individual LCs (red) and DETCs (green). Top row: 4 h time lapse; bottom row: reimaging the same area every 24 h for 3 days. Representative images from three mice. Insets in top right corner show overlay of all individual tracks (rose plots), which represent the collective displacement of all tracked LCs and DETCs. Scale bars, 20 μm. g, Quantification length of displacement tracks. Data are mean ±s.d. with individual data points. Average size of cells is shown: red line, LCs (27.07 μm, n = 574 cells from 3 mice); green line, DETCs (18.86 μm, n = 390 cells from 3 mice); blue line, epithelial basal cells (8.30 μm, n = 600 cells from 3 mice). h,i, Time-lapse images show that the dendrites of LCs and DETCs explore junctional spaces with neighbouring epithelial basal cells: non-dividing (h) and dividing (i) cells. Red, LCs (huLangerin-CreER;Rosa-stop-tdTomato); green, DETCs (CX3CR1-GFP+/−); white, nuclei of epithelial cells (K14-H2B-Cerulean). Representative images from 3 mice; scale bars, 5 μm.
Epithelial stem cells continuously remodel the basal layer, increasing cell number by cell division and decreasing cell number by differentiation and delamination. Each cell undergoes one of these behaviours every 2.5 days on average34. To examine how LCs and DETCs behave in these dynamic basal epithelial environments, we followed the same immune cells over time by recording time-lapse images for 4 h and by reimaging the same area every 24 h over 3 days (refs. 33,35,36). We analysed their movements by plotting tracks of their displacement over time, and observed that the cell bodies of both LCs and DETCs move slowly over 72 h (Fig. 1f,g). Time-lapse imaging showed that, in contrast to their slowly moving cell bodies, the dendrites of both LCs and DETCs actively extend and retract between several of their basal epithelial cell neighbours and between newly formed junctional spaces, such as those between newly formed daughter cells following cell division (Fig. 1h,i and Supplementary Video 2). Together, these data suggest that LCs and DETCs maintain overall positional stability over time. They do so by slowly adjusting the location of the cell body in response to the remodelling of the basal epithelial cell neighbourhood, while constantly exploring this changing stem cell environment with dynamic dendritic movements.
Epithelial cell density regulates immune cell density.
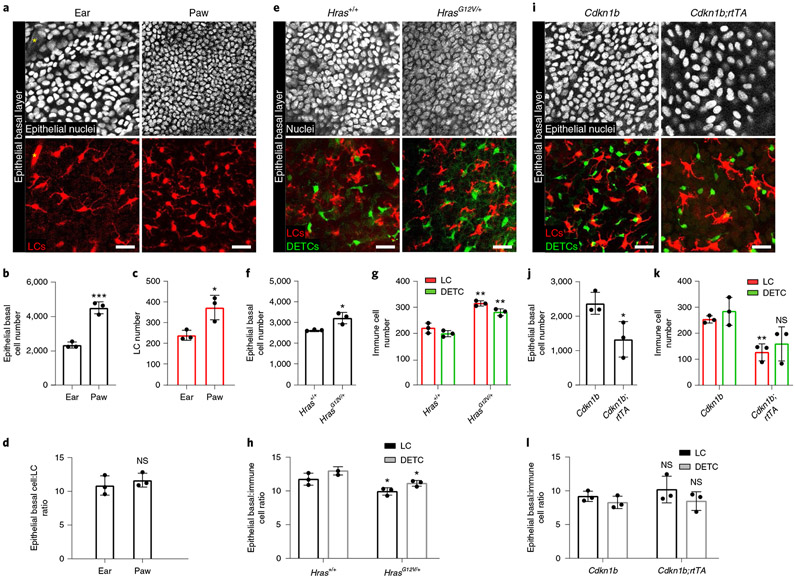
Given the extensive direct contact between LCs and DETCs and epithelial cells in the basal layer, we investigated whether their densities were coordinated. We first looked at skin at the ear and paw, which harbour distinct epithelial densities34. Quantification across these regions showed that the density of LCs was higher in the paw compared to the ear, correlating to the increased density of epithelial basal cells in the paw (Fig. 2a-c). Interestingly, the ratio of LCs and epithelial basal cells was constant across the different skin regions (Fig. 2d).
Fig. 2 ∣. Immune cell density is regulated by epithelial basal cell density.
a, Epithelial and immune cell densities in ear and paw (representative of n = 3 mice). Top row: white, epithelial nuclei (K14-H2B-Cerulean); bottom row: red, LCs (huLangerin-CreER; Rosa-stop-tdTomato); asterisk, hair follicle. Scale bars, 30μm. b,c, Epithelial basal cell (b) and LC (c) numbers in 0.25 mm2 of ear and paw skin. *P = 0.0223 and ***P = 0.0006, unpaired, two-tailed Student’s t-test; n = 3 mice. Data are mean ± s.d. with individual data points. d, Ratio of epithelial basal cells to LCs in ear and paw. Unpaired two-tailed Student’s t-test; n = 3 mice. Data are mean ± s.d. with individual data points. e, Epithelial and immune cell densities in HrasG12V/+ (K14-CreER;CX3CR1-GFP+/−;HrasG12V/+) and Hras+/+ control (K14-CreER;CX3CR1-GFP+/−;Hras+/+) ear epidermal preps (representative of n = 3 mice). Top row: white, nuclei (DAPI); bottom row: red, LCs (anti-MHCII); green, DETCs (CX3CR1-GFP+/−). Scale bars, 30 μm. f,g, Epithelial basal cell number (f), and LC and DETC number (g) in 0.25 mm2 of skin from Hras+/+ and HrasG12V/+ mice. *P = 0.00212, **P = 0.0016 (LC) and **P = 0.0013 (DETC), unpaired two-tailed Student’s t-test; n = 3 mice per genotype. Data are mean ± s.d. with individual data points. h, Ratios of epithelial basal cells and immune cells in Hras+/+ and HrasG12V/+ mice. *P = 0.04 (LC) and *P = 0.0128 (DETC), unpaired two-tailed Student’s t-test; n = 3 mice per genotype. Data are mean ± s.d. with individual data points. i, Epithelial and immune cell densities in ear epidermis of Cdkn1b;K14-rtTA mice (huLangerin-CreER;Rosa-stop-tdTomato;CX3CR1-GFP+/−;K14-H2B-Cerulean;tetO-Cdkn1b;K14-rtTA) and Cdkn1b control mice (huLangerin-CreER; Rosa-stop-tdTomato;CX3CR1-GFP+/−;K14-H2B-Cerulean;tetO-Cdkn1b) at 3 days of doxycycline administration (n = 3 mice per genotype). Top row: white, epithelial nuclei (K14-H2B-Cerulean); bottom row: red, LCs (huLangerin-CreER;Rosa-stop-tdTomato); green, DETCs (CX3CR1-GFP+/−). Scale bars, 30μm. j,k, Epithelial basal cell number (j), and LC and DETC number (k) in 0.25 mm2 epidermis from Cdkn1b and Cdkn1b;rtTA mice. *P = 0.0407 and **P = 0.0035, unpaired two-tailed Student’s t-test; n = 3 mice per genotype. Data are mean ± s.d. with individual data points. l, Ratios of epithelial basal cells and immune cells in Cdkn1b and Cdkn1b;K14-rtTA mice. Unpaired two-tailed Student’s t-test; n = 3 mice per genotype; data are mean ± s.d. with individual data points.
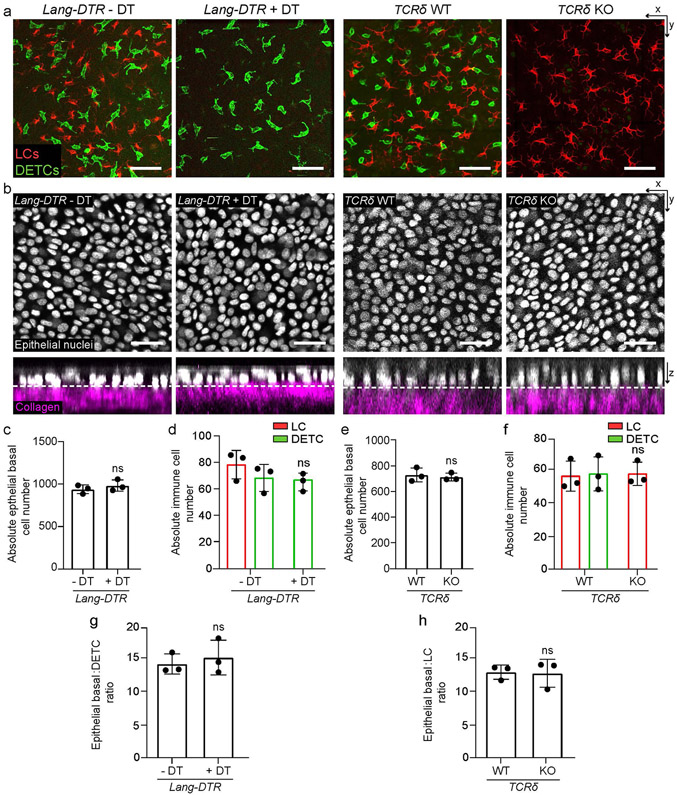
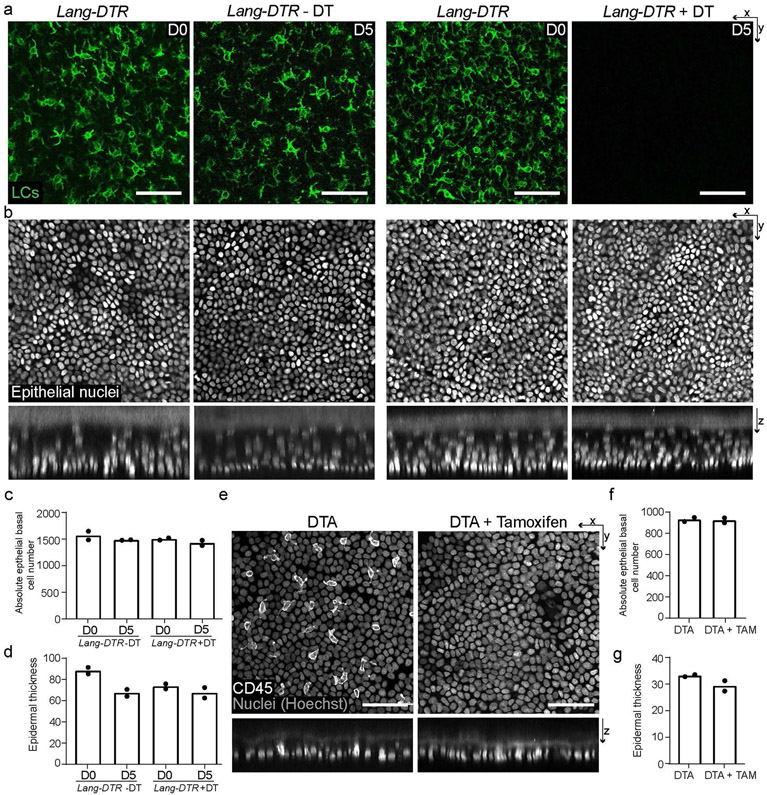
To test whether the relative numbers of epithelial basal cells, LCs and DETCs are regulated, we first genetically altered the density of LCs and DETCs. Specifically, we used an inducible diphtheria toxin model driven by the Langerin promoter to eliminate LCs (Langerin-diphtheria toxin receptor (Lang-DTR))37 and a null mouse model to eliminate DETCs38 (Tcrd knockout (KO)). The loss of either immune cell type did not affect the density of epithelial basal cells or the epidermal thickness of the ear or paw epidermis (Extended Data Fig. 1a-c,e and Extended Data Fig. 2a-d). Consistent with previous findings, we found that eliminating LCs had no effect on the density of DETCs in the ear and eliminating DETCs had no effect on the density of LCs39-41 (Extended Data Fig. 1d,f). In addition, the remaining subtype maintained a largely constant ratio relative to epithelial basal cells (Extended Data Fig. 1g,h). To probe this relationship in the context of depletion of both LCs and DETCs, we generated conditional mice in which both LCs and DETCs could be depleted simultaneously by inducible expression of diphtheria toxin (huLangerin-CreER;Tcrd-CreER; Rosa-GFP-stop-DTA)28,42,43. Although LCs and DETCs together constitute a sizeable cellular fraction of the epidermis, their depletion did not significantly affect epithelial basal density or epidermal thickness (Extended Data Fig. 2e-g). These data show that the densities of LCs and DETCs do not influence the density of epithelial basal cells or overall epidermal architecture.
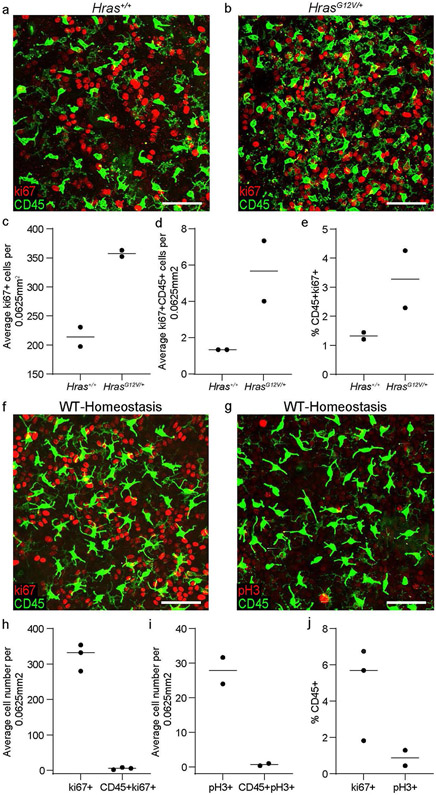
To investigate whether epithelial basal cell density regulates the density of LCs and DETCs, we altered the number of epithelial basal cells by either enhancing or blocking their proliferation. To increase epithelial basal cell density, we used a previously established genetic model with enhanced stem cell proliferation (K14-CreER;HrasG12V/+)44,45. The density of both LCs and DETCs increased to match the higher epithelial basal cell number within six weeks after induction with tamoxifen, thereby maintaining similar epithelial cell:immune cell ratios to those observed during homeostasis in wild-type mice (Fig. 2e-h and Extended Data Figs. 3a and 4a-j).
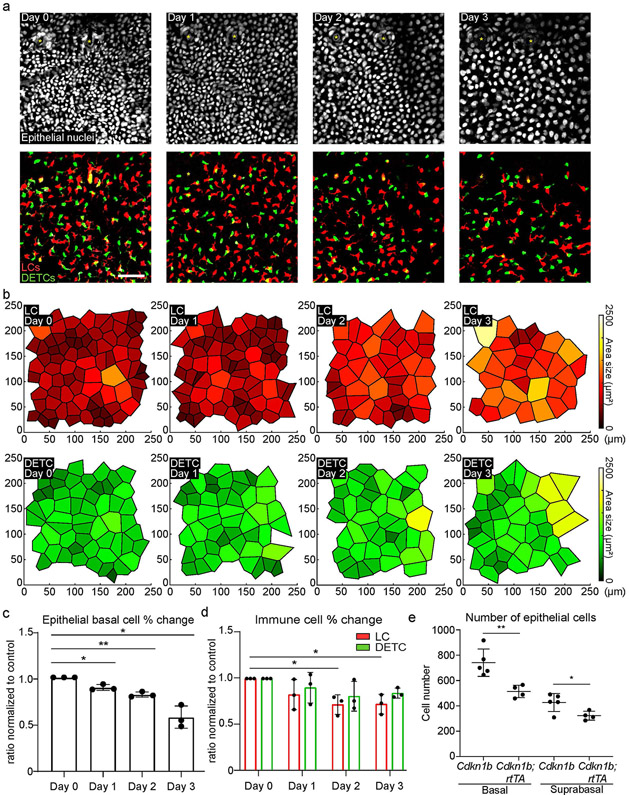
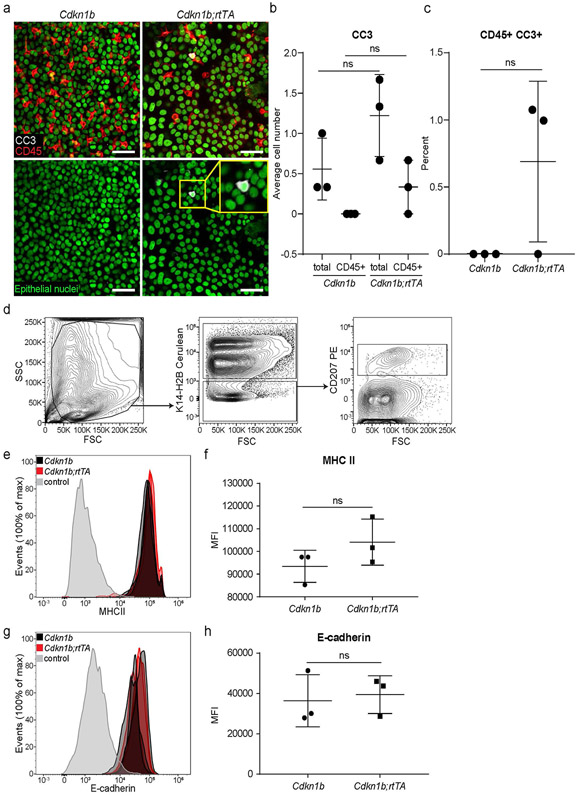
To decrease epithelial basal density, we used mice with a tet-inducible Cdkn1b (also known as p27) overexpression allele in epithelial stem cells (tetO-Cdkn1b;K14-rtTA)46,47. Doxycycline administration to these mice results in specific inhibition of basal stem cell proliferation and reduces their density in the epidermis31,44,48 within 1 day. We observed an immediate decrease in numbers of both LC and DETC leading to the maintenance of the ratios between epithelial basal cells and LCs or DETCs (Fig. 2i-l and Extended Data Figs. 3b,c, 5a-d and 6a-h). Notably, we observed a modest reduction in the number of all suprabasal cells at day 3 in the Cdkn1b;rtTA mice compared with controls (Extended Data Fig. 5e). Overall, these data indicate a unidirectional relationship by which the number of epithelial cells dictates the number of LCs and DETCs, and where this regulation is rapid and robust.
LCs and DETCs are organized in a tiling pattern.
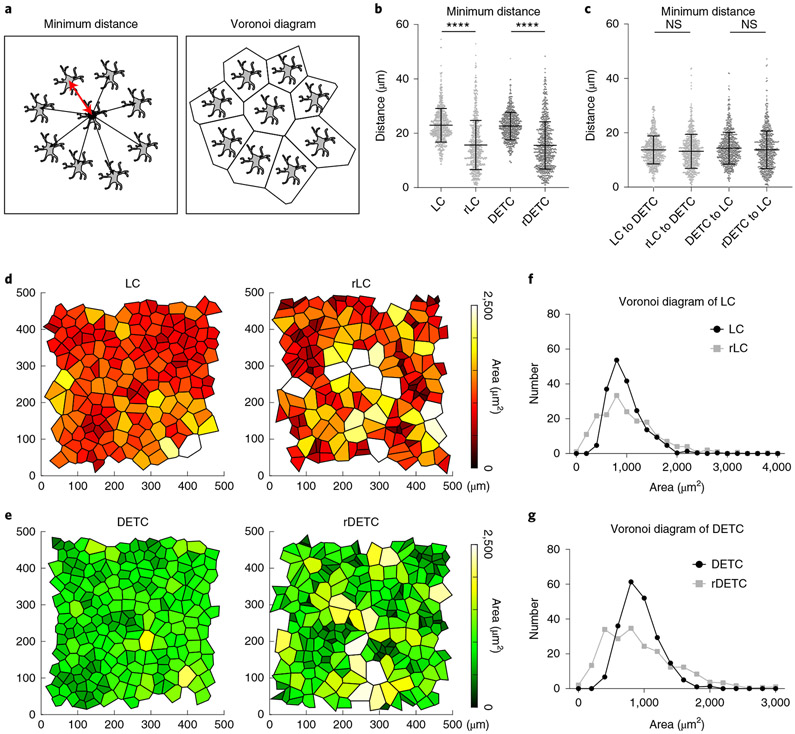
Having demonstrated the positional stability and regulation of density of LCs and DETCs, we next investigated how their organization is orchestrated at the population level. We used quantitative image analysis to examine the relative position of immune cells in the basal layer of the epidermis. We compared the distributions of LCs and DETCs with artificially computer-generated random distributions of the same type of immune cell. In addition, we measured the distance of each immune cell to its nearest neighbours and the area it occupied using Voronoi diagrams (Fig. 3a). Compared with the artificially generated random distributions, LCs and DETCs maintained a larger average minimum distance from other cells of the same subtype, which was further characterized by a tighter distribution around the mean (Fig. 3b). This indicates that LCs and DETCs are regularly and non-randomly distributed, consistent with observations of human LCs49,50.
Fig. 3 ∣. LCs and DETCs are organized in a tiled pattern.
a, Schematics of minimum distance and Voronoi diagram analyses used for quantification. b, The minimum distances between immune cells of the same type (that is, between LCs or between DETCs) were quantified as shown in a from experimental images and compared to artificially generated random distributions of LCs (rLC) or DETCs (rDETC). ****P < 0.0001, unpaired two-tailed Student’s t-test; n = 742 cells (LC, rLC) and n = 792 cells (DETC, rDETC) from 3 huLangerin-CreER;Rosa-stop-tdTomato;CX3CR1-GFP+/−;K14-H2B-Cerulean mice. Data are mean ± s.d. with individual data points. c, The minimum distance between LCs and DETCs was quantified from experimental images and compared to artificially generated random distributions, showing no significant difference. Unpaired, two-tailed Student’s t-test; n = 742 cells (LC to DETC, rLC to DETC) and n = 792 cells (DETC to LC, rDETC to LC); from 3 mice. Data are mean ± s.d. with individual data points. d,e, Voronoi diagrams were generated from the experimental images (left) and the random plots (right) to represent the area occupied by LCs (d) and DETCs (e). Total area is 0.25 mm2. Polygons are colour coded by area as indicated in the legend (representative images from three mice). f,g, Quantification of area occupied by LCs (f) and DETCs (g) from the Voronoi diagrams. Black, experimental images; grey, random distribution. n = 3 mice.
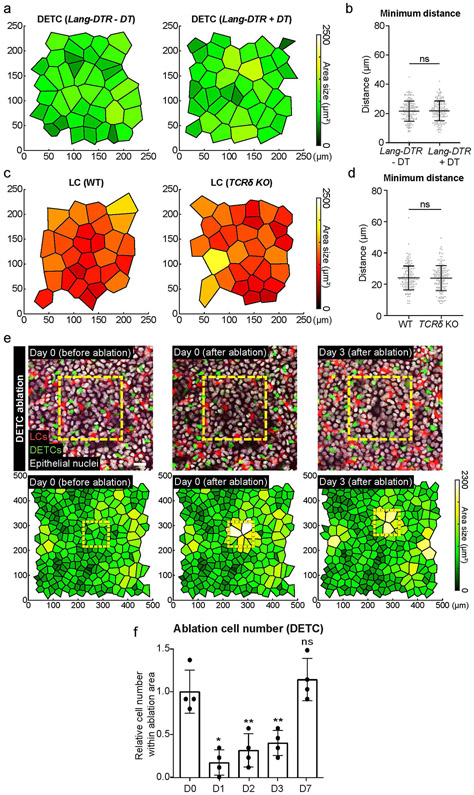
To determine whether the distribution of LCs is dependent on the distribution of DETCs and vice versa, we compared actual imaging coordinates of one immune population to actual or artificially generated random distributions of the other. This analysis showed that LCs and DETCs do not maintain a specific distance from each other (Fig. 3c). This corroborates the above findings that the depletion of LCs or DETCs does not influence the density or distribution of the remaining population (Extended Data Figs. 1a and 7a-d).
To further understand the global distribution of immune cells, we measured the area that each LC and DETC occupies using a Voronoi diagram. We found that the Voronoi diagrams of both LCs and DETCs revealed a more uniform and equal partitioning than those created using a set of artificially generated randomly positioned cells, reinforcing the regularity of these immune cell patterns (Fig. 3d-g). Together, these data indicate that LCs and DETCs are not randomly distributed in the epidermis and that the tiling patterns of LCs and DETCs are independently regulated.
LCs and DETCs actively maintain a regular pattern.
Our data show that LCs and DETCs maintain a relatively stable position and are regularly distributed during homeostasis of the regenerative epidermis. On the basis of these findings, we questioned how the loss of either LCs or DETCs would affect their respective patterns in the days following this loss. Given that newly generated cells would arrive only weeks later26,37,51-54, we hypothesized three scenarios: (1) the void left upon cell loss would persist because surviving LCs and DETCs maintain their initial positions; (2) the void would be filled by remaining LCs or DETCs to re-establish a pattern; or (3) the void would be filled by remaining LCs or DETCs without re-establishing a pattern. To explore these possibilities, we used two complementary approaches to eliminate LCs or DETCs and examined the response of surviving neighbouring immune cells.
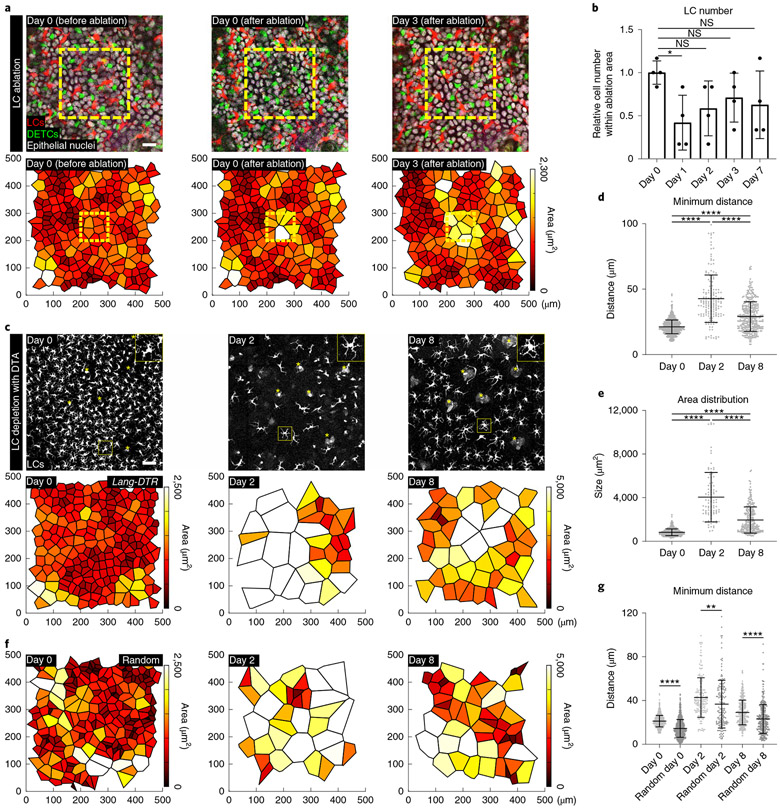
First, we used single-cell laser ablation to precisely eliminate a small population of LCs31,55 and tracked the surviving epidermal neighbouring LCs over the next few days. We found that LCs moved into the ablated region and established a regular pattern within the previously ablated regions (Fig. 4a,b). Moreover, using the same approach we found that DETCs behaved similarly (Extended Data Fig. 7e,f).
Fig. 4 ∣. Surviving LCs re-establish a regular pattern after loss of neighbouring LCs.
a, LCs in the area bound by the yellow line (100 μm × 100 μm) were ablated using a multiphoton laser (810 nm) and the same region was re-examined 3 days after the ablation. Top row: images from a mouse on day 0 (before and after ablation) and day 3 after ablation. Scale bar, 10 μm Bottom row: Voronoi diagram for LCs generated from the images at each time point. Total area, 0.25 mm2. Red, LCs (huLangerin-CreER;Rosa-stop-tdTomato); green, DETCs (CX3CR1-GFP+/−); white, nuclei of epithelial cells (K14-H2B-Cerulean); representative of n = 4 mice. b, LC number in the ablated region from day 1 to day 7 relative to the initial number at day 0 (before ablation). *P = 0.0436, paired two-tailed Student’s t-test; n = 4 mice. Data are mean ± s.d. with individual data points. c, A single dose of diphtheria toxin (2 ng per g body weight) was injected intraperitoneally into Lang-eGFP;Lang-DTR (Lang-DTR) mice for acute depletion of LCs. Top row: LCs (Lang-eGFP, white) in the basal layer at each imaged time point. Scale bar, 50 μm. Asterisk, hair follicle. Bottom row: Voronoi diagrams for LCs generated from images at each time point (n = 3 mice). d, Minimum distances between LCs at each time point (days 0, 2 and 8). ****P < 0.0001, unpaired two-tailed Student’s t-test; n = 903 (day 0), n = 162 (day 2) and n = 365 (day 8) cells from 3 mice. Data are mean ± s.d. with individual data points. e, Quantification of area from Voronoi diagrams of LCs at each time point. ****P < 0.0001, unpaired two-tailed Student’s t-test; n = 716 (day 0), n = 92 (day 2) and n = 258 (day 8) cells from 3 mice. Data are mean ± s.d. with individual data points. f, Voronoi diagrams generated from equal numbers of artificially generated random LC positions (n = 3). g, Minimum distance plots from d compared with equal numbers of artificially generated random positions. **P = 0.0070 and ****P < 0.0001, unpaired two-tailed Student’s t-test; n = 903 cells (day 0, Random day 0), n = 162 cells (day 2, random day 2) and n = 365 cells (day 8, random day 8) from 3 mice. Data are mean ± s.d. with individual data points.
To complement these findings, we also assessed how the loss of a much larger number of cells affects immune cell distribution by treating Lang-DTR mice with an acute dose of diphtheria toxin. Tracking of the same epidermal areas over time revealed gaps in the immune cell pattern at day 2 after treatment, and LCs did not recover in number55 by day 8 (Fig. 4c, top and Extended Data Fig. 8a). Importantly, the surviving LCs in the diphtheria toxin-treated Lang-DTR mice migrated and re-established a non-random pattern in the skin basal layer (Fig. 4c, bottom, d,e). We also compared the minimum distance of LCs at each of the time points to those of random distributions and found that at day 8, the LCs showed much less variation in their minimum distances to each other compared with artificially generated random distributions of LCs than at day 2, suggesting that their distribution was actively recovering (Fig. 4f,g and Extended Data Fig. 8b,c). Together, these results indicate that the loss of LCs and DETCs during homeostasis triggers a response from surviving, neighbouring immune cells to move into voided space and re-establish a homeostatic tiling pattern in the epidermis of adult mice.
LCs require RAC1 to maintain stability, density and pattern.
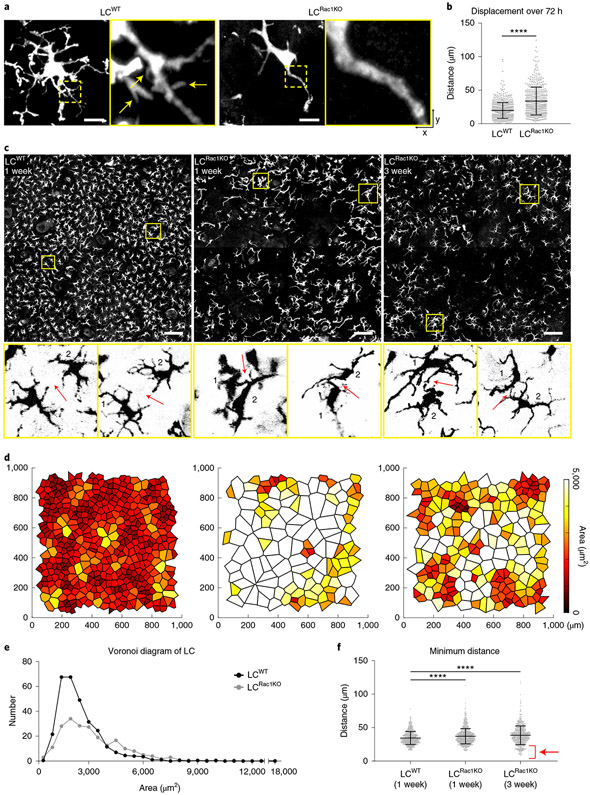
To define mechanisms underlying how LCs and DETCs actively maintain their tiling patterns and minimum distance, we targeted the actin remodelling molecule RAC1, a member of the Rho GTPase family56 and a regulator of dendrite development. In neuronal self-avoidance, dendrites arising from the same neuron do not overlap57,58. This striking parallel with LCs led us to hypothesize that dendrites may have a role in establishing their tiling pattern. Conditional loss of function of RAC1 in LCs (using Rac1fl/fl;huLangerin-CreER mice treated with tamoxifen; we refer to these LCs as LCRac1KO)28,59 resulted in a lack of LC dendritic radial organization and fewer dendritic branches, consistent with previous studies in neurons and dendritic cells56,60,61, as well as reduced LC density, which may be due to an initial increase in migration out of the epidermis62 (Fig. 5a and Extended Data Fig. 8a,d-g).
Fig. 5 ∣. RAC1 deficiency in LCs causes altered dendritic morphology, higher mobility and loss of patterning.
a, Rac1 is deleted specifically in LCs by treating huLangerin-CreER;Rosa-stop-tdTomato;Rac1fl/fl mice with 2 mg tamoxifen on 5 consecutive days. LCRac1KO lack dendritic radial morphology and fewer dendrites compared with control wild-type LCs (LCWT) when examined by Airyscan (3 mice per genotype). Scale bars, 10 μm. b, Revisit analysis showed that mean displacement of LCRac1KO was larger than that of LCWT 72 h after ablation, indicating that the change in distribution was not caused by the inability of LCRac1KO to migrate. Area quantified, 0.56 mm2. ****P < 0.0001, unpaired two-tailed Student’s t-test; n = 657 cells (LCWT) and n = 498 cells (LCRac1KO) from 3 mice per genotype. Data are mean ± s.d. with individual data points. c, Normal LC distribution is disrupted when LCs lack Rac1. LCs were examined 1 week after tamoxifen injection (middle); the effect persists 3 weeks after tamoxifen injection (right; 2 control mice and 3 Rac1 KO mice). Top row: LCs (huLangerin-CreER;Rosa-stop-tdTomato) in the basal layer (scale bar, 100 μm). Bottom row: magnified view, highlighting the distance between neighbouring LCs (arrows). d, Voronoi diagram for LCs generated from images in c. e, Quantification of area from Voronoi diagrams of LCWT and LCRac1KO 1 week after tamoxifen injection. 2 control mice and 3 Rac1 KO mice. f, Minimum distance between LCs for LCWT at week 1 and LCRac1KO at week 1 and week 3, showing that LCRac1KO lose the ability to maintain a consistent minimum distance from their neighbours (arrow). ****P < 0.0001, unpaired two-tailed Student’s t-test; 1 week: n = 798 cells (LCWT) and n = 893 cells (LCRac1KO); 3 weeks: n = 797 cells (LCRac1KO); 2 control mice and 3 Rac1 KO mice. Data are mean ± s.d. with individual data points.
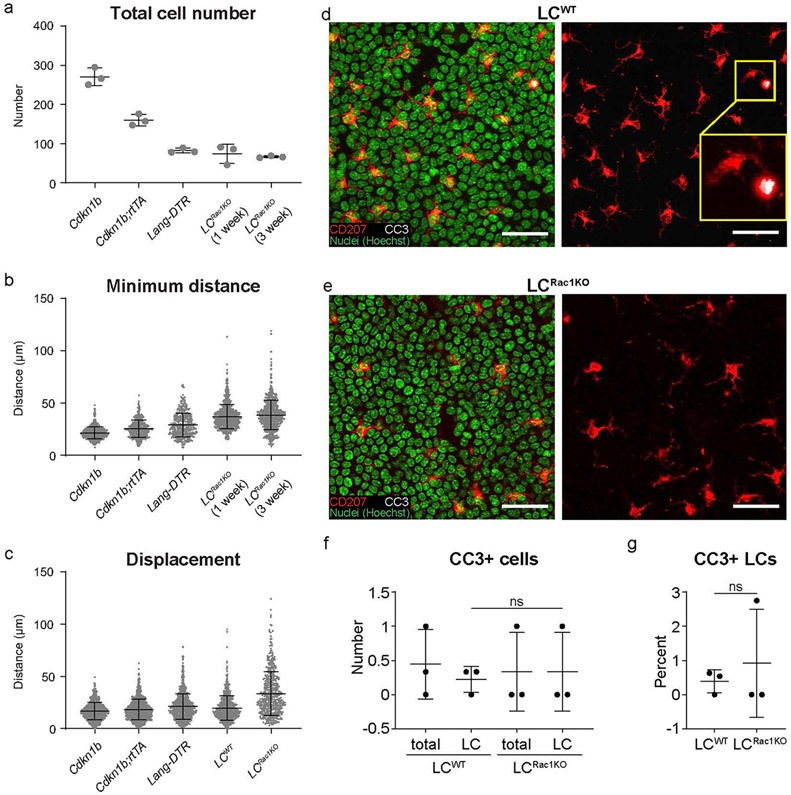
To investigate how Rac1 deletion affects positional stability, we performed time-lapse imaging and measured the relative displacement48,62 of LCRac1KO over 72 h. Whereas LCRac1KO had similar slow migratory speeds to wild-type LCs (4 h; Supplementary Video 3), they showed larger displacements compared with wild-type LCs or LCs in genetic models with similarly reduced LC density (72 h; Fig. 5b and Extended Data Fig. 8c). These results indicate that a conditional loss of RAC1 function in LCs does not compromise their migration but disrupts their apparently stable positioning in the epidermis. These data suggest that RAC1, and potentially dendrites, are important to constrain the movement of LCs in the epidermis.
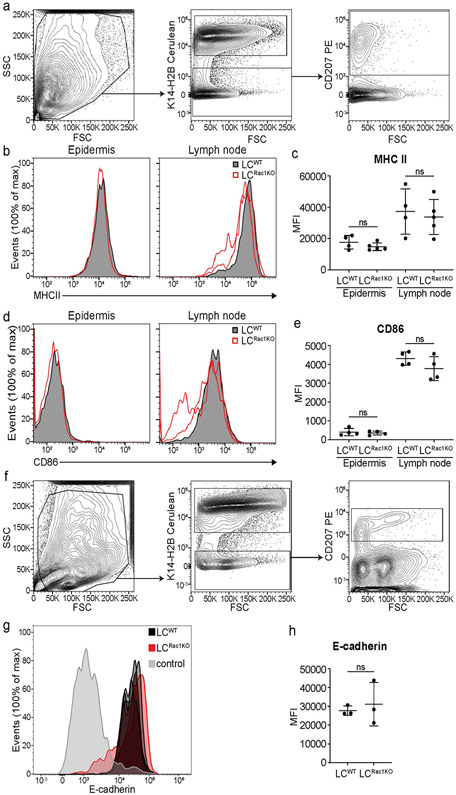
These cellular phenotypes resemble an LC activation state in terms of their changes in morphology and decrease in density24,63,64. However, LCRac1KO lack key molecular markers of activation, such as the upregulation of MHCII or CD86, when compared with wild-type LCs or physiologically activated LCs from lymph nodes (Extended Data Fig. 9a-e). In addition, LCs maintained expression of the adherent junction component E-cadherin (Extended Data Fig. 9f-h), which is downregulated during LC activation65,66. These data suggest that LCRac1KO in the epidermis are not activated and maintain cell–cell contact with epithelial cells.
To assess LCRac1KO immune cell patterning, we revisited the same region over time. Notably, LCRac1KO lost their tiling pattern by week 1 after induction and this irregular distribution persisted for at least 3 weeks (Fig. 5c-e). For instance, LCRac1KO cells at 3 weeks after induction have a wider range of minimum distances and come into closer contact than wild-type LCs, consistent with a loss of self-avoidance (Fig. 5c, bottom,f). The altered minimum distance and increased displacement of LCRac1KO does not appear to be the result of lower LC numbers as other models with similar LC density, such as the Cdkn1b;rtTA and Lang-DTR models, still maintained relatively stable positions and non-random patterns (Extended Data Fig. 8b,c). Collectively, these data suggest that RAC1 ablation in LCs results in dendrite defects, an inability to remain spatially stable and failure to maintain their non-random tiling pattern.
Discussion
This study set out to investigate population dynamics of immune cells and epithelial cells in the context of adult skin homeostasis. We observed principles and behaviours that maintain immune cell density and spatial coverage during homeostasis. Specifically, immune cells in the epidermis maintain a relatively stable position in the face of ongoing changes in their epithelial neighbourhood. At the same time, immune cells exhibit dynamic behaviours, continuously exploring epithelial cell junctional spaces through their rapid dendritic movements. We identified two distinct levels of control of the immune cell population. First, we found that immune cell populations modulate their densities on the basis of the density of their epithelial cell neighbours, maintaining a constant epithelial cell:immune cell ratio across the basal layer of the epidermis. Second, we observed that both LCs and DETCs are organized in a tiling pattern that is actively maintained regardless of their density in the epidermis, which relies on positional stability associated with RAC1 (Extended Data Fig. 10). Future studies will aim at understanding the molecular mechanisms upstream of RAC1 modulation involved with immune density regulation by epithelial cells as well as those responsible for the distribution of LCs and DETCs in the epidermis. Together, our results provide insight into the dynamics between immune cells and epidermal cells, more specifically how immune cells organize and adapt to local changes during adult homeostasis. We propose that dynamic regulation within and between the diverse cell types of the skin maintain global organ homeostasis and enable adaptations to local changes in the environment during adult homeostasis.
Online content
Any methods, additional references, Nature Research reporting summaries, source data, extended data, supplementary information, acknowledgements, peer review information; details of author contributions and competing interests; and statements of data and code availability are available at https://doi.org/10.1038/s41556-021-00670-5.
Methods
Mice and experimental conditions.
huLangerin-CreER28, Rosa-stop-tdTomato29, CX3CR1-GFP30, K14-CreER67, K14-rtTA47, tetO-Cdkn1b46, Lang-DTR37, Rac1fl/fl59, Rosa26-LSL;H2B-mCherry68, Tcrd-CreER42 and Rosa-GFP-stop-DTA43 mice were obtained from Jackson Laboratories. K14-H2B-Cerulean mice were generated by the Yale Transgenic Facility. Lang-eGFP37 mice were obtained from N. Anandasabapathy (Brigham & Women’s Hospital), HrasG12V mice69 were obtained from S. Beronja (Fred Hutch) and Tcrd KO38 mice were obtained from A. Iwasaki (Yale University). To simultaneously visualize LCs, DETCs and epithelial cells, huLangerin-CreER; Rosa-stop-tdTomato; CX3CR1-GFP+/−;K14-H2B-Cerulean mice were generated and Cre expression was induced with a single intraperitoneal injection of tamoxifen (2 mg in corn oil). To block the proliferation of epithelial cells, the huLangerin-CreER; Rosa-stop-tdTomato;CX3CR1-GFP+/−;K14-H2B-Cerulean mice were mated with K14-rtTA and tetO-Cdkn1b mice (huLangerin-CreER;Rosa-stop-tdTomato; CX3CR1-GFP+/−;K14-H2B-Cerulean;tetO-Cdkn1b;K14-rtTA) and these mice were given a single intraperitoneal injection of tamoxifen (2 mg in corn oil) and doxycycline (1 mg ml−1) in potable water with 1% sucrose48. Doxycycline treatment was sustained until imaging was performed. Siblings without the K14-rtTA allele (huLangerin-CreER;Rosa-stop-tdTomato;CX 3CR1-GFP+/−;K14-H2B-Cerulean;tetO-Cdkn1b) were used as controls. To enhance the proliferation of epithelial cells, K14-CreER;CX3CR1-GFP+/− or K14-CreER;Rosa26-LSL;H2B-mCherry mice were mated with HrasG12V mice (K14-CreER;CX3CR1-GFP+/−;HrasG12V/+ or K14-CreER;Rosa26-LSL;H2B-mCherry; HrasG12V/+, respectively) and Cre expression was induced with a single intraperitoneal injection of tamoxifen (2 mg in corn oil)44. Siblings were used as controls (K14-CreER;CX3CR1-GFP+/−;Hras+/+ or K14-CreER;Rosa26-LSL;H 2B-mCherry;Hras+/+). To visualize and deplete LCs, Lang-eGFP mice were mated with Lang-DTR mice to boost the weak eGFP signal of the Lang-DTR mice (Lang-eGFP;Lang-DTR). These mice were given either a single intraperitoneal injection of diphtheria toxin (2 ng per g (body weight) in PBS) at postnatal day 21 for partial depletion of LCs or 1 μg per g (body weight) for full depletion, depending on the experimental conditions37,70. To knock out Rac1 in the LCs, huLangerin-CreER;Rosa-stop-tdTomato;CX3CR1-GFP+/−;K14-H2B-Cerulean mice were mated with Rac1fl/fl mice (huLangerin-CreER;Rosa-stop-tdTomato; CX3CR1-GFP+/−;K14-H2B-Cerulean;Rac1fl/fl), and these mice were given five intraperitoneal injections of tamoxifen (2 mg in corn oil per day for 5 d). Wild-type siblings used as controls (huLangerin-CreER;Rosa-stop-tdTomato; CX3CR1-GFP+/−;K14-H2B-Cerulean;Rac1+/+). To deplete LCs and DETCs simultaneously, we crossed Rosa-GFP-stop-DTA to huLangerin-CreER;Tcrd-CreER mice and gave them 2 intraperitoneal injections of tamoxifen (2 mg in corn oil for 2 consecutive days). Wild-type siblings (Rosa-GFP-stop-DTA) were used as controls. Mice were housed on ventilated Tecniplast lixit racks with ambient temperature of 22 °C and 50% ± 10% humidity with a 12 h:12 h light:dark cycle (07:00–19:00 light). Mice of both sexes from experimental and control groups were randomly selected for live imaging experiments. All mice used in this study were between 3 and 6 weeks of age. No blinding was done. All procedures involving animals were performed under the approval of the Institutional Animal Care and Use Committee (IACUC) of the Yale School of Medicine.
In vivo imaging.
Mice were anaesthetized using an isofluorane chamber and anaesthesia was maintained throughout the course of the experiment with vapourized isofluorane delivered by a nose cone as previously described33. Image stacks were acquired with a LaVision TriM Scope II (LaVision Biotec) laser scanning microscope equipped with a tunable Two-photon Vision II Ti:Sapphire (Coherent) Ti:Sapphire laser and tunable Two-photon Chameleon Discovery Ti:Sapphire larer (Coherent) and Imspector Pro (LaVision Biotec, v.7.0.129.0). To acquire serial optical sections, a laser beam (940 nm for Lang-eGFP, Lang-DTR; 965 nm for huLangerin-CreER; Rosa-stop-tdTomato; CX3CR1-GFP+/+;K14-H2B-Cerulean mice; 940 nm, 1040 nm and 1120 nm for whole-mount staining) was focused through a ×20 or ×40 water-immersion lens (NA 1.0 and 1.1 respectively; Zeiss) and scanned with a field of view of 0.5×0.5 mm2 or 0.25×0.25 mm2, respectively at 600 Hz or through a ×25 water-immersion lens (NA 1.0; Nikon) and scanned with a field of view of 0.44×0.44 mm2 at 600 Hz. Z-stacks were acquired in 1–3 μm steps to image a total depth of 200 μm of tissue. To visualize large areas, 3–36 tiles of optical fields were imaged using a motorized stage to automatically acquire sequential fields of view as previously described33. Visualization of collagen was achieved via the second harmonic signal using the blue channel at 940 nm. For time-lapse imaging, serial optical sections were obtained in a range of 1–12 min intervals, depending on the experimental setup. The duration of time-lapse imaging was 1–4 h. Frequent daily imaging can cause a drop in cell density in epithelial basal cells, LCs and DETCs, and experiments were either normalized to the control or repeated with single time points to confirm findings when necessary.
Laser ablations.
Single cells were ablated with a tunable Two-photon Vision II Ti:Sapphire Ti:Sapphire laser (Coherent; 810 nm wavelength, with 15–20 % power, photomultiplier tubes at 100%) for 3 s using a ‘live’ scan focused through a ×63 water-immersion lens (NA 1.5; Zeiss) at 800 Hz and within a 1 μm2 size window in the centre of the cell body.
Image analysis.
Raw image stacks were imported into Fiji (v1.52p, National Institutes of Health) or Imaris software (v.9.5.1; Bitplane/Oxford Instruments) for further analysis. Imaris software was used to track cells and obtain xyz coordinates from individual tracked cells over time. All cell tracks were individually examined and only cells that could be tracked for the full duration of a time-lapse series or of revisit images were included in the final analysis. Prism software (Graphpad, v.8.0.0) was used to graph the data. The tiled images were stitched by a grid/collection stitching plugin in Fiji. Migrating cell tracking for rose plot analysis and 3D reconstitution were performed in Imaris software. Voronois, displacement analysis and minimum distances were analysed using Matlab (Mathworks, USA, vR2019b).
Whole-mount staining.
Ear tissues were processed for whole-mount staining. In brief, ears were incubated epidermis side up in 5 mg ml−1 Dispase II solution (Sigma, 4942078001) at 37 °C for 15 min and epidermis was removed from the dermis. The epidermis was fixed in 4% paraformaldehyde in PBS for 10 min at room temperature, washed in PBS, and then blocked with 0.2% Triton X-100, 5% normal donkey serum, 1 % BSA in PBS. The samples were then incubated with primary antibodies for 24 h and with secondary antibodies for approximately 1 h at room temperature. Primary antibodies used were as follows: purified Armenian hamster anti-mouse T cell receptor γ/δ (1:100, BioLegend, 118101), purified rat anti-mouse MHC class II or MHC class II Alexa 488 (BioLegend; 107602, 1:100; 107616, 1:100), purified rat anti-mouse CD45 (Biolegend; 103102, 1:100), purified mouse anti-mouse/human CD207 (Biolegend; 144202, 1:100), rabbit anti-mouse/human Ki67 (abcam; ab15580, 1/300), rabbit anti-mouse phospho-PI3K p85 (Y458)/p55 (Y199) (Cell Signaling; 4228 S, 1:300) and cleaved caspase 3 (D175) (5A1E) rabbit monoclonal antibody (Cell Signaling; 9664, 1:300). Secondary antibodies were as follows: goat anti-hamster Alexa Fluor 488 (1:100), goat anti-hamster Alexa Fluor 568 (1:100), goat anti-rat Alexa Fluor 488 (1:100), goat anti-rat Alexa 568 (1:100), goat anti rabbit Alexa Fluor 568 (1:100) and goat anti rabbit Alexa 633 (1:100) (ThermoFisher). Tissue was then incubated with Hoechst 33342 (Becton Dickinson; H3570, 1:500) for 15 min, washed with PBS and mounted on a slide or directly mounted on a slide with DAPI (Vector; H1200) and imaged on a LaVision TriM Scope II as described in ‘In vivo imaging’. For Airyscan imaging, ear tissue was dissected and fixed in 4% paraformaldehyde in PBS for 1 h at 4 °C. Fixed tissue was washed in PBS for 1 h at room temperature on a rocking platform, then mounted on a slide with Vectashield Anti-fade mounting medium (Vector Laboratories) with a no. 1.5 coverslip. Airyscan imaging was performed on a Zeiss LSM880 with 488 nm and 568 nm laser lines and rendering was done within the Zeiss Zen Blue acquisition software (v.3.2) at default settings.
Flow cytometry.
huLangerin-CreER;Rac1+/+ (n = 4) and huLangerin-CreER;Racfl/fl (n = 5) mice were euthanized for fluorescence-activated cell sorting (FACS) 2 d after receiving 5 intraperitoneal injections of tamoxifen (2 mg in corn oil per day for 5 d) to reflect conditions used in imaging studies. Cdkn1b (n = 3) and Cdkn1b;rtTA (n = 3) mice were euthanized for FACS 3 d after the induction with doxycycline (1 mg ml−1) in potable water with 1% sucrose. Epidermal and lymph node single-cell suspensions were prepared for flow cytometry with a protocol adapted from ref. 64. In brief, single-cell suspensions of epidermal cells were obtained from ear skin and incubated for 1 h at 37 °C in 0.3% trypsin (Sigma-Aldrich) in 150 mM NaCl, 0.5 mM KCl and 0.5 mM glucose. The epidermis was physically separated from the dermis, minced and the resulting cells were crushed and filtered through a 70 μm filter. Lymph nodes were incubated in 400 U ml−1 collagenase D (Roche Applied Science) for 30 min before filtration through a 70 μm filter. All samples were pretreated with rat serum (Sigma-Aldrich) and incubated with anti-mouse/human CD207 PE (Biolegend; 144204, 1:200) and either anti-mouse MHCII APC (Biolegend; 107614, 1:250), anti-mouse CD86 APC (Biolegend; 105012, 1:100) or anti-mouse CD324 biotin (E-cadherin) (Thermofisher; 13–3249–82, 1:100) at 4 °C. Biotin samples were incubated with secondary antibody Streptavidin-APC (Thermofisher; SA1005, 1:500) for 20 min. Samples were run on a Becton Dickinson LSRII outfitted with Diva software v.8.0.1, and the data were analysed using Flowjo v.10.6.2.
Statistics and reproducibility.
Data are expressed either as absolute numbers or percentages ± s.d. An unpaired, two-tailed Student’s t-test was used to analyse datasets with two groups. A paired, two-tailed Student’s t-test was used to analyse datasets across different time points. Actual P-values were provided in the legends when available. NS denotes no significance. Statistical calculations were performed using Prism v.8.0.0 (GraphPad). No statistical method was used to pre-determine sample size (n). Sample sizes are represented as distinct biological replicates in all experiments. Panels showing representative images are representative of two to five independent experiments, as indicated in the figure legends. *P < 0.05, **P < 0.01, ***P < 0.001 and ****P < 0.0001 indicate significant differences.
Reporting Summary.
Further information on research design is available in the Nature Research Reporting Summary linked to this article.
Extended Data
Extended Data Fig. 1 ∣. The depletion of LCs or DETCs does not impact epithelial basal density or epidermal architecture of the ear.
a, X-y view of the basal layer of the epidermis with LCs in red (anti-MHC II) and DETCs in green (anti-TCRγδ) comparing Lang-DTR control mice without the addition of diphtheria toxin (or − DT) to Lang-DTR mice given one dose of 1 μg/body weight diphtheria toxin for the acute depletion of LCs 5 days before harvest (+ DT) (left panels) or comparing TCRδ WT to TCRδ KO mice (right panels) (representative images from 3 mice each). Scale bar, 50 μm. b, X-y view of the basal layer and x-z view of the epidermis with epithelial nuclei in white and collagen in magenta, comparing Lang-DTR mice either − DT or + DT (left panels) or comparing TCRδ WT to TCRδ KO mice (right panels) (representative images from 3 mice each). Scale bar, 30 μm. c,e, Quantification of epithelial basal cell number comparing Lang-DTR mice either − DT or + DT mice (c) and TCRδ WT to TCRδ KO mice (e). Unpaired, two-tailed Student’s t-test (n=3 mice respectively). Data presented as absolute values +/− SD. d,f, Quantification of LC and DETC cell numbers comparing Lang-DTR mice either − DT or + DT, (d) and TCRδ WT to TCRδ KO mice (f). Unpaired, two-tailed Student’s t-test (n=3 mice respectively). Data presented as absolute values +/− SD. g,h, Ratio between epithelial basal and DETCs in Lang-DTR + DT (g) and LCs in TCRδ KO (h) compared to their respective control mice (n=3 mice respectively). Area quantified for cell number 0.0625 mm2. Unpaired, two-tailed Student’s t-test. Data presented as absolute values +/− SD.
Extended Data Fig. 2 ∣. Full depletion of LCs and DETCs does not alter epidermal architecture.
a, X-y view of basal layer of epidermis in paw with LCs (Lang-EGFP) in green comparing Lang-DTR control mice without diphtheria toxin (or − DT) to Lang-DTR mice given 1 dose of 1 μg/body weight diphtheria toxin for the acute depletion of LCs 5 days before harvest (+ DT) (representative images from 2 mice each). Scale bar, 50 μm. b, X-y view of basal layer and x-z view of epidermis with epithelial nuclei in white (K14-H2B-mCherry), comparing Lang-DTR mice either − DT or + DT (representative images from 3 mice each). Scale bar, 50 μm. c, Quantifications of epithelial basal cell number comparing Lang-DTR mice − DT or + DT pre depletion (D0) and 5 days post depletion (D5). Area quantified 0.0625 mm2. (n=2 mice respectively). d, Quantification of epidermal thickness comparing Lang-DTR mice −DT or +DT. Area quantified 0.0625 mm2. (n=2 mice respectively). e, X-y view of basal layer and x-z view of epidermis in the ear with all nuclei (Hoechst) in gray and immune cells (CD45+) in white comparing control huLangerin-CreER; TCR δ-CreER; Rosa-GFP-stop-DTA mice without tamoxifen (DTA) to huLangerin-CreER; TCR δ-CreER; Rosa-GFP-stop-DTA mice given 2 mgs of tamoxifen on 2 consecutive days 8 days before harvest (DTA + tamoxifen) (representative images from 2 mice each). Scale bar, 50 μm. f, Quantification of epithelial basal cell number comparing huLangerin-CreER; TCR δ-CreER; Rosa-GFP-stop-DTA either – Tamoxifen or + Tamoxifen at day 8. Area quantified 0.0625 mm2. (n=2 mice respectively). g, Quantification of epidermal thickness comparing huLangerin-CreER; TCR δ-CreER; Rosa-GFP-stop-DTA either – Tamoxifen or + Tamoxifen at day 8. Area quantified 0.0625 mm2. (n=2 mice respectively). All data in figure presented as absolute values.
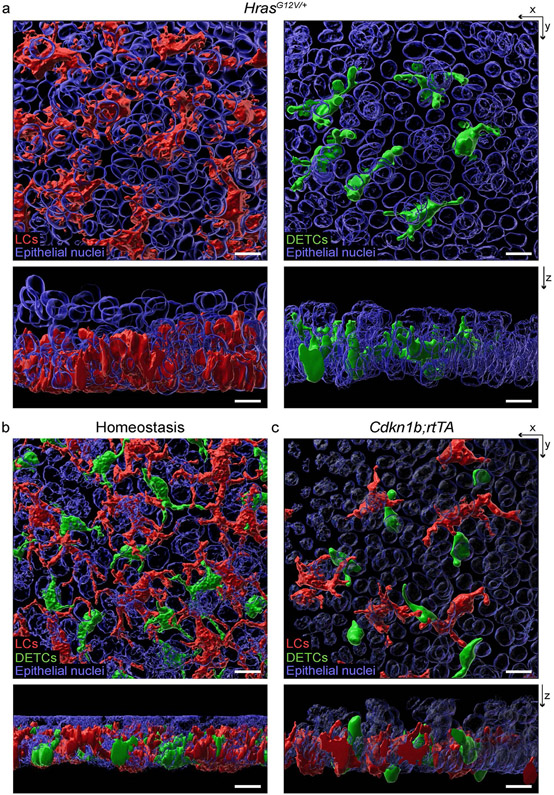
Extended Data Fig. 3 ∣. LCs and DETCs remain embedded in the basal layer of the ear epidermis upon changes in epithelial basal cell density.
(a-c) 3D reconstruction with Imaris surface rendering shows that LCs (red), DETCs (green), and epithelial cells (blue) are complicatedly intermixed in the epidermis. a, X-y and x-z views show that LCs and DETCs embed in the basal layer of the epidermis in HrasG12V mice (representative of 2 mice) 6 weeks after 1 dose of 2 mgs tamoxifen similar to (b) WT LCs and DETCs in homeostasis (representative of 3 mice) and (c) Cdkn1b;rtTA mice 3 days after induction with 1 mg/ml doxycycline (representative of 2 mice). All images: Scale bar, 10 μm.
Extended Data Fig. 4 ∣. Proliferation in LCs and DETCs is enhanced in a model of increased epithelial and immune cell density.
a,b, Staining of the epidermal basal layer of the ear in HrasG12V/+ compared to control Hras+/+ mice 6 weeks after induction with 1 dose of 2 mgs of tamoxifen for the proliferation marker ki67 (representative of 2 mice respectively). Scale bar, 50μm. c-e, Quantifications of cycling immune cells (CD45+ki67+) in the HrasG12V/+ mice compared to control Hras+/+ mice. Area quantified 0.0625 mm2 X 3 regions per mouse. (n=2 mice respectively). Data presented as absolute values. f-j, Stainings of the epidermal basal layer of the ear in 6 week old CD1 mice for proliferation markers shown in red (f) ki67 and (g) phosphohistone H3 to enumerate proliferating immune cells (CD45+) shown in green (representative of 3 mice for ki67 and 2 mice for pH3). Scale bar, 50μm. h-j, Quantifications of cycling immune cells (CD45+ki67+) and of immune cells that are actively dividing (CD45+pH3+) during homeostasis. Area quantified 0.0625 mm2 X 3 regions per mouse. Unpaired, two-tailed Student’s t-test (n=3 mice for ki67 and n=2 mice for pH3). Data presented as absolute values.
Extended Data Fig. 5 ∣. Immune cell density gradually changes along with changes in epithelial basal density.
a, The densities of LCs and DETCs in mice with blocked proliferation of epithelial stem cells (Cdkn1b; K14-rtTA) during a 3-day revisit experiment post induction with 1 mg/ml doxyclycline. Epithelial nuclei are white (top panel). LCs (huLangerin-CreER; Rosa-stop-tdTomato) are red and DETCs (CX3CR1-GFP+/−) are green (bottom panel). Yellow asterisk (hair follicle). (3 mice respectively). Scale bar, 50 μm. b, Voronoi diagrams showing spatial distribution of LCs (top panel, red) and DETCs (bottom panel, green) (c) Quantification of epithelial basal cell number over the timecourse * p=0.0282 (Day 1 vs. Day 0), ** p=0.0076 (Day 2 vs. Day 0), and * p=0.0253 (Day 3 vs. Day 0), paired, two-tailed Student’s t-test (n=3 mice respectively). Data presented as percentage values +/− SD. d, Quantification of LC and DETC number for both LCs and DETCs over the timecourse. Area quantified 0.25 mm2. * p= 0.0101 (Day 0 LC vs. Day 2 LC) and * p=0.0113 (Day 0 LC vs. Day 3 LC), paired, two-tailed Student’s t-test (n=3 mice respectively). Data presented as percentage values +/− SD (e) Fiji software was used to count nucleated cells in the epidermis based on arbitrary distance from the SHG of the collagen in 260 X 260 ROIs of 40X images (0.27μm/pixel, 1μm step size). Basal cell counts comparing Cdkn1b;rtTA mice to Cdkn1b controls at day 3 post induction with 1 mg/ml doxycycline. Quantification of suprabasal cell counts which include spinous and granular layers, comparing Cdkn1b;rtTA mice to Cdkn1b controls at day 3 post induction with 1 mg/ml doxycycline. Area quantified 0.0625 mm2. * p=0.0318 and ** p=0.0063, unpaired, two-tailed Student’s t-test (n=5 separate regions from 3 Cdkn1b mice and n=4 separate regions from 2 Cdkn1b;rtTA mice). Data presented as absolute values +/− SD.
Extended Data Fig. 6 ∣. Cell apoptosis and activation do not contribute to the density drop of LCs and DETCs in Cdkn1b;rtTA mice.
(a) Ears were taken from Cdkn1b and Cdkn1b;rtTA mice 3 days post induction with 1 mg/ml of doxycycline. Staining of epithelial basal layer of the ear for the apoptotic marker cleaved-caspase 3 (CC3) shown in white of Cdkn1b;rtTA (right panels) and control Cdknlb mice (left panels) (representative images of 3 mice respectively). LCs and DETCs are shown in red (anti-CD45) and epithelial basal cell nuclei (K14-H2B-Cerulean) are shown in green. Inset in bottom right panel shows an epithelial cell positive for CC3. Scale bar, 40μm. b,c, Quantifications of immune cells undergoing apoptosis (CD45+CC3+) in Cdkn1b;rtTA compared to controls. Area quantified 0.0625 mm2 X 3 regions per mouse. Unpaired, two-tailed Student’s t-test (n=3 mice respectively). Data presented as absolute values/percentages respectively +/− SD. d, Epidermal single cell suspensions were processed from ear of mice 3 days post induction with 1mg/ml of doxycycline for flow cytometry and gated for LCs using (anti-CD207). K14-H2B-Cerulean was used to gate out the epithelial cells. e,f, The expression levels of the known activation marker (MHCII) from LCs from Cdkn1b;rtTA mice (closed red) compared to those from Cdkn1b control mice (solid black) in the epidermis. Negative control (gray) gated on cells negative for epithelial cell marker K14-H2B-Cerulean and immune cell markers for LCs (CD207) and DETCs.Unpaired, two-tailed Student’s t-test (n=3 mice respectively). Data presented as absolute values +/− SD. g-h, The expression levels of E-cadherin, a mediator of cell-cell interaction known to be down-regulated in activated LCs, from LCs of Cdkn1b;rtTA mice (closed red) and those from Cdkn1b control mice (solid black) in the epidermis. Negative control (gray) gated on cells negative for the epithelial cell marker K14-H2B-Cerulean and immune cell markers for LCs (CD207) and DETCs. Unpaired, two-tailed Student’s t-test (n= 3 mice respectively). Data presented as absolute values +/− SD.
Extended Data Fig. 7 ∣. The distribution of one immune population is maintained upon the depletion of the other and surviving DETCs re-establish a regular pattern after local cell loss.
a,c, Voronoi diagrams were generated from images acquired for the quantifications in Extended Data Fig. 1 comparing (a) the distribution of DETCs in Lang-DTR mice with and without one dose of 1 ug/body weight of diphtheria toxin 5 days post depletion or (c) that of LCs in TCRδ KO compared to WT controls showing that the distribution of the remaining immune population is not disrupted in either models. b,d, Minimum distance quantifications showed no significant differences regardless of which immune population had been ablated when compared to controls showing that (b) DETC (n=198 cells Lang-DTR −DT, n=195 cells Lang-DTR +DT) and (d) LC (n=172 cells WT, n=176 cells TCRδ KO) patterns are maintained in the absence of the other population. Area quantified 0.625 mm2. Unpaired, two-tailed Student’s t-test (3 mice respectively). Data presented as absolute values +/− SD. e, Local laser ablation of DETCs. DETCs within the yellow box (100 μm × 100 μm) are ablated by multiphoton laser (810 nm) and the same region is revisited 3 days after the ablation. The upper panel shows actual images from a mouse from day 0 before ablation to day 3 post ablation. Scale bar, 10μm. The lower panel displays the Voronoi diagram for DETCs generated from the images at each timepoint and encompasses a larger area around the ablation site. Area size 0.25 mm2 (red, LCs (huLangerin-CreER; Rosa-stop-tdTomato); green, DETCs (CX3CR1-GFP+/−); white, nuclei of epithelial cells (K14-H2B-Cerulean); representative images from 4 mice). f, The DETC pattern within ablated region was quantified from day 1 to day 7 and compared to the initial number at day 0. * p=0.0102 (Day 1 vs. Day 0), ** p=0.0034 (Day 2 vs. Day 0), ** p=0.0087 (Day 3 vs. Day 0), paired, two-tailed Student’s t-test (n=4 mice respectively). Data presented as absolute values +/− SD.
Extended Data Fig. 8 ∣. LCRac1KO have increased mobility in the epidermis compared to models with similar LC density and cell apoptosis does not contribute to the density drop observed in the LCRac1KO phenotype.
a, Quantification of cell number across models (n=3 mice respectively). b, Minimum distance across models. Note, the data used for Lang-DTR is the same data set as in Fig. 4d, e for Day 8 and the data used for LCRac1KO at 1 week and 3 weeks are the same data sets used in Fig. 5f (n= 811 Cdkn1b, n=480 Cdkn1b; rtTA, n=365 Lang-DTR, n=893 LCRac1KO(1week), n=797 LCRac1KO(3weeks) cells from 3 mice respectively (c) Displacement analysis of LCRac1KO at day 0 versus day 3 compared to LCs of Cdkn1b;rtTA mice during 72 h and LCs of Lang-DTR mice over the course of 8 days.. The data used for LCRac1KO at 1 week and 3 weeks are the same data sets used in Fig. 5b (n=705 Cdkn1b, n=858 Cdkn1b;rtTA, n=789 Lang-DTR, n=657 LCWT, n=498 LCRac1KO from cells 3 mice respectively). Data presented as absolute values +/− SD. d-e, Staining of epithelial basal layer of the ear for apoptotic marker cleaved-caspase (CC3) shown in white of (d) huLangerin-CreER; Rac1+/+ mice and (e) huLangerin-CreER; Rac1fl/fl mice days post induction with 2 mg dose of tamoxifen given on 5 consecutive days. LCs are shown in red (anti-CD207), all nuclei are shown in green (Hoechst). Inset in bottom right panel shows an LC cell positive for CC3. All images: scale bar, 40 μm. f,g, Quantifications show very few apoptotic events (< 1%) in the LCs of both huLangerin-CreER; Rac1+/+ mice and huLangerin-CreER; Rac1+/+ control mice (CC3+CD207+) (data is representative n=3 for huLangerin-CreER; Rac1+/+ mice, n=3 for huLangerin-CreER; Rac1fl/fl mice). Area quantified 0.0625 mm2 X 3 regions/mouse. Unpaired, two-tailed Student’s t-test (n=3 mice respectively). Data presented as absolute/percentage values respectively +/− SD.
Extended Data Fig. 9 ∣. Activation does not contribute to the drop in density observed in LCRac1KO.
a, Ears and lymph nodes were taken from mice 7 days post induction with 2mg dose of tamoxifen given on 5 consecutive days. Epidermal and lymph node single cell suspensions were processed for flow cytometry and gated for LCs using anti-langerin antibody (CD207). K14-H2B-Cerulean was used to gate out the epithelial cells. b-e, LCRac1KO (open red) show no significant difference in the expression levels of the known activation markers MHCII and CD86 compared to LCwt (solid black) in either the epidermis or draining lymph nodes showing that LCRac1KO are not activated in this model. Unpaired, two-tailed Student’s t-test (data is representative n=4 for huLangerin-CreER; Rac1+/+ mice, n=5 for huLangerin-CreER; Rac1fl/fl mice in c and n=4 for both groups in e). Data presented as absolute values +/− SD. f, Epidermal cell suspensions were processed for flow cytometry and gated for LCs using anti-langerin antibody (CD207). K14-H2B-Cerulean was used to gate out the epithelial cells. g-h, LCRac1KO (closed red, n=3) show no significant difference in the expression levels of the known mediator of cell-cell interaction E-cadherin compared to LCwt (solid black, n=3). Negative control (gray) is gated on cells negative for the epithelial cell marker K14-H2B-Cerulean and immune cell markers for LCs (CD207) and DETCs. Unpaired, two-tailed Student’s t-test (data is representative n=3 for huLangerin-CreER; Rac1+/+ mice, n=3 for huLangerin-CreER; Rac1fl/fl mice). Data presented as absolute values +/− SD.
Extended Data Fig. 10 ∣. Skin-resident immune cells actively coordinate their distribution with epithelial basal cells.
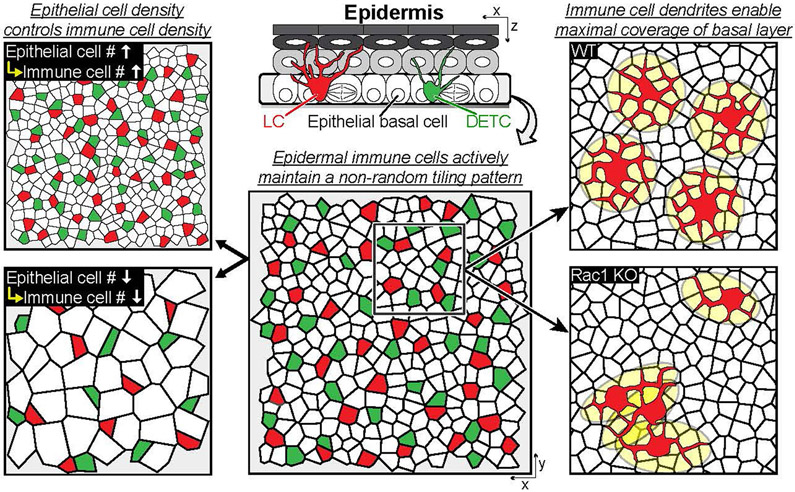
During homeostasis, LCs and DETCs actively maintain a non-random distribution. Although these immune cells continuously move within epithelial basal cell neighbors, they sustain their regular tiling pattern. Moreover, epithelial basal cells determine the density of LCs and DETCs in the skin epidermis. However, LCs and DETCs do not impact the density of epithelial basal cells nor the architecture of the epidermis signifying a unidirectional regulation of density. Finally, immune cell dendrites enable maximal coverage of the basal layer and do not come into contact with neighbouring immune cells in homeostasis and their dendritic behaviors, mediated by Rac1, coordinate their patterned organization.
Supplementary Material
Acknowledgements
We thank A. Anderson of Life Science Editors for critical feedback on the manuscript; N. Anandasabapathy for the Lang-eGFP mice; S. Beronja for the HrasG12V mice; and Akiko Iwasaki for the Tcrd KO mice. This work is supported by the Howards Hughes Medical Institute Scholar award, National Institutes if Health grants no. 1R01AR072668-01. S.P. was supported by The New York Stem Cell Foundation (NYSCF–D–F58). Y.B. is supported by the Centre National de la recherche Scientifique, The Institut Curie and the Institut National de la santé et de la recherche médicale (INSERM). E.M. was supported in part by the National Institute of Health (T32 GM007499). D.P.M. was supported by The National Insitutes of Health (T32-GM007223-44). J.L.M. was supported by Lo Graduate Fellowship for Excellence in Stem Cell Research and The National Institutes of Health (T32 GM 7499-41 A1 and T32 HD 7149-40).
Footnotes
Competing interests
The authors declare no competing interests.
Extended data is available for this paper at https://doi.org/10.1038/s41556-021-00670-5.
Supplementary information The online version contains supplementary material available at https://doi.org/10.1038/s41556-021-00670-5.
Code availability
Positions of immune cells in the x–y plane were identified using Fiji. The minimum distance and displacement analyses were performed using the Matlab function squareform. The Voronoi tessellation used to determine nuclei neighbour relationships was performed using Matlab function voronoi. To make an artificially generated random pattern, random x–y positions were generated by Matlab function randi. All code is available from the corresponding author on request.
Data availability
Additional source data for Figs. 4, 5, and Extended Data Figs. 1, 2, 4, 6, 8 have been deposited at Figshare and are accessible from https://doi.org/10.6084/m9.figshare.14199746, https://figshare.com/s/6855f86218f9026b0250, https://figshare.com/s/016423de8cf0ce293c1e, https://figshare.com/s/5c97c32da91f8810fed7, https://figshare.com/s/78598f01a1438569eb9b, https://figshare.com/s/03291104075fbb3492e7, https://figshare.com/s/f4ccb37bd6bd4557dbe2, https://figshare.com/s/c199699135ff4b446dc8 and https://figshare.com/s/336af7d8ebf313fcb2a5. Source data are provided with this paper. All other data that support the conclusions are available from the authors upon reasonable request.
References
- 1.Gonzales KAU & Fuchs E Skin and its regenerative powers: an alliance between stem cells and their niche. Dev. Cell 43, 387–401 (2017). [DOI] [PMC free article] [PubMed] [Google Scholar]
- 2.Park S, Greco V & Cockburn K Live imaging of stem cells: answering old questions and raising new ones. Curr. Opin. Cell Biol 43, 30–37 (2016). [DOI] [PMC free article] [PubMed] [Google Scholar]
- 3.Simpson CL, Patel DM & Green KJ Deconstructing the skin: cytoarchitectural determinants of epidermal morphogenesis. Nat. Rev. Mol. Cell Biol 12, 565–580 (2011). [DOI] [PMC free article] [PubMed] [Google Scholar]
- 4.Solanas G & Benitah SA Regenerating the skin: a task for the heterogeneous stem cell pool and surrounding niche. Nat. Rev. Mol. Cell Biol 14, 737–748 (2013). [DOI] [PubMed] [Google Scholar]
- 5.Tai K, Cockburn K & Greco V Flexibility sustains epithelial tissue homeostasis. Curr. Opin. Cell Biol 60, 84–91 (2019). [DOI] [PMC free article] [PubMed] [Google Scholar]
- 6.Xin T, Greco V & Myung P Hardwiring stem cell communication through tissue structure. Cell 164, 1212–1225 (2016). [DOI] [PMC free article] [PubMed] [Google Scholar]
- 7.Ho AW & Kupper TS T cells and the skin: from protective immunity to inflammatory skin disorders. Nat. Rev. Immunol 19, 490–502 (2019). [DOI] [PubMed] [Google Scholar]
- 8.Pasparakis M, Haase I & Nestle FO Mechanisms regulating skin immunity and inflammation. Nat. Rev. Immunol 14, 289–301 (2014). [DOI] [PubMed] [Google Scholar]
- 9.Tay SS et al. The skin-resident immune network. Curr. Dermatol. Rep 3, 13–22 (2014). [DOI] [PMC free article] [PubMed] [Google Scholar]
- 10.Eming SA, Krieg T & Davidson JM Inflammation in wound repair: molecular and cellular mechanisms. J. Invest. Dermatol 127, 514–525 (2007). [DOI] [PubMed] [Google Scholar]
- 11.Jameson J et al. A role for skin γδ T cells in wound repair. Science 296, 747–749 (2002). [DOI] [PubMed] [Google Scholar]
- 12.Kaplan DH Ontogeny and function of murine epidermal Langerhans cells. Nat. Immunol 18, 1068–1075 (2017). [DOI] [PMC free article] [PubMed] [Google Scholar]
- 13.Leoni G et al. Wound repair: role of immune-epithelial interactions. Mucosal Immunol. 8, 959–968 (2015). [DOI] [PMC free article] [PubMed] [Google Scholar]
- 14.Merad M, Ginhoux F & Collin M Origin, homeostasis and function of Langerhans cells and other langerin-expressing dendritic cells. Nat. Rev. Immunol 8, 935–947 (2008). [DOI] [PubMed] [Google Scholar]
- 15.Nielsen MM, Witherden DA & Havran WL γδ T cells in homeostasis and host defence of epithelial barrier tissues. Nat. Rev. Immunol 17, 733–745 (2017). [DOI] [PMC free article] [PubMed] [Google Scholar]
- 16.Strbo N, Yin N & Stojadinovic O Innate and adaptive immune responses in wound epithelialization. Adv. Wound Care 3, 492–501 (2014). [DOI] [PMC free article] [PubMed] [Google Scholar]
- 17.Takashima A & Bergstresser PR Cytokine-mediated communication by keratinocytes and Langerhans cells with dendritic epidermal T cells. Semin. Immunol 8, 333–339 (1996). [DOI] [PubMed] [Google Scholar]
- 18.Sugita K et al. Innate immunity mediated by epidermal keratinocytes promotes acquired immunity involving Langerhans cells and T cells in the skin. Clin. Exp. Immunol 147, 176–183 (2007). [DOI] [PMC free article] [PubMed] [Google Scholar]
- 19.Bernard JJ, Gallo RL & Krutmann J Photoimmunology: how ultraviolet radiation affects the immune system. Nat. Rev. Immunol 19, 688–701 (2019). [DOI] [PubMed] [Google Scholar]
- 20.Lewis JM et al. Mechanisms of chemical cooperative carcinogenesis by epidermal Langerhans cells. J. Invest. Dermatol 135, 1405–1414 (2015). [DOI] [PMC free article] [PubMed] [Google Scholar]
- 21.Chodaczek G et al. Body-barrier surveillance by epidermal γδ TCRs. Nat. Immunol 13, 272–282 (2012). [DOI] [PMC free article] [PubMed] [Google Scholar]
- 22.Kitashima DY et al. Langerhans cells prevent autoimmunity via expansion of keratinocyte antigen-specific regulatory T cells. EBioMedicine 27, 293–303 (2018). [DOI] [PMC free article] [PubMed] [Google Scholar]
- 23.Kubo A, Nagao K & Amagai M 3D visualization of epidermal Langerhans cells. Methods Mol. Biol 961, 119–127 (2013). [DOI] [PubMed] [Google Scholar]
- 24.Kubo A et al. External antigen uptake by Langerhans cells with reorganization of epidermal tight junction barriers. J. Exp. Med 206, 2937–2946 (2009). [DOI] [PMC free article] [PubMed] [Google Scholar]
- 25.Matsui T & Amagai M Dissecting the formation, structure and barrier function of the stratum corneum. Int. Immunol 27, 269–280 (2015). [DOI] [PubMed] [Google Scholar]
- 26.Nagao K et al. Stress-induced production of chemokines by hair follicles regulates the trafficking of dendritic cells in skin. Nat. Immunol 13, 744–752 (2012). [DOI] [PMC free article] [PubMed] [Google Scholar]
- 27.Yoshida K et al. Distinct behavior of human Langerhans cells and inflammatory dendritic epidermal cells at tight junctions in patients with atopic dermatitis. J. Allergy Clin. Immunol 134, 856–864 (2014). [DOI] [PubMed] [Google Scholar]
- 28.Bobr A et al. Autocrine/paracrine TGF-β1 inhibits Langerhans cell migration. Proc. Natl Acad. Sci. USA 109, 10492–10497 (2012). [DOI] [PMC free article] [PubMed] [Google Scholar]
- 29.Madisen L et al. A robust and high-throughput Cre reporting and characterization system for the whole mouse brain. Nat. Neurosci 13, 133–140 (2010). [DOI] [PMC free article] [PubMed] [Google Scholar]
- 30.Jung S et al. Analysis of fractalkine receptor CX3CR1 function by targeted deletion and green fluorescent protein reporter gene insertion. Mol. Cell. Biol 20, 4106–4114 (2000). [DOI] [PMC free article] [PubMed] [Google Scholar]
- 31.Mesa KR et al. Homeostatic epidermal stem cell self-renewal is driven by local differentiation. Cell Stem Cell 23, 677–686 e4 (2018). [DOI] [PMC free article] [PubMed] [Google Scholar]
- 32.Xin T et al. Flexible fate determination ensures robust differentiation in the hair follicle. Nat. Cell Biol 20, 1361–1369 (2018). [DOI] [PMC free article] [PubMed] [Google Scholar]
- 33.Rompolas P et al. Live imaging of stem cell and progeny behaviour in physiological hair-follicle regeneration. Nature 487, 496–499 (2012). [DOI] [PMC free article] [PubMed] [Google Scholar]
- 34.Rompolas P et al. Spatiotemporal coordination of stem cell commitment during epidermal homeostasis. Science 352, 1471–1474 (2016). [DOI] [PMC free article] [PubMed] [Google Scholar]
- 35.Pineda CM et al. Intravital imaging of hair follicle regeneration in the mouse. Nat. Protoc 10, 1116–1130 (2015). [DOI] [PMC free article] [PubMed] [Google Scholar]
- 36.Rompolas P, Mesa KR & Greco V Spatial organization within a niche as a determinant of stem-cell fate. Nature 502, 513–518 (2013). [DOI] [PMC free article] [PubMed] [Google Scholar]
- 37.Kissenpfennig A et al. Dynamics and function of Langerhans cells in vivo: dermal dendritic cells colonize lymph node areas distinct from slower migrating Langerhans cells. Immunity 22, 643–654 (2005). [DOI] [PubMed] [Google Scholar]
- 38.Itohara S et al. T cell receptor δ gene mutant mice: independent generation of αβ T cells and programmed rearrangements of γδ TCR genes. Cell 72, 337–348 (1993). [DOI] [PubMed] [Google Scholar]
- 39.Bobr A et al. Acute ablation of Langerhans cells enhances skin immune responses. J. Immunol 185, 4724–4728 (2010). [DOI] [PMC free article] [PubMed] [Google Scholar]
- 40.De Creus A et al. Langerhans cells that have matured in vivo in the absence of T cells are fully capable of inducing a helper CD4 as well as a cytotoxic CD8 response. J. Immunol 165, 645–653 (2000). [DOI] [PubMed] [Google Scholar]
- 41.Taveirne S et al. Langerhans cells are not required for epidermal Vγ3 T cell homeostasis and function. J. Leukoc. Biol 90, 61–68 (2011). [DOI] [PMC free article] [PubMed] [Google Scholar]
- 42.Zhang B et al. Differential requirements of TCR signaling in homeostatic maintenance and function of dendritic epidermal T cells. J. Immunol 195, 4282–4291 (2015). [DOI] [PMC free article] [PubMed] [Google Scholar]
- 43.Ivanova A et al. In vivo genetic ablation by Cre-mediated expression of diphtheria toxin fragment A. Genesis 43, 129–135 (2005). [DOI] [PMC free article] [PubMed] [Google Scholar]
- 44.Brown S et al. Correction of aberrant growth preserves tissue homeostasis. Nature 548, 334–337 (2017). [DOI] [PMC free article] [PubMed] [Google Scholar]
- 45.Pineda CM et al. Hair follicle regeneration suppresses Ras-driven oncogenic growth. J. Cell Biol 218, 3212–3222 (2019). [DOI] [PMC free article] [PubMed] [Google Scholar]
- 46.Pruitt SC et al. Cdkn1b overexpression in adult mice alters the balance between genome and tissue ageing. Nat. Commun 4, 2626 (2013). [DOI] [PMC free article] [PubMed] [Google Scholar]
- 47.Xie W et al. Conditional expression of the ErbB2 oncogene elicits reversible hyperplasia in stratified epithelia and up-regulation of TGFα expression in transgenic mice. Oncogene 18, 3593–3607 (1999). [DOI] [PubMed] [Google Scholar]
- 48.Park S et al. Tissue-scale coordination of cellular behaviour promotes epidermal wound repair in live mice. Nat. Cell Biol 19, 155–163 (2017). [DOI] [PMC free article] [PubMed] [Google Scholar]
- 49.Bauer J et al. A strikingly constant ratio exists between Langerhans cells and other epidermal cells in human skin. A stereologic study using the optical disector method and the confocal laser scanning microscope. J. Invest. Dermatol 116, 313–318 (2001). [DOI] [PubMed] [Google Scholar]
- 50.Numahara T et al. Spatial data analysis by epidermal Langerhans cells reveals an elegant system. J. Dermatol. Sci 25, 219–228 (2001). [DOI] [PubMed] [Google Scholar]
- 51.Sandrock I et al. Genetic models reveal origin, persistence and non-redundant functions of IL-17-producing γδ T cells. J. Exp. Med 215, 3006–3018 (2018). [DOI] [PMC free article] [PubMed] [Google Scholar]
- 52.Gentek R et al. Epidermal γδ T cells originate from yolk sac hematopoiesis and clonally self-renew in the adult. J. Exp. Med 215, 2994–3005 (2018). [DOI] [PMC free article] [PubMed] [Google Scholar]
- 53.Ghigo C et al. Multicolor fate mapping of Langerhans cell homeostasis. J. Exp. Med 210, 1657–1664 (2013). [DOI] [PMC free article] [PubMed] [Google Scholar]
- 54.Merad M et al. Langerhans cells renew in the skin throughout life under steady-state conditions. Nat. Immunol 3, 1135–1141 (2002). [DOI] [PMC free article] [PubMed] [Google Scholar]
- 55.Marsh E et al. Positional stability and membrane occupancy define skin fibroblast homeostasis in vivo. Cell 175, 1620–1633 e13 (2018). [DOI] [PMC free article] [PubMed] [Google Scholar]
- 56.Swetman CA et al. Extension, retraction and contraction in the formation of a dendritic cell dendrite: distinct roles for Rho GTPases. Eur. J. Immunol 32, 2074–2083 (2002). [DOI] [PubMed] [Google Scholar]
- 57.Grueber WB & Sagasti A Self-avoidance and tiling: mechanisms of dendrite and axon spacing. Cold Spring Harb. Perspect. Biol 2, a001750 (2010). [DOI] [PMC free article] [PubMed] [Google Scholar]
- 58.Zipursky SL & Grueber WB The molecular basis of self-avoidance. Annu Rev. Neurosci 36, 547–568 (2013). [DOI] [PubMed] [Google Scholar]
- 59.Glogauer M et al. Rac1 deletion in mouse neutrophils has selective effects on neutrophil functions. J. Immunol 170, 5652–5657 (2003). [DOI] [PubMed] [Google Scholar]
- 60.Hotulainen P & Hoogenraad CC Actin in dendritic spines: connecting dynamics to function. J. Cell Biol 189, 619–629 (2010). [DOI] [PMC free article] [PubMed] [Google Scholar]
- 61.Dogterom M & Koenderink GH Actin-microtubule crosstalk in cell biology. Nat. Rev. Mol. Cell Biol 20, 38–54 (2019). [DOI] [PubMed] [Google Scholar]
- 62.Luckashenak N et al. Rho-family GTPase Cdc42 controls migration of Langerhans cells in vivo. J. Immunol 190, 27–35 (2013). [DOI] [PubMed] [Google Scholar]
- 63.Nishibu A et al. Behavioral responses of epidermal Langerhans cells in situ to local pathological stimuli. J. Invest. Dermatol 126, 787–796 (2006). [DOI] [PubMed] [Google Scholar]
- 64.Mohammed J et al. Stromal cells control the epithelial residence of DCs and memory T cells by regulated activation of TGF-β. Nat. Immunol 17, 414–421 (2016). [DOI] [PMC free article] [PubMed] [Google Scholar]
- 65.Van den Bossche J et al. Regulation and function of the E-cadherin/catenin complex in cells of the monocyte-macrophage lineage and DCs. Blood 119, 1623–1633 (2012). [DOI] [PubMed] [Google Scholar]
- 66.Mayumi N et al. E-cadherin interactions are required for Langerhans cell differentiation. Eur. J. Immunol 43, 270–280 (2013). [DOI] [PMC free article] [PubMed] [Google Scholar]
- 67.Vasioukhin V et al. The magical touch: genome targeting in epidermal stem cells induced by tamoxifen application to mouse skin. Proc. Natl Acad. Sci. USA 96, 8551–8556 (1999). [DOI] [PMC free article] [PubMed] [Google Scholar]
- 68.Peron SP et al. A cellular resolution map of barrel cortex activity during tactile behavior. Neuron 86, 783–799 (2015). [DOI] [PubMed] [Google Scholar]
- 69.Chen X et al. Endogenous expression of HrasG12V induces developmental defects and neoplasms with copy number imbalances of the oncogene. Proc. Natl Acad. Sci. USA 106, 7979–7984 (2009). [DOI] [PMC free article] [PubMed] [Google Scholar]
- 70.Jung S et al. In vivo depletion of CD11c+ dendritic cells abrogates priming of CD8+ T cells by exogenous cell-associated antigens. Immunity 17, 211–220 (2002). [DOI] [PMC free article] [PubMed] [Google Scholar]
Associated Data
This section collects any data citations, data availability statements, or supplementary materials included in this article.
Supplementary Materials
Data Availability Statement
Additional source data for Figs. 4, 5, and Extended Data Figs. 1, 2, 4, 6, 8 have been deposited at Figshare and are accessible from https://doi.org/10.6084/m9.figshare.14199746, https://figshare.com/s/6855f86218f9026b0250, https://figshare.com/s/016423de8cf0ce293c1e, https://figshare.com/s/5c97c32da91f8810fed7, https://figshare.com/s/78598f01a1438569eb9b, https://figshare.com/s/03291104075fbb3492e7, https://figshare.com/s/f4ccb37bd6bd4557dbe2, https://figshare.com/s/c199699135ff4b446dc8 and https://figshare.com/s/336af7d8ebf313fcb2a5. Source data are provided with this paper. All other data that support the conclusions are available from the authors upon reasonable request.


