Abstract
Objective:
To investigate the most reliable stress or strain parameters in subject-specific finite element (FE) models to predict success or failure of orthodontic mini-implants (OMIs).
Materials and Methods:
Subject-specific FE analysis was applied to 28 OMIs used for anchorage. Each model was developed using two computed tomography data sets, the first taken before OMI placement and the second taken immediately after placement. Of the 28 OMIs, 6 failed during the first 5 months, and 22 were successful. The bone compartment was divided into four zones in the FE models, and peak stress and strain parameters were calculated for each. Logistic regression of the failure (vs success) of OMIs on the stress and strain parameters in the models was conducted to verify the ability of these parameters to predict OMI failure.
Results:
Failure was significantly dependent on principal strain parameters rather than stress parameters. Peak maximum principal strain in the bone 0.5 to 1 mm from the OMI surface was the best predictor of failure (R2 = 0.8151).
Conclusions:
We propose the use of the maximum principal strain as a criterion for predicting OMI failure in FE models.
Keywords: Finite element analysis, Orthodontic mini-implant, Maximum principal strain
INTRODUCTION
Aseptic failure of orthodontic mini-implants (OMIs) and dental implants is presumed to be a result of an unfavorable mechanical environment in the surrounding bone, which impairs healing and leads to bone resorption and formation of fibrous tissue around the OMI or implant.1 Eventually, OMIs or implants lose bone support and fail. Finite element analysis (FEA) is a numerical technique that has recently been used to study the mechanical environment around OMIs or dental implants. A common problem in these studies is that there is no agreement about the stress and strain parameters that should be used as criteria to predict failure. The majority of previous studies chose criteria based on stress parameters, most commonly the von Mises yield criterion.2–8
Biomedical studies frequently use FEA to predict bone fracture.9–11 Again, there are no validated criteria. Recent studies of bone biomechanics found that bone failure by fracture was driven by deformation, and strain-based criteria can well predict fracture sites.12–14 These findings may cause us to reconsider the use of stress-based criteria in evaluating the mechanical environment around implants and expose the need in the dental literature for validated stress and strain criteria for predicting OMI or dental implant failure in finite element (FE) models.
In this study, we used subject-specific FEA of clinically successful and failed OMIs to test the hypothesis that stress and strain parameters can reliably predict the success and failure of OMIs.
MATERIALS AND METHODS
Treatment Procedures and Sample Selection
This retrospective study included 28 OMIs in 16 female patients with a mean (SD) age of 21.2 (5.4) years. Inclusion criteria were that OMI should be placed between the maxillary first molar and second premolar and be used for retraction of anterior teeth. The exclusion criterion was systemic bone disease. An implant that became loose or dropped out spontaneously during the first 5 months was defined as a failed implant (n = 6), and an implant that remained stable was determined to be successful (n = 22).
All included implants were DualTop OMIs (Jeil Medical Corporation, Seoul, Korea), 6 mm long by 1.4 mm in diameter; they were placed by the same author (TK). Two computed tomography (CT) images were obtained for each patient using the Aquilion TSX-101A (Toshiba Medical, Tokyo, Japan) at 120 kVp and 150 mA with in-plane resolution of 0.214 × 0.214 mm and a slice thickness of 0.5 mm. The first CT image was obtained before the operation, and the second one was obtained immediately after.
This protocol was approved by the ethics committee of Kyushu University Faculty of Dental Science (registration number 25–279).
Creation of a Three-Dimensional Discretized Model
Three-dimensional (3D) surface models (stereolithography format) for molar, premolar, segment of bone surrounding these two teeth, and periodontal ligament (PDL) of each tooth were generated using the preoperative CT data set in the segmentation module of Mechanical Finder (MF) v.6.1 (RCCM Inc, Osaka, Japan). The region of interest was selected by applying a CT value threshold-based selection for bone and teeth. The thresholds were fixed among all models. The PDL was traced manually on every slice using the same interactive pen display (Wacom Co, Ltd, Saitama, Japan).
The OMI's geometry was generated by scanning a DualTop OMI with a µCT SkyScan 1072 (Bruker microCT, Kontich, Belgium) with a voxel dimension of 9 µm. To analyze the relationship between mechanical parameters and distance from the OMI, we designed three shells based on the distance from the OMI surface (0.5 mm, 1 mm, and 1.5 mm), thus dividing the bone into four zones (zones 1, 2, 3, and 4). Figure 1 shows all compartments of the final model, including these bone zones.
Figure 1.
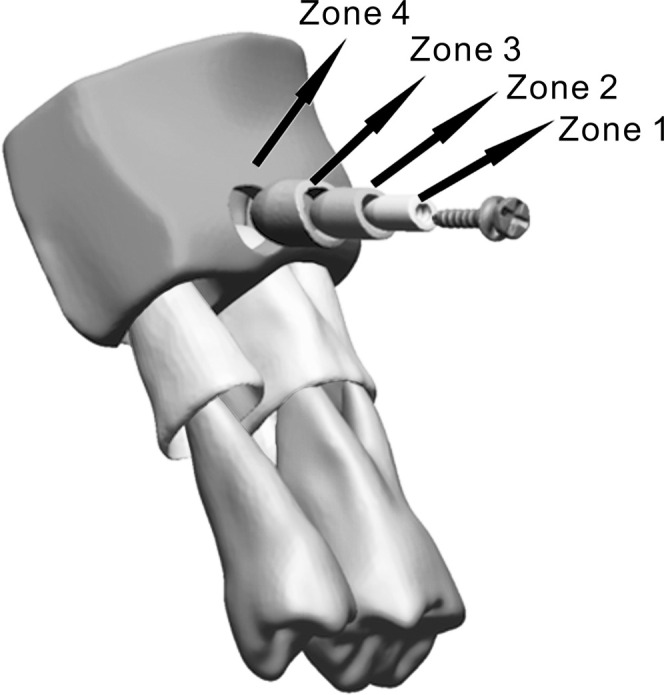
The finite element model consisted of the orthodontic mini-implant, adjacent teeth, periodontal ligament, and bone segment surrounding these structures. The bone was divided into four zones according to distance from the implant surface: zone 1 (0.0–0.5 mm), zone 2 (0.5–1.0 mm), zone 3 (1.0–1.5 mm), and zone 4 (the rest of the bone segment).
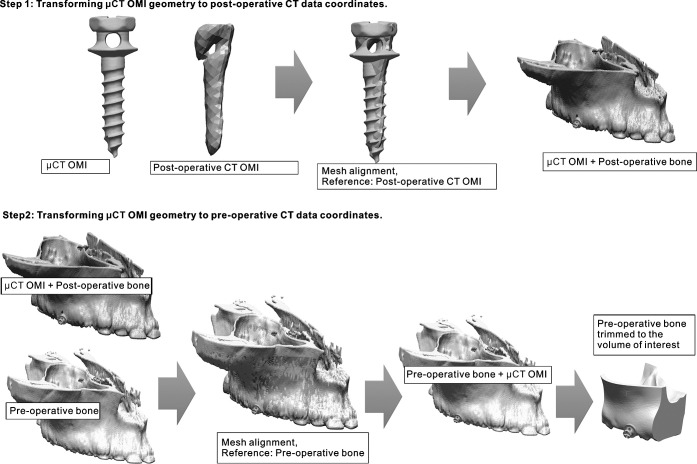
To incorporate a precise OMI geometry into the final 3D model at the exact position of OMI at operation time, the model was created using a two-step procedure explained in detail in Figure 2. The procedure uses alignment function provided by Rapidform software (INUS Technology, Seoul, Korea). This function uses a least-mean-squared algorithm to align two surface models.15 Therefore, this procedure was completely automated, and no observer-related errors affected its accuracy.
Figure 2.
In the first step, the surface model of the orthodontic mini-implant (OMI) obtained from the microcomputed tomography (µCT) data set was aligned with the rough surface model of the OMI obtained from the postoperative computed tomography (CT) data set. This step transforms the µCT-obtained OMI to the coordinates of the postoperative CT data set. In the second step, the geometry of the corresponding half of the maxilla was generated two times, the first time using the preinsertion CT data set and the second time using the postoperative data set. Then, mesh alignment between the two bone geometries (preoperative and postoperative), with the OMI model attached to the postoperative bone geometry, is performed defining the preoperative bone as the reference. This process finally transforms the µCT-obtained OMI into the coordinates of the preoperative CT data set. Once the final coordinates of the OMI model are obtained, the OMI model is saved with the new position, the preoperative hemimaxilla is trimmed to the volume of interest, and both resulting geometries (OMI and bone) are imported into the final finite element model in the Mechanical Finder.
The final 3D model was discretized with tetrahedral elements in Ansys v14 (Ansys Japan KK, Tokyo, Japan). Table 1 lists the element size for each component of the model and the rough number of elements.
Table 1.
Properties of Materials and Descriptions of Mesh in Finite Element Models
To simulate the condition of nonosseointegration at the bone-implant interface immediately after surgery, a frictionless point-to-point gap contact element was used and solved by penalty formulation.16 All other materials had shared nodes at the contact surfaces between each other (bone-PDL, PDL-tooth). In all models there was no contact between the crowns of teeth.
Finite Element Analysis
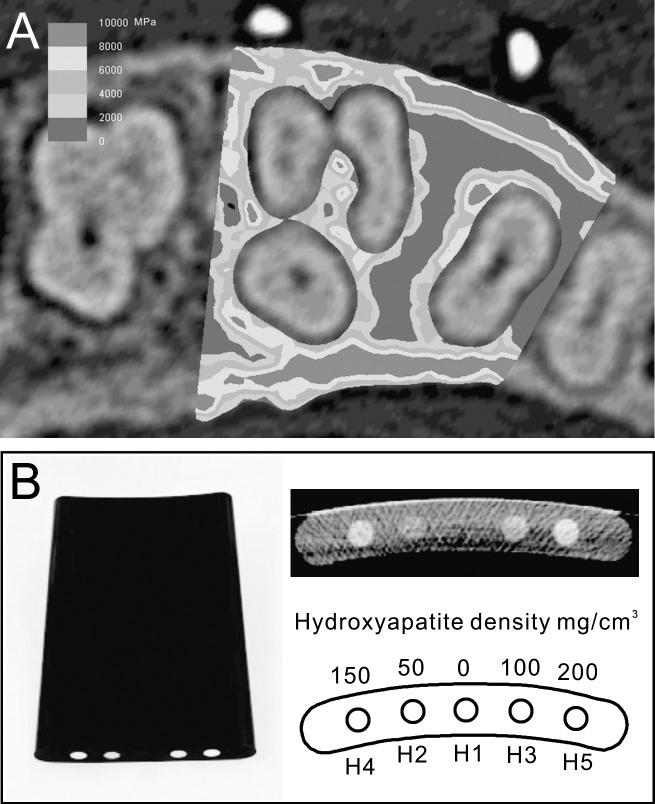
Bone elements were given heterogeneous mechanical properties based on apparent bone density (Papp), which in turn was derived from the Hounsfield unit (HU; Figure 3A). Conversion of HU to apparent density (Papp) is performed using the following formula: Papp (g/cm3) = (0.9452 × HU + 1.3465) × 0.001. The formula was developed by calibrating the CT scan of a phantom (B-MAS200, Kyoto Kagaku Co, Ltd) that contained five rods of hydroxyapatite with specific densities (Figure 3B). Apparent density was used to calculate Young's modulus using the nonlinear equation E (MPa) = 20,000 (g/cm3), which was proposed by Cong et al.,17 where Pash is the ash density. The ratio between the ash density and apparent density was considered to be equal to 0.6.18 The previous formulae were incorporated into MF, which followed an algorithm to assign the HU from the CT image voxel to the corresponding element.19 The Poisson value applied to bone was 0.3 for all elements.20 Other materials (PDL, teeth, and OMIs) were assumed to be homogeneous and were assigned values as shown in Table 1.6,21,22
Figure 3.
(A) Mesiodistal section of the finite element model showing the heterogeneous distribution of bone properties. Bone properties were derived from the preoperative computed tomography image. (B) To develop a formula that converts Hounsfield units to bone densities, a phantom with five different densities was scanned and calibrated.
A load of 2.0 N was applied to the head of the OMIin the mesial direction to simulate what would be necessary to achieve clinically effective retraction of six upper anterior teeth.23 Constraints were assigned to all cutting faces (Figure 4) that were sufficiently far from the head of the OMI. This is important in FEA to ensure that the distribution of stress and strain is accurate.24 All models were solved using the sparse matrix solver in MF, adopting linear-elasticity theory.
Figure 4.
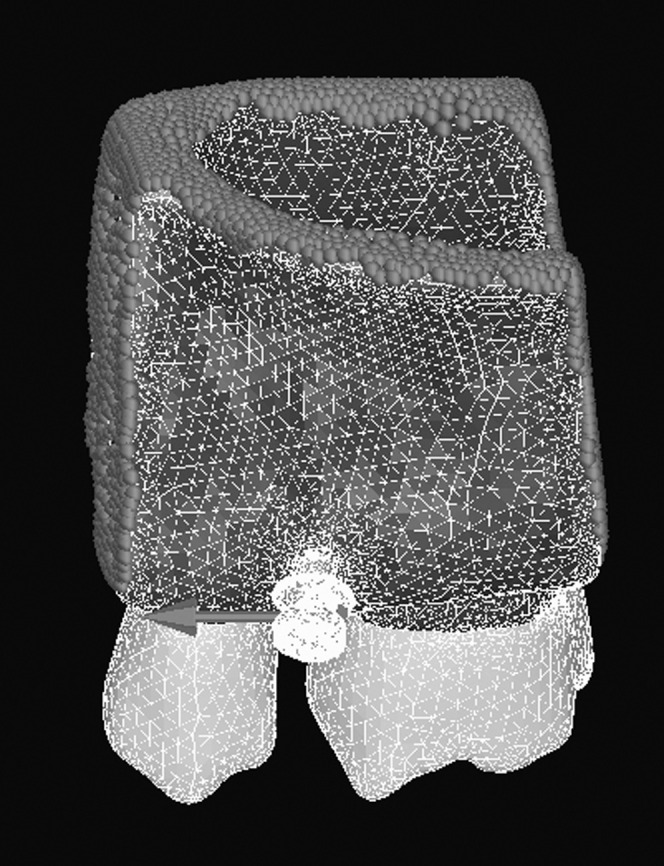
The finite element model after meshing. The constraints (red dots) are assigned to bone cutting surfaces, and a mesial load of 2 N (red arrow) is applied to the head of the implant in the mesial direction.
Parameters, Statistical Analysis, and Convergence Test
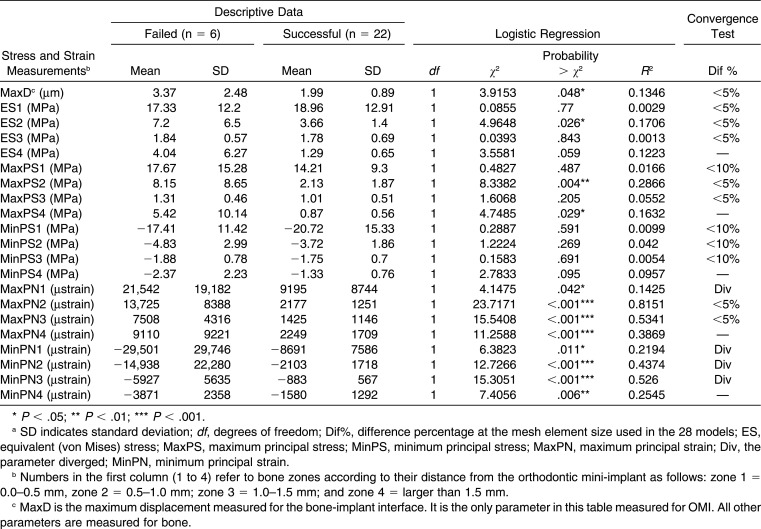
Peak values of 20 parameters related to stress and strain were calculated for each bone zone (Table 2). One parameter was calculated in the OMI model, representing the maximum displacement (MaxD) at the bone-implant contact interface (Table 2). We performed logistic regression analysis of failure (vs success) on these 21 parameters to determine which could be used as a predictive criterion for failure. The parameter that exhibited the best fit (R2) in logistic regression models for predicting OMI failure was proposed as a predictive criterion, and a prediction formula was introduced and plotted (Table 3; Figure 5). All statistical calculations were performed using JMP Pro 11 (SAS Institute Japan Inc, Tokyo, Japan).
Table 2.
Peak Values of Stress and Strain Parameters With Their Correlations to Success and Failurea
Table 3.
Predictive Formula of Failure Probability by Maximum Principle Strain in Zone 2 (MaxPN2)a
Figure 5.
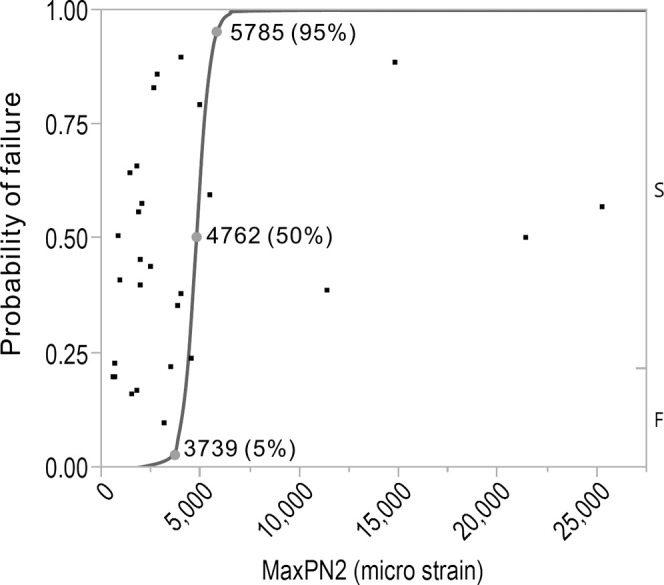
The plot (blue line) of the formula for predicting orthodontic mini-implant failure using maximum principal strain in zone 2 of bone (MaxPN2). The subjects of this study are plotted in black square dots.
Convergence of the parameters listed in Table 2 was tested by solving a series of models (five iterations) with coarser mesh size. Fine mesh size was applied only to zones 1 through 3. Although stress and strain parameters in zone 4 are reported, the main purpose for adding this zone was to ensure that boundaries were far from OMI.
RESULTS
Most of the parameters converged at the mesh element size used in the study (Table 2). Only minimum principal strain diverged in all zones.
Logistic regression analysis (Table 2) showed that peak values of principal (minimum and maximum) strain in all bone zones were significantly related to failure or success of the OMIs (P < .05). It also showed that equivalent (von Mises) and principal stresses in most bone areas were not related to failure or success. MaxD showed a significant correlation with failure (P < .05), but it explained the small amount of the variability (R2 = 0.1346).
The maximum principal strain (MaxPN) in zone 2 explained most of the variability (R2 = 0.8151; Table 2), making this parameter the one we recommend for predicting failure with good reliability. The prediction formula (Table 3, plotted in Figure 5) shows that when strain is greater than 5785 µstrain, the OMI is expected to fail with a probability greater than 95%. On the other hand, when the strain in this area is less than 3793 µstrain, it is expected to be stable with a probability greater than 95%. Between these two values, the probability of failure ranges between 5 and 95%.
DISCUSSION
Primary stability is an important factor in the success of OMIs and dental implants. Previous studies postulated a 50–200 µm threshold for immediate postoperative micromotion at the bone-implant interface,16,25 postulating that exceeding this amount would interfere with healing, causing in the development of fibrous scar tissue around the implant instead of the bone apposition. The FE models in the present study expected values for the displacement at bone-implant interface (MaxD) not exceeding 7.5 µm, well below the postulated thresholds. Although MaxD presented significant correlation to stability (P < .05), it did not have good reliability to predict failure. These findings may suggest that primary stability was not the immediate cause of the failure of OMIs analyzed in this study.
Equivalent stress (von Mises stress) is a mechanical criterion widely used in conventional mechanics to predict failures of materials and is advocated in many studies to be applicable to bone catastrophic failure prediction.9–11 Most studies that evaluated OMIs using FEA have assessed their results using equivalent stress.2–8 Recent studies26 showed that von Mises stress does not reliably predict the yielding behavior of bone and that the principal strain criterion correctly identified the risk of failure.13,27 Consistent with these studies we found equivalent stress to be significantly correlated to stability only in zone 2, and it explained only a small amount of the variation in stability observed in the sample (R2 = 0.1706). In contrast, we found that peak values of MaxPN in bone had the highest correlation to stability among all stress and strain parameters.
Considering the nature of the load applied on an OMI, failure of OMI is likely to be a result of fatigue and chronic overload rather than catastrophic failure of bone. Fatigue causes irreparable bone microdamages to accumulate with subsequent bone resorption and reduction of bone strength, causing the OMIs to loosen.28,29 Yeh and Keaveny30 showed that microdamage may occur in cancellous bone at relatively low strains of approximately 0.2% (2000 µstrain). Frost28 suggested that microdamages start to accumulate when strain exceeds 3000 µstrain. In addition, Melsen and Lang31 found that when the strain was greater than 6700 µstrain, resorption occurred in 50% of the bone surface along dental implants. Our statistical model yielded values of MaxPN close to those previously published. Our value of 5785 µstrain (failure risk 95%) is slightly lower than that reported by Melsen and Lang.31 In general, the odds ratio (Table 3) indicates that for every increase of 1000 µstrain in MaxPN in zone 2, the risk of failure increases by 288%. Taken together, the failure of OMIs within 5 months is likely caused by bone resorption induced by the increased strain that extends to areas more than 0.5 mm from the OMI surface.
MaxPN presented correlation in zone 2 that was stronger than that in zone 1. This finding may be attributed to the singularity problem in zone 1 that results from the presence of helical fissure in bone formed by the threads of OMI. As the MaxPN diverged in this zone, the singularity problem may have covered the differences between failed and successful cases. Dividing bone into different zones was useful in overcoming this problem by investigating strain in zones not affected by singularity.
As the FE modeling depends on many assumptions and simplifications, and in light of the limitations of the current study, we cannot claim that the values of parameters reported in the current study are universal, unless they are validated by clinical measurements. Because the main objective of this study was to determine the most suitable parameter for predicting failure, rather than to propose specific thresholds, the clinical outcome we had in the present study (failed or successful) was adequate to achieve our objective.
CONCLUSION
Maximum principal strain is the most reliable parameter to use for predicting OMI failure in FE models. A future study will investigate the clinical factors that may increase maximum principal strain, and thereby may play a role in the failure of OMIs.
REFERENCES
- 1.Mouhyi J, Dohan Ehrenfest DM, Albrektsson T. The peri-implantitis: implant surfaces, microstructure, and physicochemical aspects. Clin Implant Dent Relat Res. 2012;14:170–183. doi: 10.1111/j.1708-8208.2009.00244.x. [DOI] [PubMed] [Google Scholar]
- 2.Lin T-S, Tsai F-D, Chen C-Y, Lin L-W. Factorial analysis of variables affecting bone stress adjacent to the orthodontic anchorage mini-implant with finite element analysis. Am J Orthod Dentofac Orthop. 2013;143:182–189. doi: 10.1016/j.ajodo.2012.09.012. [DOI] [PubMed] [Google Scholar]
- 3.Jasmine MIF, Yezdani AA, Tajir F, Venu RM. Analysis of stress in bone and microimplants during en-masse retraction of maxillary and mandibular anterior teeth with different insertion angulations: a 3-dimensional finite element analysis study. Am J Orthod Dentofac Orthop. 2012;141:71–80. doi: 10.1016/j.ajodo.2011.06.031. [DOI] [PubMed] [Google Scholar]
- 4.Liu T-C, Chang C-H, Wong T-Y, Liu J-K. Finite element analysis of miniscrew implants used for orthodontic anchorage. Am J Orthod Dentofac Orthop. 2012;141:468–476. doi: 10.1016/j.ajodo.2011.11.012. [DOI] [PubMed] [Google Scholar]
- 5.Suzuki A, Masuda T, Takahashi I, Deguchi T, Suzuki O, Takano-Yamamoto T. Changes in stress distribution of orthodontic miniscrews and surrounding bone evaluated by 3-dimensional finite element analysis. Am J Orthod Dentofac Orthop. 2011;140:e273–e280. doi: 10.1016/j.ajodo.2011.06.025. [DOI] [PubMed] [Google Scholar]
- 6.Ammar HH, Ngan P, Crout RJ, Mucino VH, Mukdadi OM. Three-dimensional modeling and finite element analysis in treatment planning for orthodontic tooth movement. Am J Orthod Dentofac Orthop. 2011;139:e59–e71. doi: 10.1016/j.ajodo.2010.09.020. [DOI] [PubMed] [Google Scholar]
- 7.Motoyoshi M, Ueno S, Okazaki K, Shimizu N. Bone stress for a mini-implant close to the roots of adjacent teeth—3D finite element analysis. Int J Oral Maxillofac Surg. 2009;38:363–368. doi: 10.1016/j.ijom.2009.02.011. [DOI] [PubMed] [Google Scholar]
- 8.Motoyoshi M, Inaba M, Ono A, Ueno S, Shimizu N. The effect of cortical bone thickness on the stability of orthodontic mini-implants and on the stress distribution in surrounding bone. Int J Oral Maxillofac Surg. 2009;38:13–18. doi: 10.1016/j.ijom.2008.09.006. [DOI] [PubMed] [Google Scholar]
- 9.Keyak JH, Rossi SA, Jones KA, Les CM, Skinner HB. Prediction of fracture location in the proximal femur using finite element models. Med Eng Phys. 2001;23:657–664. doi: 10.1016/s1350-4533(01)00094-7. [DOI] [PubMed] [Google Scholar]
- 10.Keyak JH, Rossi SA, Jones KA, Skinner HB. Prediction of femoral fracture load using automated finite element modeling. J Biomech. 1998;31:125–133. doi: 10.1016/s0021-9290(97)00123-1. [DOI] [PubMed] [Google Scholar]
- 11.Lotz JC, Cheal EJ, Hayes WC. Fracture prediction for the proximal femur using finite element models: part II—nonlinear analysis. J Biomech Eng. 1991;113:353–360. doi: 10.1115/1.2895412. [DOI] [PubMed] [Google Scholar]
- 12.Torcasio A, Zhang X, Van Oosterwyck H, Duyck J, van Lenthe GH. Use of micro-CT-based finite element analysis to accurately quantify peri-implant bone strains: a validation in rat tibiae. Biomech Model Mechanobiol. 2012;11:743–750. doi: 10.1007/s10237-011-0347-6. [DOI] [PubMed] [Google Scholar]
- 13.Schileo E, Taddei F, Cristofolini L, Viceconti M. Subject-specific finite element models implementing a maximum principal strain criterion are able to estimate failure risk and fracture location on human femurs tested in vitro. J Biomech. 2008;41:356–367. doi: 10.1016/j.jbiomech.2007.09.009. [DOI] [PubMed] [Google Scholar]
- 14.Nalla RK, Stölken JS, Kinney JH, Ritchie RO. Fracture in human cortical bone: local fracture criteria and toughening mechanisms. J Biomech. 2005;38:1517–1525. doi: 10.1016/j.jbiomech.2004.07.010. [DOI] [PubMed] [Google Scholar]
- 15.Besl PJ, McKay HD. A method for registration of 3-D shapes. IEEE Trans Pattern Anal Mach Intell. 1992;14:239–256. [Google Scholar]
- 16.Viceconti M, Muccini R, Bernakiewicz M, Baleani M, Cristofolini L. Large-sliding contact elements accurately predict levels of bone-implant micromotion relevant to osseointegration. J Biomech. 2000;33:1611–1618. doi: 10.1016/s0021-9290(00)00140-8. [DOI] [PubMed] [Google Scholar]
- 17.Cong A, Den Buijs JO, Dragomir-Daescu D. In situ parameter identification of optimal density-elastic modulus relationships in subject-specific finite element models of the proximal femur. Med Eng Phys. 2011;33:164–173. doi: 10.1016/j.medengphy.2010.09.018. [DOI] [PMC free article] [PubMed] [Google Scholar]
- 18.Goulet RW, Goldstein SA, Ciarelli MJ, Kuhn JL, Brown MB, Feldkamp LA. The relationship between the structural and orthogonal compressive properties of trabecular bone. J Biomech. 1994;27:375–389. doi: 10.1016/0021-9290(94)90014-0. [DOI] [PubMed] [Google Scholar]
- 19.Motohashi T, Nakajima M, Shoju Y, et al. Three-dimensional finite element stress analysis of the different bioabsorbable osteosynthesis plate forms in the bilateral sagittal splitting ramus osteotomy. Asian J Oral Maxillofac Surg. 2011;23(1):10–17. [Google Scholar]
- 20.Hart RT, Natali AN, Pavan PG, Knets I. Mechanics of bone tissue. In: Natali A, editor. Dental Biomechanics. Taylor & Francis; 2003. pp. 1–19. [Google Scholar]
- 21.Ruse ND. Propagation of erroneous data for the modulus of elasticity of periodontal ligament and gutta percha in FEM/FEA papers: a story of broken links. Dent Mater. 2008;24:1717–1719. doi: 10.1016/j.dental.2008.04.006. [DOI] [PubMed] [Google Scholar]
- 22.Keaveney TM. Cancellous bone. In: Black J, Hastings G, editors. Handbook of Biomaterial Properties. London, UK: Chapman Hall; 1998. pp. 15–23. [Google Scholar]
- 23.Samuels RH, Rudge SJ, Mair LH. A comparison of the rate of space closure using a nickel-titanium spring and an elastic module: a clinical study. Am J Orthod Dentofac Orthop. 1993;103:464–467. doi: 10.1016/S0889-5406(05)81798-6. [DOI] [PubMed] [Google Scholar]
- 24.Armstrong CG. Modelling requirements for finite-element analysis. Comput Des. 1994;26:573–578. [Google Scholar]
- 25.Szmukler-Moncler S, Piattelli A, Favero GA, Dubruille JH. Considerations preliminary to the application of early and immediate loading protocols in dental implantology. Clin Oral Implants Res. 2000;11:12–25. doi: 10.1034/j.1600-0501.2000.011001012.x. [DOI] [PubMed] [Google Scholar]
- 26.Kelly N, Harrison NM, McDonnell P, McGarry JP. An experimental and computational investigation of the post-yield behaviour of trabecular bone during vertebral device subsidence. Biomech Model Mechanobiol. 2013;12:685–703. doi: 10.1007/s10237-012-0434-3. [DOI] [PubMed] [Google Scholar]
- 27.Bayraktar HH. The modified super-ellipsoid yield criterion for human trabecular bone. J Biomech Eng. 2005;126:677–684. doi: 10.1115/1.1763177. [DOI] [PubMed] [Google Scholar]
- 28.Frost H. A 2003 update of bone physiology and Wolff's law for clinicians. Angle Orthod. 2004;74:3–15. doi: 10.1043/0003-3219(2004)074<0003:AUOBPA>2.0.CO;2. [DOI] [PubMed] [Google Scholar]
- 29.Hernandez CJ, Lambers FM, Widjaja J, Chapa C, Rimnac CM. Quantitative relationships between microdamage and cancellous bone strength and stiffness. Bone. 2014;66:205–213. doi: 10.1016/j.bone.2014.05.023. [DOI] [PMC free article] [PubMed] [Google Scholar]
- 30.Yeh OC, Keaveny TM. Relative roles of microdamage and microfracture in the mechanical behavior of trabecular bone. J Orthop Res. 2001;19:1001–1007. doi: 10.1016/S0736-0266(01)00053-5. [DOI] [PubMed] [Google Scholar]
- 31.Melsen B, Lang NP. Biological reactions of alveolar bone to orthodontic loading of oral implants. Clin Oral Implants Res. 2001;12:144–152. doi: 10.1034/j.1600-0501.2001.012002144.x. [DOI] [PubMed] [Google Scholar]


