

Abstract
Teduglutide is a recombinant analog of human glucagon‐like peptide‐2 that regulates the functional and structural integrity of the cells lining the gastrointestinal tract. Teduglutide is approved for the treatment of patients with short bowel syndrome (SBS) who are dependent on parenteral support (PS). Population pharmacokinetic (PK) and exposure‐response analyses were performed to support teduglutide dosing in patients with SBS. The analysis included 219 patients with SBS (aged <1 year, 5 patients; 1–11 years, 86 patients; 12–17 years, 8 patients; 18–79 years, 120 patients), and 259 non‐SBS subjects (including healthy volunteers and subjects with renal or liver impairment). A one‐compartment model with first‐order absorption and linear elimination adequately characterized the PKs of teduglutide. In patients with SBS, the apparent clearance (CL/F), volume of distribution (V/F), and elimination half‐life of teduglutide were 16.0 L/h, 33.9 L, and 1.47 h, respectively. CL/F depended on body weight and renal function, and V/F depended on body weight and age. Maximum concentration (C max) of teduglutide was similar in adult and pediatric patients, and in Japanese and non‐Japanese patients. A time‐ and exposure‐response model dependent on the C max of teduglutide adequately characterized the reduction in PS over more than 2 years of treatment. Daily dosing of 0.05 mg/kg teduglutide resulted in a maximum reduction in PS of 5.76 L/week. Higher C max values were associated with a more important reduction in PS over time. Adult and pediatric patients with SBS presented similar PKs and response to teduglutide.
Study Highlights.
WHAT IS THE CURRENT KNOWLEDGE ON THE TOPIC?
Short bowel syndrome (SBS) is a malabsorption disorder that usually results from surgical resection of bowel but can also occur as a congenital condition. It manifests as a collection of signs and symptoms, such as malabsorption, diarrhea, fluid and electrolyte disturbances, and malnutrition, and patients with SBS may require long‐term parenteral support (PS). Teduglutide is a recombinant analog of naturally occurring human glucagon‐like peptide‐2, approved for the treatment of PS‐dependent patients with SBS in the United States, Canada, and Europe.
WHAT QUESTION DID THIS STUDY ADDRESS?
What the population pharmacokinetic (PK) properties are of teduglutide and exposure‐response relationship in Japanese and non‐Japanese adult (18–79 years) and pediatric (4 months–17 years) patients with SBS, and how teduglutide exposure is related to the treatment response.
WHAT DOES THIS STUDY ADD TO OUR KNOWLEDGE?
PK properties and exposure parameters of teduglutide in Japanese adult and pediatric patients with SBS are similar to those observed in non‐Japanese adult and pediatric patients with SBS. Teduglutide clearance is dependent on body weight and renal function, and volume of distribution is dependent on body weight and age. The exposure‐response model shows that higher maximum concentrations of teduglutide are associated with a greater reduction in PS volume over time.
HOW MIGHT THIS CHANGE CLINICAL PHARMACOLOGY OR TRANSLATIONAL SCIENCE?
The population PK properties and exposure‐response relationship of teduglutide support the selection of 0.05 mg/kg daily treatment as the effective dose regimen in adult and pediatric patients with SBS.
INTRODUCTION
Short bowel syndrome (SBS) is a malabsorption disorder usually caused by the surgical removal of a major portion of the small intestine secondary to Crohn’s disease, mesenteric vascular complications, trauma, or extensive aganglionosis. 1 It can also occur as a congenital condition in infants born with intestinal atresia. SBS typically occurs when there is less than 200 cm of functioning small bowel and manifests as a collection of signs and symptoms, such as malabsorption, diarrhea, steatorrhea, fluid and electrolyte disturbances, and malnutrition. In newborn infants, the 4‐year survival rate on parenteral nutrition is ~ 70%. 1 , 2
Teduglutide is a recombinant analog of naturally occurring human glucagon‐like peptide‐2, which regulates the functional and structural integrity of the cells lining the gastrointestinal tract. Teduglutide is approved in the United States and Europe for the treatment of patients aged greater than or equal to 1 year with SBS who are dependent on parenteral support (PS). 3 , 4 Teduglutide is administered subcutaneously (s.c.), and rapidly absorbed following injection, with maximum plasma levels occurring ~ 3–5 h after dosing. 3 , 4 The rate and extent of absorption is dose‐proportional at single and repeated doses up to 20 mg with no accumulation. 4 Teduglutide has a terminal elimination half‐life of ~ 2 h, and elimination of teduglutide occurs primarily via the kidneys. 4 Daily s.c. administrations of teduglutide (0.05 mg/kg) in patients with SBS achieved a higher responder rate, defined as greater than or equal to 20% reduction from baseline in the volume of PS (parenteral nutrition/intravenous fluids [PN/IV]), relative to placebo‐treated patients with standard of care (63% vs. 30%; p = 0.002). 5 The safety profile was favorable in adult patients with SBS in the teduglutide (0.05 mg/kg) dosing group and no new safety signals were identified during the 24‐week study. The incidence of adverse events leading to discontinuation of teduglutide treatment was less than 5%. 5
Population pharmacokinetic (PopPK) and exposure‐response analyses were performed to support dosing of teduglutide in adult and pediatric patients with SBS. In addition, PopPK and exposure‐response relationships of teduglutide in Japanese and non‐Japanese patients were evaluated.
METHODS
Data sources and clinical studies
All studies were conducted in accordance with legal and regulatory requirements, as well as the general principles set forth in the International Ethical Guidelines for Biomedical Research Involving Human Subjects, the International Conference on Harmonisation Guidelines for Good Clinical Practice, and the Declaration of Helsinki. In addition, the studies were conducted in accordance with protocols and applicable local regulatory requirements and laws. Informed consent forms used in these studies and any changes made during the course of the studies were prospectively approved by the institutional review board/ethics committee and the sponsor before use. The investigator ensured that each study subject, or his/her legal representative, was fully informed about the nature and objectives of the study and possible risks associated with participation. The investigator, or a person designated by the investigator, obtained written informed consent from each subject or the subject’s legal representative before any study‐specific activity was performed.
Data collected in 17 clinical studies, used in registration applications and prescribing information labels, were analyzed to characterize the PK properties of teduglutide. A brief description of clinical studies in healthy subjects, special populations (hepatic or renal impairment), and patients with SBS included are provided in Tables S1–S3. The PopPK analysis included healthy subjects from clinical studies to assess: (1) the PKs of teduglutide following single‐ and multiple‐ascending doses; (2) the bioavailability of teduglutide and the effect of the site of injection (thigh, abdomen, or arm); and (3) potential impact on cardiac repolarization and conduction (ALX‐0600‐1621/13, CL0600‐022, CL0600‐006, CL0600‐015, and C09‐001). Studies in special populations were also included in the PopPK analysis to assess the effect of hepatic and renal impairment on the PK of teduglutide (CL0600‐017 and CL0600‐018). Studies in non‐Japanese adult and pediatric patients with SBS (ALX‐0600–92001, CL0600‐004, CL0600‐021, TED‐C13‐003, TED‐C14‐006, and SHP633‐301) and Japanese adult and pediatric patients with SBS (TED‐C14‐004, SHP633‐302, SHP633‐306, and SHP633‐307) were included in the PopPK analysis. A total of 10 studies in SBS was included in the exposure‐response analysis.
Population PK analysis of teduglutide
A one‐compartment disposition model with a first‐order absorption rate constant (K a) and an absorption lag time (ALAG), including allometric functions on PK parameters (K a, apparent clearance [CL/F], and volume of distribution [V/F]) was previously developed. 6 This model was used as a starting point to assess the PK of teduglutide using data collected in 17 studies. Overall, the PopPK models for teduglutide consisted of the following: (1) description of the relationships between plasma concentration and time; (2) a variance component characterizing between‐subject variability in model parameters; and (3) residual unexplained variability, which was modeled using additive, proportional, or additive and proportional models.
The PopPK model had the following form:
where Cpij is the concentration at the j th collection time tj for subject i, Di represents dosing history for subject i, θi is the vector of p PK parameters for subject i, and εp , ij and εa , ij are the proportional and additive random residual error terms, respectively, associated with j th concentration for subject i. The and are normally distributed with mean 0 and variances σp 2 and σa 2 , respectively.
Between‐subject variability was modeled using exponential random‐effect models with the form:
where θ ink is the value of the n th PK parameter of the i th individual on the k th occasion, θTV , n is the typical value of the n th PK parameter in the population, η in is the random interindividual deviation from the typical value θ TV, n for subject, and ψ ink is the random interoccasion subject deviation from the value of the nth parameter for subject i on occasion k. Interindividual random effects (η 1, …, ηp ), also known as ETAs, are multivariate normally (MVN) distributed with mean 0 and estimated variance ωn 2 included in the variance‐covariance OMEGA (Ω) matrix.
Residual variability was described by a model with an additive and a proportional component, as described below:
where yij and ŷij represent the j th observed and predicted concentration, respectively, for the i th individual, and ε1ij and ε2ij are the proportional and additive random residual effect, respectively. Each ε is normally distributed with mean 0 and variance σ2.
An allometric model with estimated exponents for the effect of body weight on K a, CL/F, and V/F was included in the base PK model because a very wide range in body weight (5.15–127 kg) was available in the population. Model evaluation was based on standard model diagnostics and goodness‐of‐fit criteria (e.g., log‐likelihood difference) and by looking at pertinent graphical representations of goodness‐of‐fit (e.g., fitted and observed concentrations vs. time, weighted residuals vs. time). 7 The relationships between PK parameters (random effects) and covariates was explored graphically. Scatter matrix plots presenting the relationships between the individual random effect (i.e., η 1, …, η m) and continuous variables included locally weighted scatter plot smoothing (LOESS), Pearson coefficients of correlation, and the corresponding p value for each relationship. Box plots were used to describe the relationship for categorical covariates. The following intrinsic covariates were evaluated: age, weight, sex, race, liver impairment categories (as per Child‐Pugh categories 8 ), markers of liver function (alanine transferase, aspartate transferase, and bilirubin), marker of renal function (creatinine clearance derived using the Cockcroft–Gault equation for patients >12 years of age and the Modified Schwartz equation for patients <12 years of age normalized to weight 9 ), renal impairment categories (normal, mild, moderate, severe, and end‐stage renal disease [ESRD], for patients <12 years, classification was based on estimated glomerular filtration rate 10 ), disease status (healthy, SBS, and hepatic or renal impairment), and the presence of antidrug antibodies (ADAs). The following extrinsic covariates were evaluated: site of s.c. administration (abdomen, arm, thigh, and missing), dose (therapeutic vs. supra‐therapeutic [20 mg]), formulation strength (1.25, 2.5, 5, 10, 14, 20, and 65 mg/vial), and bioanalytical assays. The effect of covariates on PK parameters of teduglutide was assessed using forward inclusion (change in objective function value [ΔOFV] of 3.84, p less than 0.05 for one degree of freedom) and backward exclusion (ΔOFV of 6.63, p < 0.01 for one degree of freedom) procedures. 11 A truncated likelihood method (M3 method) was implemented to take into account the censoring of measurable teduglutide plasma concentrations that were below the limit of quantitation. 12
The performance of the final PopPK model of teduglutide was evaluated using several diagnostic plots, 7 as well as a prediction‐corrected visual predictive check (VPC). 13 On the basis of the final model, concentration–time profiles were simulated using 1000 replicates. Within each bin, nonparametric 95% confidence intervals of the 2.5th, 50th, and 97.5th percentiles of predicted‐corrected concentrations were computed and compared to the 2.5th, 50th, and 97.5th percentiles of observed‐corrected concentrations. These percentiles were plotted against time after teduglutide s.c. administration to visually assess concordance between the model‐based simulated data and the observed data. The percentages of observed‐corrected data falling below or above the simulation‐based prediction‐corrected interval were calculated. 13
Rich concentration–time profiles were simulated with the final PopPK model to derive exposure metrics, such as the area under the curve over the dosing interval at steady‐state (AUCss) and maximum concentration at steady‐state (C max,ss) following repeated dosing of teduglutide.
Exposure‐response analysis
The relationship between teduglutide steady‐state exposure (C max) and PS volume was evaluated using a time‐ and exposure‐response model as described below:
where E max represents the maximum change from baseline, t and ET50 are the time and the time associated with 50% of the maximum change from baseline, respectively. ΔPPSV is the change from baseline prescribed PS volume (i.e., PN/IV volume). Exposure‐response analysis was also performed for PPSV (raw) by integrating a baseline (E0) parameter in the model. The drug effect was expressed as E max. The ET50 was estimated according to long‐term studies (>2 years), and then fixed, and other parameters were estimated based on all studies. Model evaluation was based on standard model diagnostics and goodness‐of‐fit criteria (e.g., log‐likelihood difference) and by looking at pertinent graphical representations of goodness‐of‐fit. 7 Potential residual effects of dose on E max were explored.
Software
The PopPK analysis was performed using NONMEM (version 7.4.3; ICON plc; see Supporting Information). The exposure‐response analysis was performed using Phoenix NLME (version 8.0; Certara USA, Inc.). Data set preparation, exploration, and figures were derived using R (version 3.6 or higher; R Foundation for Statistical Computing).
RESULTS
Baseline characteristics
In total, 478 subjects were included in the PopPK analysis. Descriptive statistics of baseline characteristics of healthy subjects and patients with SBS were derived by populations (Tables S4 and S5). Briefly, the PK population included 25 Japanese patients with SBS (14 adults and 11 pediatrics), 194 non‐Japanese patients with SBS (106 adults and 88 pediatrics), and 259 non‐SBS subjects (including healthy subjects, and subjects with renal or liver impairment). All Japanese patients (adult and pediatric) received the 0.05 mg/kg dosage, and non‐Japanese patients (adult and pediatric) received dosages ranging from 0.0125 to 0.15 mg/kg. Of the 25 Japanese patients in the analysis, 20 received s.c. injection in the abdomen and five received it in the arm or thigh. In 194 non‐Japanese patients in the analysis, 102 received s.c. injection in the abdomen and 68 received s.c. injection in the arm or thigh (and 24 did not have the site of injection recorded). All patients with SBS received formulation strength ranging from 1.25 to 10 mg/vial, and non‐SBS subjects received formulation strength ranging from 5 to 65 mg/vial.
The population consisted of 302 (63.2%) male subjects. The majority of subjects were of White origin (81.6%). The analysis included 219 patients with SBS (5 patients <1 year, 86 patients 1–11 years, 8 patients 12–17 years, and 120 adult patients [18–79 years]) and 259 non‐SBS subjects (including healthy subjects and subjects with renal or liver impairment). Overall, 346 (72.4%) subjects had normal renal function, and 78 (16.3%), 40 (8.4%), and seven (1.5%) subjects presented with mild, moderate, and severe renal impairment, respectively, and six (1.3%) subjects had ESRD. Median age and body weight in the overall population were 34.5 years and 65.5 kg, respectively. The median (range) age of Japanese and non‐Japanese patients with SBS were 31.0 years (0.758–53.0 years) and 28.0 years (0.380–80.0 years), respectively. The median (range) body weight of Japanese and non‐Japanese patients with SBS were 45.0 kg (5.15–74.9 kg) and 45.8 kg (7.04–87.9 kg), respectively. The median (range) creatinine clearance (CrCL) in Japanese and non‐Japanese patients with SBS were 89.0 ml/min (54.0–192 ml/min) and 72.6 ml/min (26.0–251 ml/min), respectively. Median CrCL in the overall population was 99.4 ml/min.
Population PK analysis of teduglutide
The data set included 6775 samples evaluated for teduglutide concentrations, of which 768 (10.2%) were below the limit of quantitation. As a result, a truncated likelihood method that takes into account the censoring of below the limit of quantitation data (M3 method) was implemented in the PopPK model. 12 The number of subjects and concentrations available in each study is presented in Table S6. Individual concentrations in adult and pediatric patients with SBS by dose levels are presented in Figure 1. Peak concentrations were observed after 3–5 h of dosing, then declined rapidly. Similar concentration–time profiles were observed in healthy subjects (Figure S1). A one‐compartment model with linear elimination and allometric components accounting for the effect of body weight on K a, CL/F, and V/F was used in a first step. The base PK model adequately fitted the observed teduglutide concentrations, and sources of variability were explored (Figures S2–S13). Based on the exploratory figures, the following covariates were tested on CL/F and V/F: alanine transferase, age, sex, race, dose, and disease status (healthy vs. patients with SBS). In addition, CrCL was tested on CL/F, formulation strength on ALAG, race on K a, assay on the relative bioavailability, and dose on K a and ALAG. Time‐varying covariates such as ADA and site of injection were formally tested in the model due to poor graphical presentation. A summary of covariates resulting in the most important reduction in the OFV and included in each step of the analysis is presented in Table S7. The effect of teduglutide formulation strength on ALAG resulted in the most important decrease in OFV as part of the first step of the analysis. In the second iteration, effect of site of injection on K a resulted in the most important decrease in OFV. In the third and fourth iterations, the effect of CrCL and disease status on CL/F resulted in the most important decrease in OFV. In subsequent iterations, the effects of dose (supra‐therapeutic) on ALAG (5th iteration), age on V/F (6th iteration), site of injection on ALAG and on relative bioavailability (7th and 8th iterations, respectively), and sex on CL/F (9th iteration) resulted in the most important decreases in OFV. No other covariates were included as part of the forward testing and none of covariates were removed during the backward testing. The goodness‐of‐fit derived with the final PopPK model in adults and pediatrics patients with SBS are presented in Figure S14. Observed concentrations versus both individual and population predicted values fell along the line of identity. Observed median, 5th, and 95th percentiles of teduglutide concentrations were contained within the model‐predicted ranges (shaded areas) in adults and pediatrics patients with SBS (Japanese and non‐Japanese) as per VPC (Figure 2).
FIGURE 1.

Concentration–time profile of teduglutide in adult and pediatric patients with SBS (semi‐log scale). Profiles are shown by dose for adult (upper panels) and pediatric (lower panels) patients. Black circles represent observed concentrations; black lines represent locally weighted scatter plot smoothing (LOESS). SBS, short bowel syndrome
FIGURE 2.
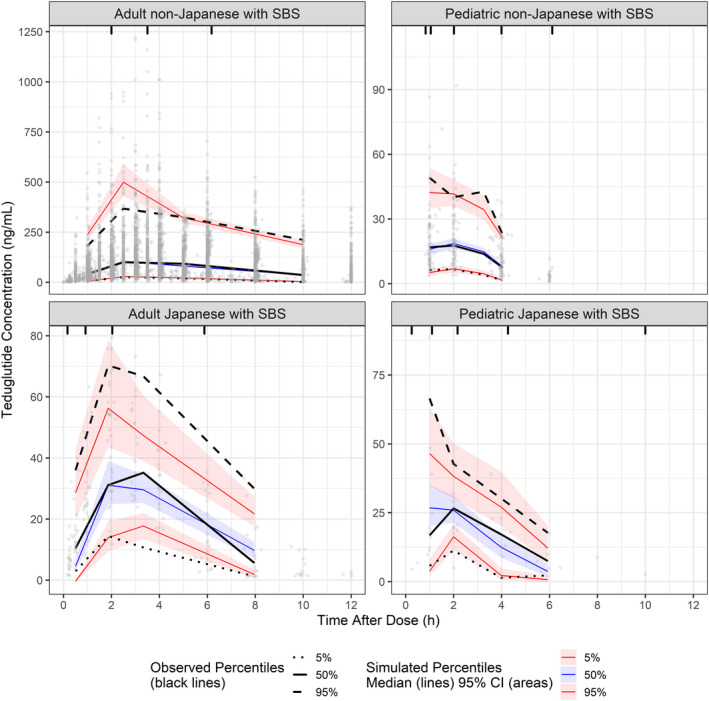
Visual predictive check of teduglutide concentrations in adult and pediatric Japanese and non‐Japanese patients with SBS. Panels show teduglutide concentrations up to 12 h postdose for adult (left) and pediatric (right) patients. Gray circles represent the individual subject data. Black lines show the observed median (solid), 5th (dotted) and 95th (dashed) percentiles of teduglutide concentrations. Colored solid lines and shaded areas indicate the model‐predicted median and associated 95% confidence interval (CI) for the median (blue), 5th (lower red), and 95th (upper red) percentiles of teduglutide concentrations. SBS, short bowel syndrome
Population estimates of CL/F, V/F, and the terminal elimination half‐life (t 1/2) of teduglutide were 16.0 L/h, 33.9 L, and 1.47 h, respectively (Table S8). The rate of absorption following s.c. dosing was 0.330 h−1. The absorption lag time was 0.299 h, corresponding to 17.9 min. The weight exponent for CL/F was 0.488, suggesting lower CL/F values in lighter subjects. The CrCL exponent for CL/F was 0.341, suggesting lower CL/F values in subjects with lower CrCL. The typical CL/F in healthy subjects was ~ 33% lower than in patients with SBS. Female subjects presented a 7% lower CL/F relative to male subjects. Race (Japanese vs. non‐Japanese) did not have an impact on CL/F. The weight exponent for V/F was 1.35, suggesting lower V/F values in lighter subjects. The age exponent for V/F was −0.312, suggesting higher V/F values in younger subjects. Race (Japanese vs. non‐Japanese) did not have an impact on V/F. The typical K a in subjects receiving s.c. injections in the arm or thigh was 23% lower compared with those receiving s.c. injections in the abdomen, which is not considered clinically significant, as the expected impact on efficacy would be less than 20%, based on the exposure‐response model. The relative bioavailability following administration other than in the abdomen (i.e., thigh and arm) were 7% lower. The lag time of absorption was dependent on the site of injection, formulation strength, and supra‐therapeutic dose. Race (Japanese vs. non‐Japanese) did not have an impact on K a.
A summary of descriptive statistics of PK parameters of teduglutide following s.c. administration of 0.05 mg/kg in adult and pediatric Japanese and non‐Japanese patients with SBS are presented in Table 1. The mean C max,ss of teduglutide following s.c. dosing of 0.05 mg/kg in Japanese and non‐Japanese adult patients were 46.3 and 37.5 ng/ml, respectively. The mean AUCss in Japanese and non‐Japanese adult patients were 232 and 216 ng.h/ml, respectively. Overall, the mean C max,ss and AUCss of teduglutide in Japanese adult patients were 23% and 7.4% higher, respectively, than those observed in non‐Japanese adult patients. The mean t 1/2 of teduglutide in Japanese and non‐Japanese adult patients were 1.10 and 1.24 h, respectively. In Japanese and non‐Japanese pediatric (<18 years) patients, mean C max,ss were 32.2 and 34.5 ng/ml, respectively, and mean AUCss were 102 and 126 ng.h/ml, respectively. Overall, the mean C max,ss and AUCss in Japanese pediatric patients were within 20% of those observed in non‐Japanese pediatric patients. The mean t 1/2 of teduglutide in Japanese and non‐Japanese pediatric patients were 0.89 and 1.00 h, respectively.
TABLE 1.
Pharmacokinetic parameters of teduglutide following s.c. dosing of 0.05 mg/kg in Japanese and non‐Japanese patients with SBS
| Parameters a | Adults (0.05 mg/kg) | Pediatrics (0.05 mg/kg) | ||
|---|---|---|---|---|
| Japanese (n = 14) | Non‐Japanese (n = 51) | Japanese (n = 11) | Non‐Japanese (n = 43) | |
| K a (h−1) | ||||
| Mean (CV%) | 0.476 (21.8) | 0.399 (26.2) | 1.03 (57.3) | 0.838 (34.6) |
| Median (min, max) | 0.469 (0.273, 0.658) | 0.380 (0.226, 0.630) | 0.828 (0.353, 2.17) | 0.839 (0.354, 1.82) |
| 95% CI | 0.282–0.647 | 0.253–0.615 | 0.426–2.15 | 0.447–1.47 |
| CL/F (L/h) | ||||
| Mean (CV%) | 11.8 (23.4) | 14.5 (24.4) | 8.64 (48.9) | 7.62 (33.5) |
| Median (min, max) | 11.5 (7.62, 18.7) | 14.3 (7.35, 23.3) | 8.90 (3.06, 18.9) | 7.08 (1.69, 16.0) |
| 95% CI | 7.91–17.3 | 9.35–21.9 | 3.37–17.0 | 4.74–13.4 |
| V/F (L) | ||||
| Mean (CV%) | 18.3 (28.3) | 26.0 (33.9) | 12.3 (85.4) | 11.1 (42.4) |
| Median (min, max) | 16.8 (11.6, 28.9) | 25.0 (12.3, 50.0) | 10.9 (2.98, 41.1) | 10.0 (3.60, 26.5) |
| 95% CI | 12.0–27.5 | 13.0–47.3 | 3.01–35.3 | 5.16–21.4 |
| AUCss (ng.h/ml) | ||||
| Mean (CV%) | 232 (22.8) | 216 (26.6) | 102 (30.5) | 126 (40.3) |
| Median (min, max) | 224 (153, 325) | 203 (119, 381) | 95.5 (58.2, 154) | 123 (57.3, 409) |
| 95% CI | 151–305 | 129–341 | 59.8–154 | 80.9–179 |
| C max,ss (ng/ml) | ||||
| Mean (CV%) | 46.3 (23.8) | 37.5 (31.9) | 32.2 (36.9) | 34.5 (37.1) |
| Median (min, max) | 47.3 (29.0, 61.8) | 34.6 (19.5, 75.4) | 27.3 (20.8, 62.8) | 32.5 (20.7, 85.0) |
| 95% CI | 30.1–66.1 | 20.8–58.2 | 21.3–57.2 | 21.9–70.4 |
| t 1/2 (h) | ||||
| Mean (CV%) | 1.10 (27.7) | 1.24 (23.9) | 0.89 (33.0) | 1.00 (18.4) |
| Median (min, max) | 1.08 (0.726, 1.78) | 1.28 (0.692, 2.08) | 0.85 (0.481, 1.51) | 1.02 (0.537, 1.48) |
| 95% CI | 0.734–1.650 | 0.775–1.85 | 0.503–1.42 | 0.702–1.29 |
Abbreviations: AUCss, area under the curve over the dosing interval at steady‐state; CI, confidence interval; CL/F, apparent clearance; C max,ss, maximum concentration at steady‐state; CV%, percentage of coefficient of variation; max, maximum; min, minimum; K a, rate constant of absorption; t 1/2, terminal elimination half‐life; SBS, short bowel syndrome; V/F, apparent volume of distribution.
Predicted parameters derived from the population pharmacokinetic model.
The mean CL/F and V/F of teduglutide in Japanese patients with mild renal impairment (12.3 L/h and 18.3 L, respectively) were within 10% of those observed in Japanese patients with normal renal function (12.7 L/h and 20.0 L, respectively). In contrast, the CL/F and V/F of teduglutide in Japanese patients with moderate renal impairment (8.06 L/h and 15.3 L, respectively) were 37% and 24% lower than those observed in Japanese patients with normal renal function, respectively. These results were similar to those observed in non‐Japanese patients with SBS with mild and moderate renal impairment (Table S9).
Exposure‐response analysis
PS is represented by PN/IV volumes prescribed on a weekly basis in patients with SBS. Across all studies, 4918 measurements of prescribed PS volume were available, and 249 patients with baseline values were included in the analysis. Exploratory analyses were performed to assess the longitudinal profiles of PS volume following long‐term (>2 years) versus short‐term (~ 6 months) treatment. Individual PS volume profiles after more than 2 years of treatment with teduglutide (0.05 mg/kg) in adult patients with SBS are presented in Figure 3. A plateau of effect was apparent after more than 1 year of treatment. Individual profiles of prescribed PS volume in other studies performed over 168 days (~ 6 months) are presented by dose levels in Figure 4. Prescribed PS volume decreased over the study duration, and all active treatments appeared to result in a greater reduction in prescribed PS volume than placebo with standard of care.
FIGURE 3.

Change from baseline prescribed PS volume in adult patients with SBS—long‐term study. Gray circles and gray lines represent individual subject data; black line represents a smoothing function. Data are presented for study CL0600‐021 (an extension of study CL0600‐020); the time in study CL0600‐021 is shown relative to study CL0600‐020. PS, parenteral support; SBS, short bowel syndrome
FIGURE 4.

Change from baseline prescribed PS volume in patients with SBS—short‐term studies. Panels show the change from baseline for different teduglutide doses and placebo for adult and pediatric patients (upper and lower panels, respectively). Gray circles and gray lines represent individual subject data; black lines represent a smoothing function. PS, parenteral support; SBS, short bowel syndrome
In a first step, longitudinal data from studies performed for more than 2 years were modeled to assess the effect of time (duration of treatment), and then the effect of teduglutide exposure was evaluated. Covariate analysis showed no residual effect of dose on E max, with the exception of the 0.1 mg/kg dose level, which was included as a covariate in the model. Parameters derived with the final time‐ and exposure‐response model for the change from baseline in prescribed PS volume are presented in Table S10. ET50 was 168 days, and E max of teduglutide on prescribed PS volume was −5.76 L/week with a relative standard error of 8.71%. A model with an E max dependent on the C max of teduglutide was superior to a model based on AUC. The goodness‐of‐fit derived with the final time‐ and exposure‐response model is presented in Figure S15. Observed change from baseline PS volume versus both individual and population predicted values fell along the line of identity. Observed median, 5th, and 95th percentiles of change from baseline PS volume were contained within the model‐predicted ranges (shaded areas) in patients with SBS as per the VPC (Figure 5).
FIGURE 5.
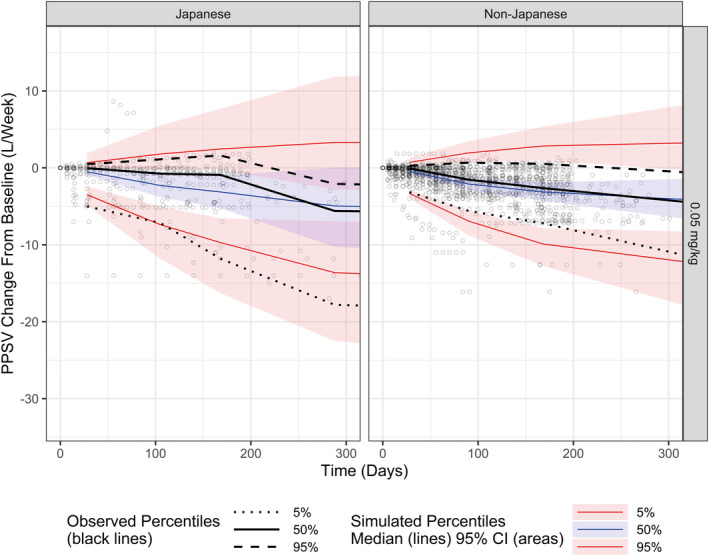
Visual predictive check of change from baseline in prescribed PS volume in Japanese patients and non‐Japanese patients. Panels show the change from baseline for Japanese patients (left) and non‐Japanese patients (right). Gray circles represent the individual subject data. Black lines show the observed median (solid), 5th (dotted), and 95th (dashed) percentiles of change. Colored solid lines and shaded areas indicate the model‐predicted median and associated 95% confidence interval for the median (blue), 5th (lower red), and 95th (upper red) percentiles of change. CI, confidence interval; PPSV, prescribed PS volume; PS, parenteral support
The final time‐ and exposure‐response model was used to derive the change from baseline on day 168 and under steady‐state conditions (2 years). Descriptive statistics of change from baseline PS volume in adult and pediatric Japanese and non‐Japanese patients are presented in Table 2. Adult Japanese and non‐Japanese patients presented baseline PS volume of 15.6 and 10.1 L/week, respectively, and maximum change from baseline of PS volume of −9.76 and −5.54 L/week, respectively, which correspond to percent change from baseline of −62.6% and −54.9%, respectively. Japanese and non‐Japanese pediatric patients presented baseline prescribed PS volume of 8.33 and 7.47 L/week, respectively. The maximum change from baseline of prescribed PS volume in Japanese and non‐Japanese pediatric patients were −2.47 and −5.58 L/week, respectively, which correspond to percent change from baseline of −29.7% and −74.7%, respectively.
TABLE 2.
Change from baseline prescribed PS volume in Japanese and non‐Japanese patients with SBS receiving teduglutide (0.05 mg/kg)
| Parameters a | Adults (0.05 mg/kg) | Pediatrics (0.05 mg/kg) | ||
|---|---|---|---|---|
| Japanese (n = 14) | Non‐Japanese (n = 51) | Japanese (n = 10) | Non‐Japanese (n = 43) | |
| Baseline | ||||
| PPSV (L/week) | ||||
| Mean (CV%) | 15.6 (46.5%) | 8.70 (64.6%) | 7.47 (44.1%) | 10.1 (48.7%) |
| Median (min, max) | 13.7 (7.00, 35.0) | 7.16 (3.38, 21.2) | 6.88 (2.43, 18.7) | 9.60 (3.50, 24.5) |
| 95% CI | 7.65, 32.0 | 4.05, 22.3 | 3.45, 19.7 | 2.99, 14.4 |
| Week 24 | ||||
| Change in PPSV from baseline (L/week) | ||||
| Mean (CV%) | −4.88 (78.7%) | −1.51 (148.0%) | −2.79 (127.9%) | −2.77 (89.0%) |
| Median (min, max) | −3.85 (−12.5, 0.0631) | −0.771 (−5.81, 1.39) | −1.97 (−16.3, 2.47) | −2.12 (−11.9, 0.604) |
| 95% CI | −12.2, 0.0215 | −9.57, −0.0590 | −5.61, 1.51 | −14.2, 0.703 |
| Steady‐state | ||||
| Maximum change in PPSV from baseline (L/week) | ||||
| Mean (CV%) | −9.76 (78.7%) | −3.03 (148.0%) | −5.58 (127.9%) | −5.54 (89.0%) |
| Median (min, max) | −7.71 (−24.9, 0.126) | −1.54 (−11.6, 2.79) | −3.94 (−32.6, 4.95) | −4.25 (−23.7, 1.21) |
| 95% CI | −24.3, 0.0430 | −19.1, −0.118 | −11.2, 3.03 | −28.5, 1.41 |
Abbreviations: CI, confidence interval; CV%, percentage of coefficient of variability; max, maximum; min, minimum; PPSV, prescribed parenteral support volume; PS, parenteral support; SBS, short bowel syndrome.
Predicted parameters derived from the exposure‐response model.
DISCUSSION
PopPK analyses were performed to investigate the factors associated with variability in teduglutide exposure, in patients with SBS. The PopPK analyses used data from 17 studies in pediatric and adult patients with SBS and in non‐SBS subjects (healthy subjects and subjects with renal or hepatic impairment), and PopPK parameters were also compared for Japanese and non‐Japanese patients with SBS.
Teduglutide mainly undergoes urinary excretion. 14 As per the PopPK model, the CL/F of teduglutide was mainly dependent on CrCL. Mean CL/F values in Japanese patients with moderate renal impairment were ~ 37% lower than those observed in Japanese patients with normal renal function. Although none of the Japanese patients presented with severe renal impairment, a 50% dosage reduction is recommended for patients with moderate or severe renal impairment or ESRD based on results derived in non‐Japanese patients. A single‐dose study in non‐Japanese adults showed that the primary PK parameters of teduglutide increased with increased severity of renal impairment, and that AUCinf and C max values in individuals with ESRD were more than twofold higher than those in healthy volunteers. 15 Descriptive statistics of PK parameters were derived for adults and pediatric patients with SBS in Japanese and non‐Japanese populations. Overall, results from the current PopPK analysis confirmed that Japanese adult and pediatric (0–17 years) patients with SBS presented similar PK properties and exposure parameters of teduglutide as those observed in non‐Japanese adult and pediatric patients with SBS.
Population estimates of CL/F and V/F of teduglutide (16.0 L/h and 33.9 L, respectively), as well as the typical half‐life of teduglutide (1.47 h), were consistent with those derived in previous PopPK analyses of teduglutide involving data from eight clinical studies. 6 In the current analyses, the rate of absorption of teduglutide was 0.330 h−1 with an absorption lag time of 17.9 min, suggesting total absorption of teduglutide within ~ 10 h of dosing. Body weight was an important component describing the variability in PK parameters of teduglutide. The current analysis showed that weight has an effect on both CL/F and V/F of teduglutide, and that, overall, lower CL/F and V/F values are expected in lighter/younger subjects. Age also showed an effect on PK parameters. The AUCss values were age‐dependent and gradually decreased from adults to children. After taking into account the effect of body weight (on K a, CL/F, and V/F), an important residual effect of age was observed on V/F. Based on this effect, higher V/F values are expected in pediatric patients. For example, typical subjects of 0.38 and 80 years of age (corresponding to minimum and maximum values in the population) are expected to have V/F values fourfold higher and 23% lower (137 L and 26.0 L, respectively) relative to a typical subject of 34 years of age (33.9 L). This analysis shows the contrasting effects of age and body weight on V/F, and illustrates how the final PK parameters in a given patient will reflect the interplay among various factors.
The effect of body weight and maturation functions were explored on PK parameters of teduglutide. 16 , 17 A PopPK model integrating fixed exponents for CL/F and V/F (1 and 0.75, respectively) with and without maturation functions of estimated glomerular filtration rate did not result in improvements in statistical estimators of goodness‐of‐fit (Tables S11–S13).
The effect of body weight on PK parameters is consistent with the previous PopPK analyses, which reported important effects of weight on V/F and elimination half‐life and a minor effect on CL/F, and showed that lower values for each parameter were expected at lower body weights. 6 Predicted AUC values increased with increasing body weight. 6 However, even heavier participants had predicted exposure values of teduglutide following s.c. dosing within the safety and tolerability range shown in an earlier multiple ascending‐dose study. 6 , 18
A longitudinal exposure‐response model was developed to assess the relationship between teduglutide exposure and the change from baseline in weekly prescribed PS volume in Japanese and non‐Japanese pediatric with SBS. A long‐term extension study (CL0600‐021) provided extensive PS volume data collected over 2 years, and was of particular importance in characterizing the long‐term effect of teduglutide on PS volume. 19 In non‐Japanese patients treated with 0.05 mg/kg teduglutide, a plateau of effect was apparent after more than 1 year of dosing. A time associated with 50% of the maximum change from baseline (ET50) of 168 days allowed to fit adequately the long‐term data. All other studies in non‐Japanese adult patients were performed over 168 days (24 weeks) and thus did not allow characterization of the long‐term effect. Previous work suggested that modeling longitudinal changes from baseline may result in biased parameter estimates. 20 As part of the current analysis, modeling was also performed using raw PS volume data with a model integrating baseline estimates along with between‐subject variability. Results derived for the time‐ and exposure‐response model based on the raw data resulted in E max (−5.24 L/week), relative standard error (8.26%), and goodness‐of‐fit similar to those derived when using change from baseline (Table S14 and Figure S16). The same longitudinal exposure‐response model was also tested using the steady‐state area under the teduglutide concentration‐time profile as exposure metric. The model with C max obtained better goodness of fit diagnostics and was selected as the final model.
Overall, the PK properties of teduglutide in adult and pediatric patients with SBS, as well as the exposure‐response relationship between C max and prescribed PS volume, support the selection of 0.05 mg/kg daily treatment as the effective dose regimen in patients with SBS.
CONFLICT OF INTEREST
C.J., T.P., and J.‐F.M. are paid consultants of Certara. Y.W. is an employee of Takeda.
AUTHOR CONTRIBUTIONS
Y.W., J.F.M., C.J., and T.P. wrote the manuscript. Y.W. designed the research. Y.W., J.F.M., C.J., and T.P. performed the research. Y.W., J.F.M., C.J., and T.P. analyzed the data.
Supporting information
Supplementary Material
Supplementary Material
ACKNOWLEDGEMENTS
Editorial support, funded by Shire International GmbH, a Takeda company, Zurich, Switzerland, was provided by Andrew Mayhook, PhD, of Oxford PharmaGenesis (Oxford, UK).
Marier J‐F, Jomphe C, Peyret T, Wang Y. Population pharmacokinetics and exposure‐response analyses of teduglutide in adult and pediatric patients with short bowel syndrome. Clin Transl Sci. 2021;14:2497–2509. 10.1111/cts.13117
Funding information
This research was funded by Takeda, Lexington, Massachusetts, USA.
REFERENCES
- 1. Burness CB, McCormack PL. Teduglutide: a review of its use in the treatment of patients with short bowel syndrome. Drugs. 2013;73:935‐947. [DOI] [PubMed] [Google Scholar]
- 2. Kim ES, Keam SJ. Teduglutide: a review in short bowel syndrome. Drugs. 2017;77:345‐352. [DOI] [PubMed] [Google Scholar]
- 3. Shire‐NPS Pharmaceuticals Inc . GATTEX® (Teduglutide) Prescribing Information. Shire‐NPS Pharmaceuticals Inc; 2019. [Google Scholar]
- 4. Shire Pharmaceuticals Ireland Limited . Revestive® (Teduglutide) Summary of Product Characteristics. Shire Pharmaceuticals Ireland Limited; 2019. [Google Scholar]
- 5. Jeppesen PB, Pertkiewicz M, Messing B, et al. Teduglutide reduces need for parenteral support among patients with short bowel syndrome with intestinal failure. Gastroenterology. 2012;143:1473‐1481 e1473. [DOI] [PubMed] [Google Scholar]
- 6. Marier JF, Mouksassi MS, Gosselin NH, Beliveau M, Cyran J, Wallens J. Population pharmacokinetics of teduglutide following repeated subcutaneous administrations in healthy participants and in patients with short bowel syndrome and Crohn’s disease. J Clin Pharmacol. 2010;50:36‐49. [DOI] [PubMed] [Google Scholar]
- 7. Nguyen TH, Mouksassi M‐S, Holford N, et al. Model evaluation of continuous data pharmacometric models: metrics and graphics. CPT Pharmacometrics Syst Pharmacol. 2017;6:87‐109. [DOI] [PMC free article] [PubMed] [Google Scholar]
- 8. US Food and Drug Administration . Pharmacokinetics in patients with impaired hepatic function: study design, data analysis, and impact on dosing and labeling. 2003. https://www.fda.gov/downloads/drugs/guidancecomplianceregulatoryinformation/guidances/ucm072123.pdf. Accessed November 11, 2020.
- 9. US Food and Drug Administration . General clinical pharmacology considerations for pediatric studies for drugs and biological products. Guidance for industry. 2014. https://www.fda.gov/downloads/drugs/guidances/ucm425885.pdf. Accessed November 11, 2020.
- 10. US Food and Drug Administration . Pharmacokinetics in patients with impaired renal function ‐ study design, data analysis, and impact on dosing and labeling. 2010. https://www.fda.gov/downloads/Drugs/Guidances/UCM204959.pdf. Accessed November 11, 2020.
- 11. Jonsson EN, Karlsson MO. Automated covariate model building within NONMEM. Pharm Res. 1998;15:1463‐1468. [DOI] [PubMed] [Google Scholar]
- 12. Beal SL. Ways to fit a PK model with some data below the quantification limit. J Pharmacokinet Pharmacodyn. 2001;28:481‐504. [DOI] [PubMed] [Google Scholar]
- 13. Bergstrand M, Hooker AC, Wallin JE, Karlsson MO. Prediction‐corrected visual predictive checks for diagnosing nonlinear mixed‐effects models. AAPS J. 2011;13:143‐151. [DOI] [PMC free article] [PubMed] [Google Scholar]
- 14. Ruiz‐Grande C, Pintado J, Alarcon C, Castilla C, Valverde I, Lopez‐Novoa JM. Renal catabolism of human glucagon‐like peptides 1 and 2. Can J Physiol Pharmacol. 1990;68:1568‐1573. [DOI] [PubMed] [Google Scholar]
- 15. Nave R, Halabi A, Herzog R, et al. Pharmacokinetics of teduglutide in subjects with renal impairment. Eur J Clin Pharmacol. 2013;69:1149‐1155. [DOI] [PubMed] [Google Scholar]
- 16. Rhodin MM, Anderson BJ, Peters AM, et al. Human renal function maturation: a quantitative description using weight and postmenstrual age. Pediatr Nephrol. 2009;24:67‐76. [DOI] [PubMed] [Google Scholar]
- 17. Mouksassi MS, Marier JF, Cyran J, Vinks AA. Clinical trial simulations in pediatric patients using realistic covariates: application to teduglutide, a glucagon‐like peptide‐2 analog in neonates and infants with short‐bowel syndrome. Clin Pharmacol Ther. 2009;86:667‐671. [DOI] [PubMed] [Google Scholar]
- 18. Marier JF, Beliveau M, Mouksassi M‐S, et al. Pharmacokinetics, safety, and tolerability of teduglutide, a glucagon‐like peptide‐2 (GLP‐2) analog, following multiple ascending subcutaneous administrations in healthy subjects. J Clin Pharmacol. 2008;48:1289‐1299. [DOI] [PubMed] [Google Scholar]
- 19. Schwartz LK, O’Keefe SJ, Fujioka K, et al. Long‐term teduglutide for the treatment of patients with intestinal failure associated with short bowel syndrome. Clin Transl Gastroenterol. 2016;7:e142. [DOI] [PMC free article] [PubMed] [Google Scholar]
- 20. Dansirikul C, Silber HE, Karlsson MO. Approaches to handling pharmacodynamic baseline responses. J Pharmacokinet Pharmacodyn. 2008;35:269‐283. [DOI] [PubMed] [Google Scholar]
Associated Data
This section collects any data citations, data availability statements, or supplementary materials included in this article.
Supplementary Materials
Supplementary Material
Supplementary Material