Abstract
Both adequate coverage and adherence to paediatric immunisation schedules are required for optimal protection against vaccine preventable diseases. We studied the timeliness of routine paediatric vaccinations according to the NHS’s immunisation schedule and potential factors of schedule adherence. Immunisation data was obtained from the Royal College of General Practitioners (RCGP) Research and Surveillance Centre (RSC). We collected vaccine types, doses, and dates for all routine paediatric vaccines between 2008 and 2018: DTaP/IPV/Hib/HepB, DTaP/IPV/Hib, DTaP/IPV, dTaP/IPV, Td/IPV, MMR, PCV, MenB, MenC, MenACWY, Hib/MenC, RV, HPV. Adherence to the immunisation schedule was calculated for each vaccine and dose. Differences in adherence between genders, NHS regions, and IMD quintiles were analysed. Our study included 6′257′828 vaccinations in 1′005′827 children. Seventy-five percent of first doses were administered within one (for vaccines scheduled in the first year of life) or two months (for vaccines scheduled later in life) following the recommended age, 19% too late and 6% too early. About half of the subsequent doses were given timely. The time between first and second doses was too short for 36% of vaccinations while 13% of second doses were administered too long after the first dose. Third doses were administered timely for 45%, too short for 37%, and too long for 18% of vaccinations. Differences in immunisation schedule adherence between girls and boys were negligible, except for HPV, and differences between the four main NHS regions were small. Overall, immunisation schedule adherence improved slightly with decreasing deprivation according to the Index of Multiple Deprivation. Efforts are required to improve the timeliness of paediatric vaccinations and to assure adequate protection against vaccine preventable diseases. We propose developing a compound measure combining coverage and adherence to provide a better indication of the protection against vaccine preventable diseases in a community.
Keywords: Adherence, Children, Immunisation schedule, Minors, Vaccination, Vaccines
Nomenclature
- Abbreviation
Meaning
Vaccines:
- DTaP/HepB/IPV/Hib
Diphtheria and tetanus toxoids and acellular pertussis adsorbed, hepatitis B, inactivated poliovirus, and Haemophilus influenzae type b conjugate vaccine
- DTaP/IPV/Hib
Diphtheria and tetanus toxoids and acellular pertussis adsorbed, inactivated poliovirus, and Haemophilus influenzae type b conjugate vaccine
- DTaP/IPV or dTaP/IPV
Diphtheria and tetanus toxoids and acellular pertussis adsorbed, and inactivated poliovirus vaccine
- HepB
Hepatitis B vaccine
- Hib/Men
Haemophilus influenzae type b conjugate, and bivalent meningococcal conjugate vaccine
- HPV
Human papillomavirus vaccine
- MenACWY
Quadrivalent meningococcal conjugate vaccine
- MenB
Serogroup B meningococcal vaccine
- MenC
Serogroup C meningococcal vaccine
- MMR
Measles, mumps, and rubella vaccine
- PCV
Pneumococcal conjugate vaccine
- RV
Rotavirus vaccine
- Td/IPV
Tetanus and diphtheria toxoids and inactivated poliovirus vaccine
Terms:
- GP
General Practitioner
- IMD
Index of Multiple Deprivation
- IQR
Interquartile Range
- OR
Odds Ratio
- RCGP
Royal College of General Practitioners
- RSC
Research and Surveillance Centre
1. Introduction
Both coverage and adherence to paediatric immunisation schedules are essential to assure optimal protection against vaccine preventable diseases early in life. Routine paediatric vaccination coverage rates in England between 2008 and 2018 varied between vaccines, ranging from the lowest for measles-mumps-rubella vaccine (MMR) with 78% in 2008–2009 [1] and the highest for diphtheria-tetanus-pertussis-poliovirus-Haemophilus influenzae b vaccine (DTaP/IPV/Hib) with 95% in 2012–2013 [2]. However, high coverage rates may overestimate protection when adherence to the immunisation schedule - i.e. the timeliness of vaccinations - is low [3]. Despite high vaccination coverage, non-adherence to the recommended immunisation schedule may jeopardise the intended protection by vaccination. Late vaccinations may leave a child vulnerable to vaccine-preventable diseases for a longer than intended period, while vaccines received earlier or at shorter intervals than recommended may lead to a suboptimal immune response and a false sense of protection [3], [4], [5].
The National Health Services (NHS) and Public Health England’s immunisation schedule for 2018 recommended 19 vaccinations (first and subsequent doses) for 17 different antigens, at eight moments between birth and 14 years (Fig. 1) [6]. Nevertheless, actual vaccine administration might not happen according to the schedule for various reasons. Insight in non-adherence to vaccination schedules is essential to inform measures to improve adherence to vaccination schedules. This will eventually improve protection against vaccine preventable diseases in the population and minimise the risk of adverse events. Our study assessed the timeliness of routine paediatric vaccinations according to the NHS’ immunisation schedule, and explored potential factors of adherence to the schedule.
Fig. 1.
Routine paediatric immunisation schedule NHS 2018. [6]
2. Methods
We extracted data from the Oxford-Royal College of General Practitioners (RCGP) Research and Surveillance Centre (RSC), a national, electronic primary health care medical record database in England, managed by the Clinical Informatics and Health Outcome Research Group at University of Surrey [7]. The RCGP RSC comprises patient data from over 100 participating general practices across England and a recent cohort profile of this database demonstrated it is representative for the English population [8].
Our cohort study included all children who were between 0 and 18 years old during the study period from 1 January 2008 to 31 December 2018, and received a routine paediatric vaccine. Children were excluded from analyses if they were registered in the database after the scheduled age for the first dose of a vaccine. Children’s birthdays recorded in the database were limited to month and year of birth. Therefore, birthdates were rounded to the first of the month in the analysis. Every child in the database had a unique, anonymised identifier. For each child, we also collected the gender, the NHS-region of residence in England (North England; Midlands and East England; London; South England), and the postcode-based Index of Multiple Deprivation (IMD) quintiles (1 being most deprived, 5 being least deprived) [9].
Vaccination types, doses, and dates were collected for all routinely scheduled paediatric vaccines by Public Health England between 2008 and 2018: DTaP/IPV/Hib/HepB, DTaP/IPV/Hib, DTaP/IPV, dTaP/IPV, Td/IPV, MMR, PCV, MenB, MenC, MenACWY, Hib/MenC, RV, HPV [6], [10], [11], [12], [13], [14], [15], [16], [17]. Tuberculosis and HepB vaccinations were only recommended for children with underlying medical conditions and excluded from analysis. Influenza vaccines and any vaccines that were not listed on the paediatric immunisation schedules at any time during the study period were also excluded. Dose numbers were assigned based on the chronological sequence of administration for each vaccine type.
The recommended age for immunisation was determined by the age listed in the immunisation schedule that was valid at the time of vaccination (see Table 1). We defined vaccination “within 1 month following recommended age” when a scheduled first dose of a vaccine was received at the recommended age or within one month thereafter for vaccines scheduled in the first year of life, or vaccination “within 2 months following recommended age” for vaccines received at the recommended age or within 2 months thereafter for first doses scheduled later in life.
Table 1.
Scheduled ages, gaps, and time windows applied in this study.
| Vaccine and dose | Scheduled age | Scheduled gap following preceding dose | Maximum age/gap applied |
|---|---|---|---|
| DTaP/IPV/Hib/HepB 1 | 8 weeks | – | 12.3 weeks |
| DTaP/IPV/Hib/HepB 2 | 12 weeks | 4 weeks | 8.3 weeks |
| DTaP/IPV/Hib/HepB 3 | 16 weeks | 4 weeks | 8.3 weeks |
| DTaP/IPV/Hib 1 | before 2016: 2 months since 2016: 8 weeks |
– | before 2016: 3 months since 2016: 12.3 weeks |
| DTaP/IPV/Hib 2 | before 2016: 3 months since 2016: 12 weeks |
before 2016: 1 month since 2016: 4 weeks |
before 2016: 2 months since 2016: 8.3 weeks |
| DTaP/IPV/Hib 3 | before 2016: 4 months since 2016: 16 weeks |
before 2016: 1 month since 2016: 4 weeks |
before 2016: 2 months since 2016: 8.3 weeks |
| DTaP/IPV 1 or dTaP/IPV | 2009–2011: 40–60 months since 2011: 40 months |
– | 2009–2011: 61 months since 2011: 41 months |
| Td/IPV 1 | before 2009: 13–18 years 2009–2011: 15 years 2011–2013: 13–18 years since 2013: 14 years |
– | before 2009: 18 years + 1 month 2009–2011: 15 years + 1 month 2011–2013: 18 years + 1 month since 2013: 14 years + 1 month |
| MMR 1 | until 2009: 13 months 2009–2011: 15 months 2011–2016: 12–13 months since 2016: 1 year |
– | until 2009: 14 months 2009–2011: 16 months 2011–2016: 14 months since 2016: 1 year + 1 month |
| MMR 2 | 2009–2011: 40–60 months since 2011: 40 months |
until 2009: 17 months 2009–2011: 25–45 months 2011–2016: 27–28 months since 2016: 28 months |
until 2009: 18 months 2009–2011: 46 months since 2011: 29 months |
| PCV 1 | before 2016: 2 months since 2016: 8 weeks |
– | before 2016: 3 months since 2016: 12.3 weeks |
| PCV 2 | before 2016: 4 months since 2016: 16 weeks |
before 2016: 2 months since 2016: 8 weeks |
before 2016: 3 months since 2016: 12.3 weeks |
| PCV 3 | until 2009: 13 months 2009–2011: 15 months 2011–2016: 12–13 months since 2016: 1 year |
until 2009: 9 months 2009–2011: 11 months 2011–2016: 8–9 months since 2016: 36 weeks |
until 2009: 10 months 2009–2011: 12 months 2011–2016: 10 months since 2016: 40.3 weeks |
| MenB 1 | 8 weeks | – | 12.3 weeks |
| MenB 2 | 16 weeks | 8 weeks | 12.4 weeks |
| MenB 3 | 1 year | 36 weeks | 40.3 weeks |
| MenC 1 | 3 months | – | 4 months |
| MenC 2 | before 2013: 4 months since 2013: 14 years |
before 2013: 1 month since 2013: 13 years + 9 months |
before 2013: 2 months since 2013: 13 years + 10 months |
| MenACWY | 14 years | – | 14 years + 1 month |
| Hib/MenC 1 | until 2011: 12 months 2011–2016: 12–13 months since 2016: 1 year |
– | until 2011: 13 months 2011–2016: 14 months since 2016: 1 year + 1 month |
| Rotavirus 1 | before 2016: 2 months since 2016: 8 weeks |
– | before 2016: 3 months since 2016: 12.3 weeks |
| Rotavirus 2 | before 2016: 3 months since 2016: 12 weeks |
before 2016: 1 month since 2016: 4 weeks |
before 2016: 2 months since 2016: 8.3 weeks |
| HPV 1 | 12–13 years | – | 13 years + 1 month |
| HPV 2 | 12–14 years | – | 14 years + 1 month |
The recommended age for first doses was calculated as a time range, reflecting that birth dates were rounded to the first day of the month in the database: the first day of the window assuming a child born on the first day of the given month and the last day of the window assuming a child born on the last day of the given month. The recommended time intervals between subsequent doses were defined by the difference in age between doses according to the immunisation schedule valid at the time of vaccination. Vaccination “within 1 month following recommended interval” was defined as having received the subsequent dose at the recommended time interval or within one month thereafter for doses scheduled in the first year of life, or “within 2 months following recommended interval” for subsequent doses received within 2 months after the recommended time interval for doses scheduled later in life. The applied time windows were determined based on paediatricians’ feedback about real-life immunisation practices, immunisation guidelines, literature indicating that immunisations within one month after the recommended age are not uncommon and tolerated [18], [19], [20], [21], [22], and correspond to time windows used in similar studies [23], [24], [25], [26], [27], [28], [29].
Any vaccines given before the scheduled age were considered early and those after the scheduled age plus the defined windows late. Subsequent doses given within a shorter period than recommended by the immunisation schedule were classified as a too short gap, or when given beyond the scheduled gap plus the defined window as a too long gap. We only included vaccines administered and did not consider missed vaccinations.
Timeliness of vaccination according to the immunisation schedule was calculated for each vaccine and dose as the proportion of children who received the vaccine within the determined time windows. For each vaccine and dose, deviation from the scheduled age or gap was calculated as the number of months a vaccine was given before or after the defined time windows. Also the distribution of all vaccinations around their time windows was assessed. We analysed differences in timeliness between genders, NHS regions, and IMD quintiles for each vaccine and dose using Pearson’s chi-square test and logistic regression, as well as the impact of the timeliness of preceding doses on the timeliness of subsequent doses. We used a significance level of 0.05 to determine whether on vaccination within 1 month (for doses scheduled in the first year of life) or 2 months (for doses later in life) following the recommended time was independent of any of the potential factors or not. Logistic regression coefficients were transformed to odd ratios to quantify the impact of these factors. All analyses were performed in R [30].
3. Results
We analysed 6′257′828 vaccine jabs, covering 15′182′366 antigens, in 1′005′827 children meeting our inclusion criteria. The study population was representative for the entire population in the database (see Table 2). Twenty percent of children received all their vaccines within the defined time windows.
Table 2.
Key variables study sample compared to population in database.
| Immunisations |
Children |
|||||||
|---|---|---|---|---|---|---|---|---|
| Sample |
Database |
Sample |
Database |
|||||
| n | % | N | % | n | % | n | % | |
| Total | 6,257,828 | 100 | 8,083,825 | 100 | 1,005,827 | 100 | 1,149,892 | 100 |
| Gender | ||||||||
| Female | 3,316,654 | 53.0 | 4,260,954 | 52.7 | 554,218 | 55.1 | 613,028 | 53.3 |
| Male | 2,941,174 | 47.0 | 3,822,871 | 47.3 | 451,609 | 44.9 | 536,864 | 46.7 |
| Region | ||||||||
| London | 1,230,368 | 19.7 | 1,569,082 | 19.4 | 182,774 | 18.2 | 207,922 | 18.1 |
| Midlands and East | 1,063,025 | 17.0 | 1,379,538 | 17.1 | 168,861 | 16.8 | 193,846 | 16.9 |
| North | 1,945,646 | 31.1 | 2,503,791 | 31.0 | 318,034 | 31.6 | 365,689 | 31.8 |
| South | 2,018,789 | 32.3 | 2,631,414 | 32.6 | 336,158 | 33.4 | 382,435 | 33.3 |
| IMD | ||||||||
| 1 | 1,163,036 | 18.9 | 1,490,016 | 18.8 | 182,923 | 18.5 | 210,269 | 18.7 |
| 2 | 1,128,030 | 18.4 | 1,454,788 | 18.3 | 179,850 | 18.2 | 206,181 | 18.3 |
| 3 | 1,135,039 | 18.5 | 1,460,684 | 18.4 | 181,663 | 18.4 | 208,307 | 18.5 |
| 4 | 1,257,428 | 20.5 | 1,627,364 | 20.5 | 204,479 | 20.7 | 233,233 | 20.7 |
| 5 | 1,457,420 | 23.7 | 1,900,810 | 24.0 | 237,484 | 24.1 | 268,885 | 23.9 |
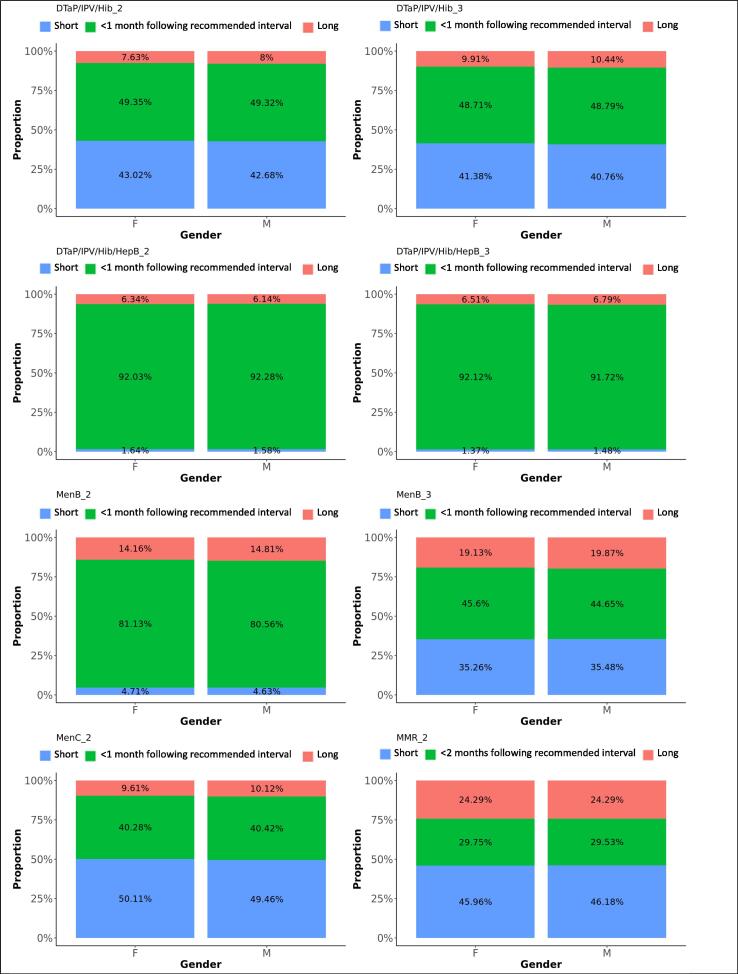
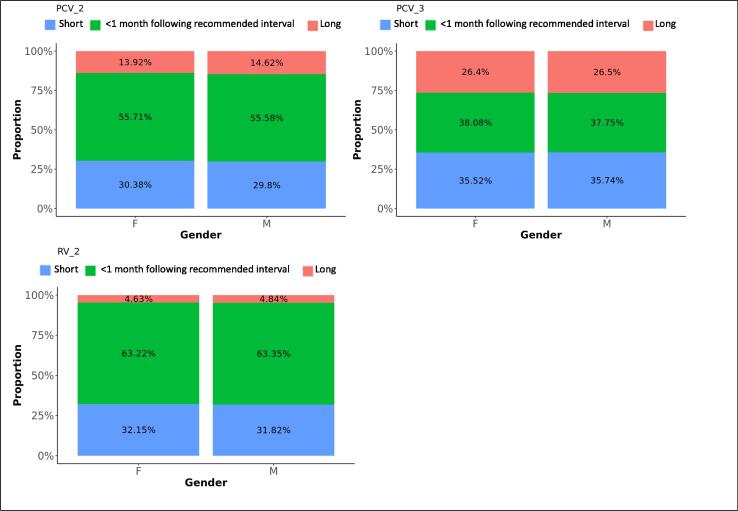
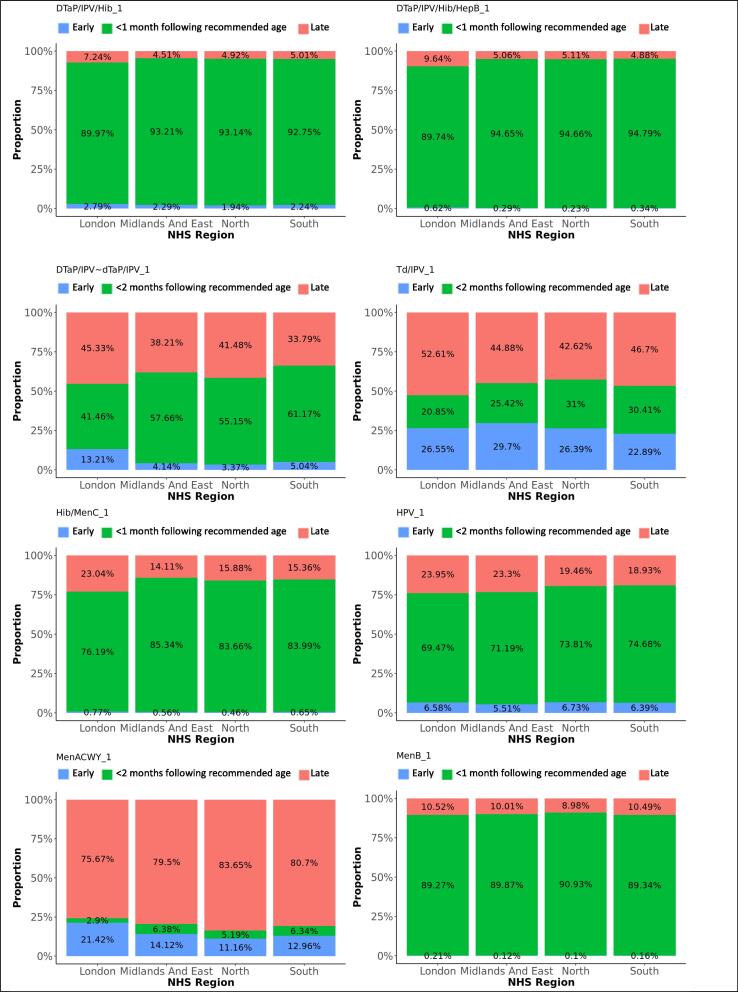
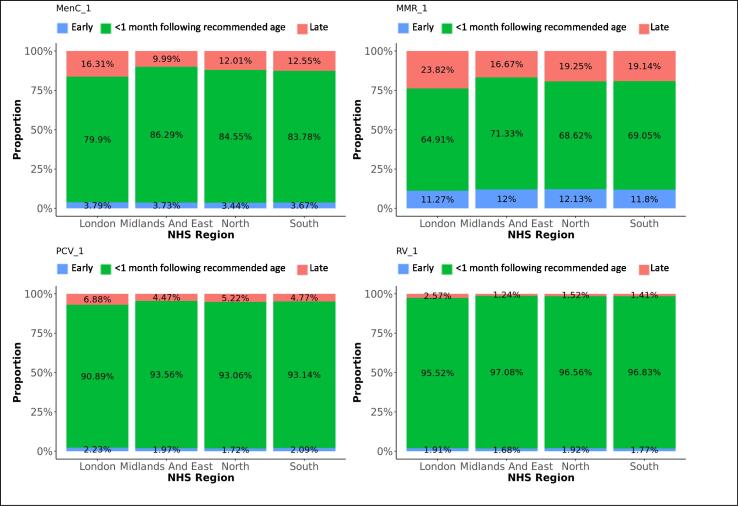
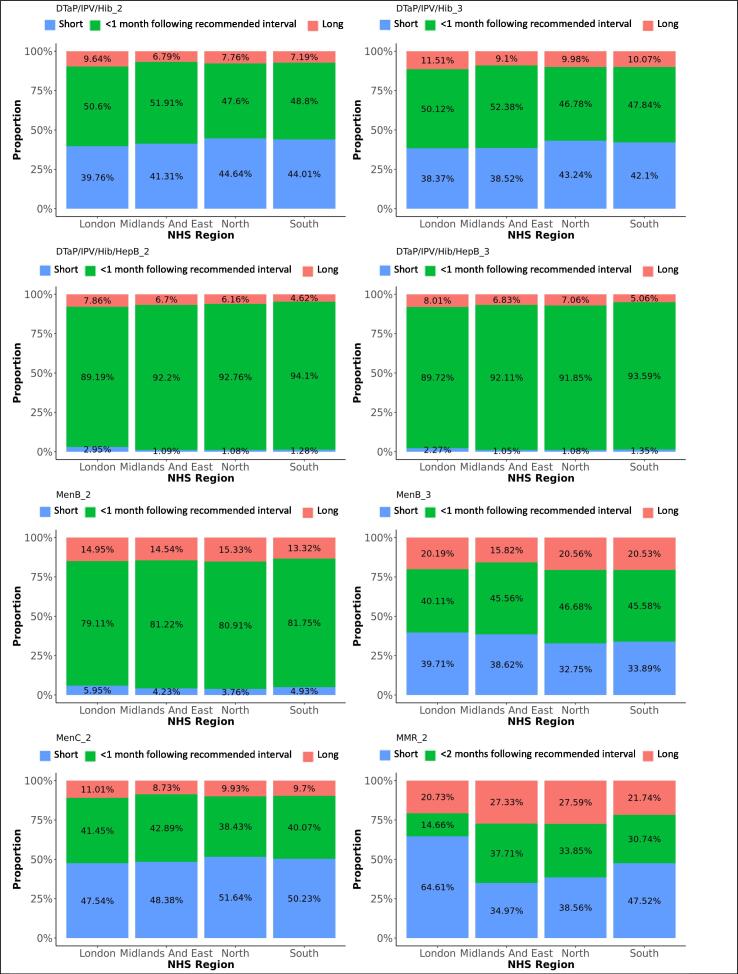
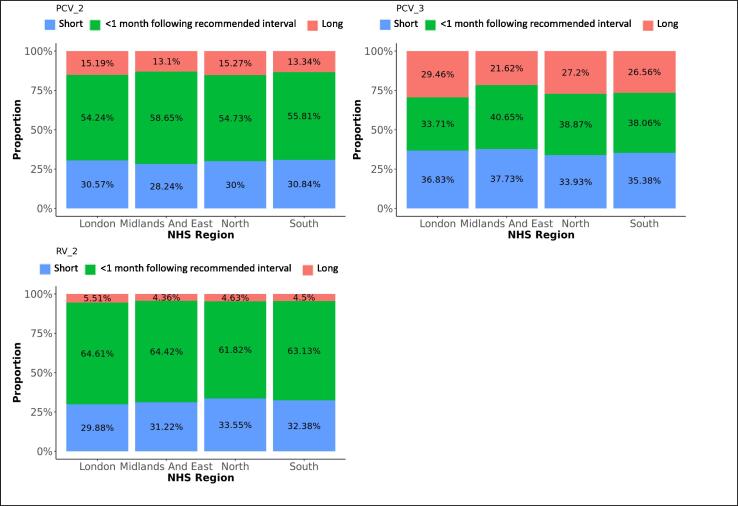
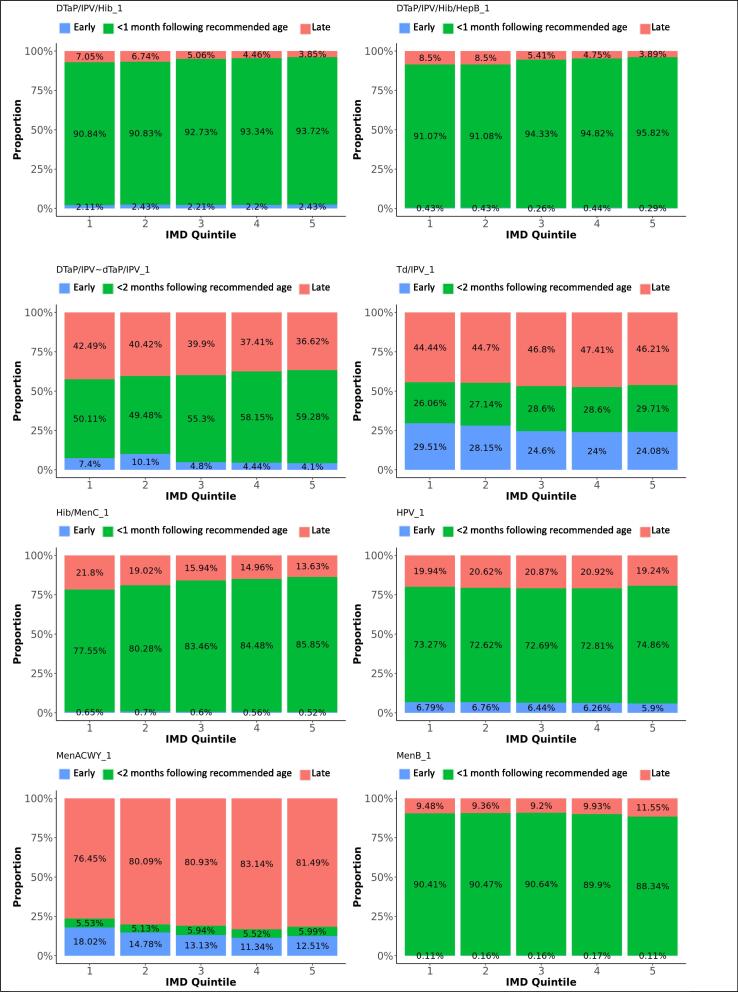
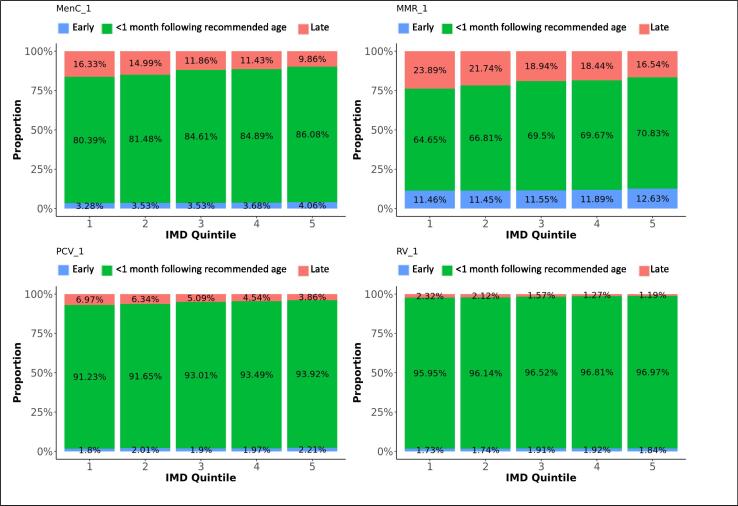
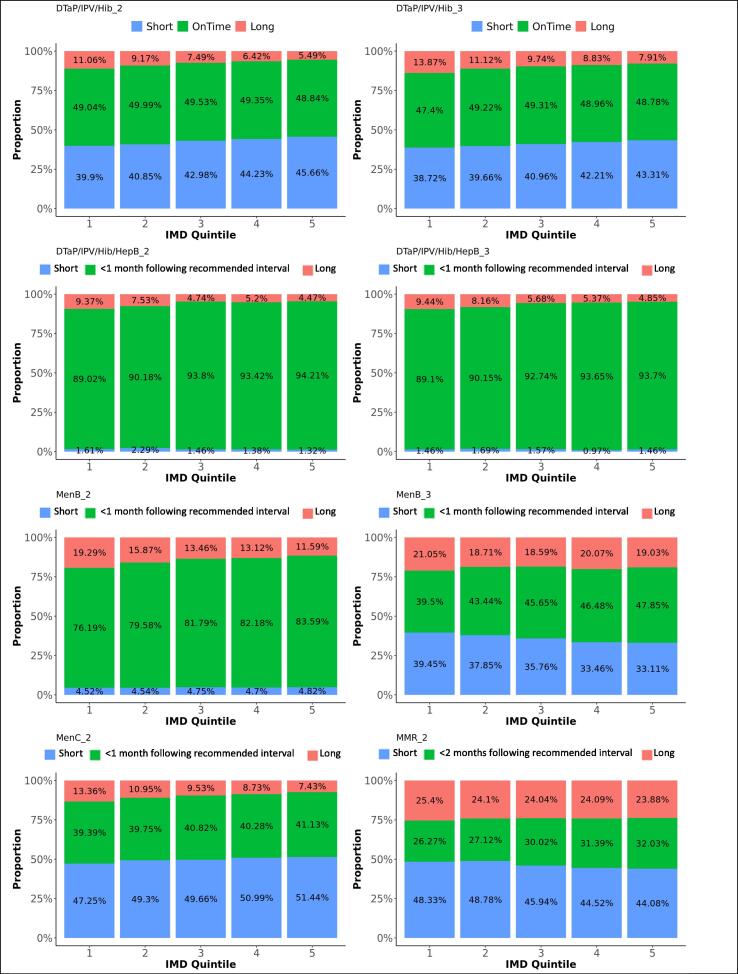
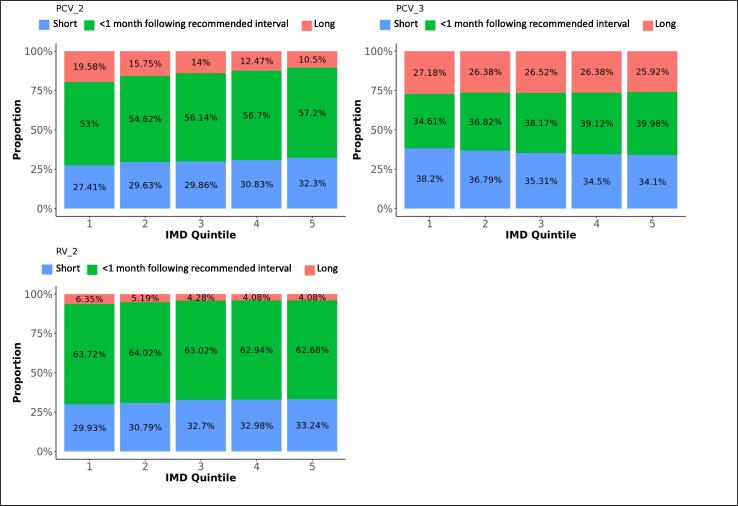
Overall, 75% of first doses were administered on the scheduled age or within one month thereafter , 19% more than one month too late and 6% before the scheduled age (too early). The medians for deviations from the schedule varied between 0 and 1 month (IQR 0 and 2 months), except for DTaP/IPV or dTaP/IPV (median 2 months; IQR 0 to 5), Td/IPV (median 1 month; IQR −1 to 13), and MenACWY (median 29 months; IQR 6 to 55). The time windows between first and second doses were respected in 51% of vaccinations. The medians for deviations from the scheduled time between doses varied between 0 and 1 month, with an IQR between −2 and 2 months. The period between the first and second dose was too short for 36% of vaccinations while 13% of second doses were administered too long after the first dose. Third doses were administered within the defined time windows after a second dose for 45%, too short for 37%, and too long for 18% of vaccinations. Receiving a preceding dose late significantly increased the odds on a too short gap until receiving the subsequent dose of the same vaccine (OR 1.8). Fig. 2, Fig. 3 illustrate the deviation from the immunisation schedule for each of the included vaccines, Fig. 4, Fig. 5, Fig. 6, Fig. 7, Fig. 8, Fig. 9 demonstrate the differences in adherence to the immunisation schedule for each of the included vaccines between gender, NHS regions, and IMD quintiles, while Table 3 presents the odds ratios of vaccinations within the defined time windows for these factors per vaccine.
Fig. 2.
Deviations from the scheduled vaccination age for first doses, in months (dotted line indicates median deviation; red frames indicate invalid vaccinations requiring reimmunisation). The graphs present the proportions of vaccines administered at, before, or after the recommended age. Deviations from the schedule are categorised by the number of months before (negative numbers) or after (positive numbers) the recommended age. (For interpretation of the references to colour in this figure legend, the reader is referred to the web version of this article.)
Fig. 3.
Deviations from the scheduled gap between doses, in months (dotted line indicates median deviation; red frames indicate invalid vaccinations requiring reimmunisation). The graphs present the proportions of vaccines administered at, before, or after the recommended age. Deviations from the schedule are categorised by the number of months before (negative numbers) or after (positive numbers) the recommended age. (For interpretation of the references to colour in this figure legend, the reader is referred to the web version of this article.)
Fig. 4.
Difference in adherence between genders, for first doses. The graphs present the proportions of each vaccine’s first dose administered early, within 1 month following the recommended age for vaccines scheduled in the first year of life, or within 2 months following the recommended age for vaccines scheduled later in life (see Table 1), or late, for each gender.
Fig. 5.
Difference in adherence between genders, for subsequent doses. The graphs present the proportions of each vaccine’s subsequent dose administered within 1 month following the recommended interval for vaccines scheduled in the first year of life, or within 2 months following the recommended interval for vaccines scheduled later in life (see Table 1), too short, or too long after the previous dose, for each gender.
Fig. 6.
Difference in adherence between NHS regions, for first doses. The graphs present the proportions of each vaccine’s first dose administered early, within 1 month following the recommended age for vaccines scheduled in the first year of life, or within 2 months following the recommended age for vaccines scheduled later in life (see Table 1), or late, for each NHS region.
Fig. 7.
Difference in adherence between NHS regions, for subsequent doses. The graphs present the proportions of each vaccine’s subsequent dose administered within 1 month following the recommended interval for vaccines scheduled in the first year of life, or within 2 months following the recommended interval for vaccines scheduled later in life (see Table 1), too short, or too long after the previous dose, for each NHS region.
Fig. 8.
Difference in adherence between IMD quintiles, for first doses. The graphs present the proportions of each vaccine’s first dose administered early, within 1 month following the recommended age for vaccines scheduled in the first year of life, or within 2 months following the recommended age for vaccines scheduled later in life (see Table 1), or late, for each IMD quintile.
Fig. 9.
Difference in adherence between IMD quintiles, for subsequent doses. The graphs present the proportions of each vaccine’s subsequent dose administered within 1 month following the recommended interval for vaccines scheduled in the first year of life, or within 2 months following the recommended interval for vaccines scheduled later in life (see Table 1), too short, or too long after the previous dose, for each IMD quintile.
Table 3.
Odds ratios of vaccination within the defined time windows* for gender, NHS region, and IMD quintile for each of the included vaccines (p < 0.05).
| Vaccine and dose | Gender (comparator Female) |
Region (comparator London) |
IMD (comparator Quintile 1) | |||||
|---|---|---|---|---|---|---|---|---|
| Male | Midland and East England | North England | South England | 2 | 3 | 4 | 5 | |
| DTaP/IPV/Hib/HepB 1 | – | 1.61 [1.42–1.84] | 1.92 [1.73–2.14] | 1.65 [1.47–1.85] | – | 1.58 [1.39–1.79] | 1.64 [1.44–1.88] | 2.01 [1.74–2.31] |
| DTaP/IPV/Hib/HepB 2 | – | 1.19 [1.05–1.34] | 1.46 [1.32–1.63] | 1.57 [1.40–1.76] | 1.18 [1.05–1.32] | 1.8 [1.58–2.05] | 1.64 [1.45–1.87] | 1.83 [1.60–2.09] |
| DTaP/IPV/Hib/HepB 3 | – | – | 1.24 [1.11–1.39] | 1.41 [1.24–1.59] | – | 1.51 [1.32–1.73] | 1.71 [1.48–1.97] | 1.69 [1.47–1.94] |
| DTaP/IPV/Hib 1 | 1.03 [1.004–1.05] | 1.37 [1.32–1.43] | 1.47 [1.43–1.52] | 1.25 [1.21–1.30] | 1.04 [1.01–1.08] | 1.29 [1.25–1.34] | 1.39 [1.34–1.45] | 1.47 [1.42–1.53] |
| DTaP/IPV/Hib 2 | – | 1.07 [1.04–1.09] | 0.89 [0.87–0.91] | 0.94 [0.92–0.96] | 1.02 [1.003–1.05] | – | – | 0.98 [0.96–0.9979] |
| DTaP/IPV/Hib 3 | – | 1.09 [1.07–1.12] | 0.88 [0.86–0.90] | 0.91 [0.89–0.92] | 1.06 [1.04–1.09] | 1.07 [1.04–1.09] | 1.05 [1.03–1.07] | 1.05 [1.02–1.07] |
| DTaP/IPV or dTaP/IPV | 1.12 [1.10–1.13] | 1.79 [1.75–1.83] | 1.7 [1.67–1.74] | 2.08 [2.03–2.12] | – | 1.12 [1.10–1.15] | 1.2 [1.17–1.23] | 1.21 [1.18–1.23] |
| Td/IPV | – | 1.23 [1.18–1.29] | 1.69 [1.63–1.75] | 1.61 [1.55–1.67] | 1.08 [1.04–1.12] | 1.11 [1.07–1.15] | 1.09 [1.05–1.13] | 1.13 [1.09–1.17] |
| MMR 1 | – | 1.26 [1.26–1.29] | 1.16 [1.14–1.18] | 1.12 [1.10–1.14] | 1.12 [1.09–1.14] | 1.23 [1.21–1.25] | 1.22 [1.20–1.25] | 1.29 [1.26–1.31] |
| MMR 2 | – | 3.46 [3.36–3.57] | 2.99 [2.91–3.08] | 2.52 [2.45–2.60] | 1.14 [1.11–1.18] | 1.14 [1.11–1.17] | 1.14 [1.11–1.17] | 1.15 [1.12–1.18] |
| PCV 1 | – | 1.31 [1.27–1.36] | 1.31 [1.27–1.35] | 1.21 [1.17–1.25] | 1.08 [1.05–1.12] | 1.26 [1.22–1.31] | 1.34 [1.29–1.38] | 1.43 [1.38–1.48] |
| PCV 2 | – | 1,15 [1.13–1.17] | – | – | 1.07 [1.05–1.09] | 1.12 [1.10–1.14] | 1.14 [1.12–1.16] | 1.16 [1.14–1.19] |
| PCV 3 | – | 1.29 [1.26–1.32] | 1.24 [1.21–1.26] | 1.14 [1.12–1.17] | 1.12 [1.10–1.15] | 1.16 [1.13–1.18] | 1.19 [1.16–1.22] | 1.23 [1.20–1.26] |
| MenB 1 | – | 1.14 [1.07–1.22] | 1.23 [1.17–1.30] | 1.08 [1.02–1.14] | – | – | – | 0.81 [0.76–0.86] |
| MenB 2 | 0.96 [0.94–0.99] | – | 1.09 [1.04–1.13] | – | 1.23 [1.17–1.29] | 1.41 [1.34–1.48] | 1.45 [1.38–1.52] | 1.6 [1.52–1.68] |
| MenB 3 | – | 1.16 [1.06–1.27] | 1.32 [1.22–1.42] | 1.18 [1.09–1.29] | 1.22 [1.11–1.34] | 1.32 [1.21–1.44] | 1.37 [1.25–1.49] | 1.43 [1.31–1.57] |
| MenC 1 | 1.03 [1.01–1.05] | 1.41 [1.37–1.45] | 1.33 [1.30–1.36] | 1.14 [1.11–1.17] | 1.11 [1.08–1.14] | 1.34 [1.30–1.38] | 1.34 [1.31–1.38] | 1.48 [1.44–1.52] |
| MenC 2 | – | 1.04 [1.01–1.06] | 0.87 [0.85–0.89] | 0.92 [0.90–0.94] | – | 1.05 [1.02–1.08] | 1.03 [1.003–1.06] | 1.07 [1.04–1.10] |
| MenACWY | 1.15 [1.10–1.20] | 2.36 [2.12–2.63] | 1.86 [1.68–2.06] | 2.34 [2.12–2.60] | 0.88 [0.82–0.96] | – | 0.84 [0.78–0.91] | 0.89 [0.83–0.96] |
| Hib/MenC 1 | – | 1.62 [1.57–1.66] | 1.57 [1.54–1.61] | 1.43 [1.40–1.46] | 1.23 [1.20–1.26] | 1.43 [1.39–1.47] | 1.49 [1.46–1.53] | 1.64 [1.59–1.68] |
| Rotavirus 1 | – | 1.46 [1.35–1.59] | 1.29 [1.21–1.38] | 1.35 [1.26–1.44] | – | 1.12 [1.04–1.21] | 1.19 [1.10–1.28] | 1.23 [1.14–1.33] |
| Rotavirus 2 | – | – | 0.89 [0.87–0.92] | 0.96 [0.93–0.98] | – | 0.96 [0.93–0.99] | 0.95 [0.92–0.98] | 0.94 [0.92–0.97] |
| HPV 1 | 0.2 [0.16–0.24] | 1.08 [1.03–1.12] | 1.23 [1.19–1.28] | 1.27 [1.23–1.32] | – | 0.96 [0.93–0.99] | 0.96 [0.93–0.99] | 1.06 [1.02–1.09] |
| HPV 2 | 0.32 [0.25–0.41] | 1.07 [1.03–1.12] | 1.28 [1.23–1.33] | 1.38 [1.32–1.43] | – | – | – | 1.11 [1.07–1.16] |
* Within 1 month following the recommended age or interval for vaccines scheduled in the first year of life, or within 2 months following the recommended age or interval for vaccines scheduled later in life (see Table 1).
3.1. DTaP vaccines
DTaP/IPV/Hib/HepB replaced DTaP/IPV/Hib on the immunisation schedule in spring 2018. Ninety-two percent of the first DTaP/IPV/Hib doses and 93% of the first DTaP/IPV/Hib/HepB doses were administered within 1 month following the recommended age. Forty-nine percent of subsequent DTaP/IPV/Hib doses were administered within 1 month following the recommended interval, while 42% were administered within a shorter period. Subsequent DTaP/IPV/Hib/HepB doses were given within 1 month following the recommended interval in 92%. Timeliness of administration for DTaP/IPV/Hib and DTaP/IPV/Hib/HepB vaccines significantly increased with decreasing deprivation (Fig. 8, Fig. 9). Timeliness of administration was most likely in North England for both vaccines’ first doses and the least likely in London for the first dose of DTaP/IPV/Hib and all doses of DTaP/IPV/Hib/HepB. Subsequent doses in London were more often given later than in the other regions. Subsequent doses of DTaP/IPV/Hib/HepB were given clearly more timely in the South of England and subsequent doses of DTaP/IPV/Hib more timely in the Midlands and East-England (Fig. 6, Fig. 7). The timeliness of the first dose of DTaP/IPV/Hib was similar for boys and girls.
Fifty-five percent of DTaP/IPV and dTaP/IPV vaccines (scheduled at 40 months) were given within 2 months following the recommended age and 39% too late. A small peak of early administrations was seen around three months of age. Td/IPV vaccines, scheduled at the age of 14 since 2013, were given within 2 months following the recommended age in 28%, while 46% of vaccines were administered too late. Timeliness increased with decreasing deprivation (Fig. 8). Schedule adherence was clearly less likely in London and most likely in South England for DTaP/IPV and dTaP/IPV vaccines (OR: 2.1) and in North England for Td/IPV (OR: 1.7). Boys were slightly more likely to receive DTaP/IPV and dTaP/IPV vaccines within 2 months following the recommended age (OR: 1.1).
3.2. Meningitis vaccines
Ninety percent of the first MenB vaccines were administered within 1 month following the recommended age and 10% too late, with a small peak almost one year later, around the scheduled age for the third dose at the age of one. Eighty-one percent of the second MenB vaccine doses and 45% of the third doses were administered within 1 month following the recommended interval. Five percent of the second doses were given too soon and 15% too long after the first dose, while 35% of third doses were given too soon and 20% too long after the second dose. MenB vaccine was less likely to be administered timely in London and more likely in North England (Table 3). The least deprived areas accounted for the lowest timeliness and also more late administrations for the first dose of MenB vaccine, while timeliness for the subsequent doses improved with decreasing deprivation (Fig. 8, Fig. 9). The timeliness of the second dose of MenB vaccine was similar for girls and boys.
Eighty-four percent of MenC vaccines dose 1 were administered within 1 month following the recommended age, and 13% too late. The second dose of MenC vaccine was given within 1 month following the recommended interval for 40% of vaccinations, too soon after the first dose for 50% - all within one month of the recommended gap - and too long for 10% of vaccinations. Timeliness for both doses of MenC vaccine improved with decreasing deprivation (Fig. 8, Fig. 9). We found the highest likeness for timeliness in the Midlands and East England for both doses (Table 3) versus the lowest in London for the first dose and in North England for the second dose. The timeliness of the first MenC dose was similar for both genders.
Thirteen percent of children received the MenACWY vaccine before the scheduled age of 14, while 81% percent received the vaccine more than 2 months after their 14th birthday. The mean delay was 29 months, with an IQR between 6 and 55 months. Boys were slightly more likely to receive the vaccine within 2 months following the recommended age than girls (OR: 1.2). The vaccine was given the least timely and most early in London, and clearly more timely in South-, Midlands and East-England (OR: 2.3 and 2.4).
Hib/MenC was administered within 1 month following the recommended age for 83% of vaccinations and too late for 17%. Adherence was least likely in London and most likely in the Midlands and East-England (OR: 1.6). The reported timeliness increased clearly with decreasing area deprivation (Fig. 8).
3.3. MMR vaccines
Sixty-nine percent of MMR vaccine first doses were administered within 1 month following the recommended age, 20% too late and 11% too early. Although most doses were distributed around the scheduled age, we found a small peak of first doses around the age where the second dose was scheduled. Thirty percent of the second MMR vaccine doses were given within 2 months following the recommended interval after the first dose, 46% were given too short and 24% too long after the first dose. We observed a small trend of second doses given within a few months after the first dose instead of 28 months later. Timeliness was the worst in London, particularly for the second dose of MMR vaccine. More first doses were given late and the second doses too shortly after the first one in London. Adherence to the immunisation schedule was most likely in the Midlands and East-England (OR: 1.3 for the first and 3.5 for the second dose). Timeliness clearly increased with decreasing area deprivation.
3.4. PCV vaccines
Ninety-three percent of the first PCV vaccine doses were given within 1 month following the recommended age and five percent too late. Timeliness decreased with subsequent doses that were given within 1 month following the recommended interval on average for 48% of vaccinations, too short after the preceding dose for 33% and too long for 20% of subsequent doses. Timeliness improved for all doses with decreasing area deprivation. PCV vaccines were most likely given timely in the Midlands and East-England and the least in London (Table 3).
3.5. RV vaccines
The proportions of RV vaccinations given within 1 month following the recommended time dropped from 97% for the first dose to 63% for the second dose. Thirty-two percent of second doses were given too long after the first dose. Timeliness of the first dose slightly improved with decreasing deprivation. Adherence was most likely in the Midlands and East-England (OR: 1.5) and the least in London.
3.6. HPV vaccines
The first and second doses of HPV vaccine were given within 2 months following the recommended age for 73% and 74% of the respective vaccinations. Twenty percent of both doses were given too late and 6% too early. Boys were significantly less likely to receive the HPV vaccine timely (Table 3). Forty-nine percent received dose 1 later than the recommended age and 40% received dose 2 later. Adherence was least likely in London and most likely in South England (Table 3). For both doses, we observed a small distribution of late vaccinations around 18 years of age.
4. Discussion
The timeliness of immunisation was better for routine paediatric vaccines scheduled in the first year of life and decreased for vaccines scheduled at older ages. Overall, three quarters of first doses were administered within 1 month (for vaccines scheduled in the first year of life) or 2 months (for vaccines scheduled later in life) following the recommended age while too early administrations of first doses were rare. Almost half of subsequent doses were not given timely after the preceding dose, particularly too shortly after the preceding dose. This can be partly explained by having received a prior dose later than scheduled but the subsequent dose at the scheduled age. Our findings confirm previous studies with smaller study populations that also reported high timeliness, up to 95%, of first vaccine doses scheduled in the first year of life, with a decreasing trend for subsequent doses and vaccines given after the age of 1, and proportions between 22% and 87% of children with at least one delayed vaccination compared to 80% in our study [5], [23], [24], [25], [26], [27], [28], [29], [31], [32], [33], [34].
Immunisation schedule adherence was similar for girls and boys, and differences between the four main English regions were small. Other studies found that the organisation of health care and health systems affect vaccination timeliness [35], [36]. Having one health care system in place all over England might explain the absence of large differences between regions. Nevertheless, immunisation schedule adherence was significantly less likely in London for almost all vaccines, while it was generally the highest in the Midlands and East England. Tiley et al. [31] found heterogeneity in paediatric vaccination timeless across ethnicities in London, which might negatively affect the overall adherence rate.
Immunisation schedule adherence improved slightly but significantly with decreasing deprivation for almost all vaccines. This corresponds with other studies reporting a negative association between deprivation and vaccination timeliness or finding that children in families living below the poverty level are less likely to follow recommended immunisation schedules and have up-to-date vaccinations [4], [28], [31], [37]. Since routine paediatric vaccines are provided for free in England, this is not an issue of lacking financial means to pay for vaccinations, but might be related to other factors that are associated with poor health care service utilisation often seen with lower income families [38].
The timeliness of subsequent DTaP/IPV/Hib/HepB doses clearly improved compared to the timeliness of subsequent DTaP/IPV/Hib doses. Subsequent doses of DTaP/IPV/Hib were often administered too early (42%), similarly to subsequent doses of other vaccines. Too early administrations of subsequent DTaP/IPV/Hib/HepB doses accounted for 2% while doses given within 1 month following the recommended interval represented 92%. This may be due to the recent introduction of DTaP/IPV/Hib/HepB in the immunisation schedule [17]. Other studies documented improved timeliness following the introduction of new vaccines to the immunisation schedule [39], [40] which may be explained by accompanying campaigns to assure that health care providers are well aware of recently published guidelines.
Although the MenACWY vaccine was scheduled at the age of 14, we observed that the vaccine was given between 14 and 16 years of age, or around the age of 18 years. This may be due to the recent introduction of the vaccine in 2016. Children who already passed their 14th birthday when the MenACWY vaccine was introduced, were still eligible to receive the vaccine, up to an age of 25 years. [41] This would explain why many children older than 14 received the vaccine. Since our study covers only the three first years of MenACWY being listed in the immunisation schedule, the proportion of children that received these catch up vaccinations would be relatively large but can be expected to decrease in future years.
The large sample size and the use of real practice data are strengths of our study. However, data is not collected for this specific study and entered by different persons and institutions, which may negatively impact the quality of the data. As a result, our data may be prone to misclassification and missingness due to wrong or incomplete information entered in medical records. When relying on existing medical records, analyses are restricted to the available variables captured in the database. [42] Therefore, we could not examine other potential factors than those discussed above. Only birth months and years are available in the database to guarantee anonymity. The absence of exact birth dates created some imprecision in calculating the exact age at immunisation for first doses. Therefore, we used rather wide acceptability windows for timeliness. This less stringent criterion for adherence contributes to higher adherence rates. For vaccines scheduled at 2 months or 8 weeks (the first doses of DTaP/IPV/Hib/HepB, DTaP/IPV/Hib, PCV, MenB, RV), we cannot exclude that immunisations that happened within 2 weeks before the minimum age of 6 weeks were classified as timely due to the lack of exact birth dates. For the other vaccines and doses included in our study, the acceptability windows don’t exceed the minimum ages listed in immunisation guidelines. [19], [20], [43] Since the RCGP RCS database only collects data from GP practices, we could not track vaccinations at other healthcare facilities. However, routine childhood vaccines are typically given by GPs. [44] Children may have left the database during the study period. As a result, vaccinations these children may have received after leaving the database are not included in our analyses. Our analyses are also subject to right censoring: particularly for children born closer to the end of the study period, too late vaccinations that occurred after the study period could not be considered. Similarly left censoring occurred for children born close to the beginning of the study period, whose too early vaccinations may be missed.
Our study did not reveal major factors for poor vaccine schedule adherence. Both coverage and the timeliness of vaccinations are influenced by diverse factors interacting in complex ways. [32] Access to vaccinations and information about vaccinations raise vaccination coverage and timeliness [45] and also introducing new vaccines may improve vaccine coverage and timeliness [39], [40]. Vaccine hesitancy can lead to refusing and delaying vaccinations. [46] This hesitancy can be constituted by contextual influences including historic, socio-cultural, environmental, health system/institutional, economic, or political factors; individual perceptions and group influences; or concerns directly related to vaccines as discussed by MacDonald. [46]
The overall timeliness of vaccinations is suboptimal, particularly for subsequent doses and vaccines scheduled after the first year of life. While first doses are scheduled to protect children as early in life as possible, or at least before potential exposure to pathogens happens, the time between doses is determined to assure that an adequate and long lasting immunity is induced. [47] Subsequent doses given at shorter than recommended intervals may induce a reduced immune response and less durable protection, and reimmunisation is required when the interval is below the minimum interval (4 weeks for inactivated and life attenuated vaccines, 8 weeks for MenB and PCV). [48], [49] Although delayed doses still achieve the desired immunity [48], [49], longer intervals between subsequent doses leave children suboptimally protected. Hence, any deviation from scheduled ages or intervals between vaccinations potentially undermines both personal and herd immunity. Therefore, interventions to improve vaccination coverage should also address the timeliness of vaccinations. Such efforts should involve educational, clinical, and policy interventions targeted at improving the infrastructure used for vaccine delivery, training health care professionals, and educating parents to raise awareness about the importance of timely vaccinations. [3], [25], [50], [51], [52] Also strengthening the relationship between the health care providers and particularly parents with several children and families with a lower educational level or lower socioeconomic status is an approach that should be considered. [26], [53], [54], [55]
High vaccination coverage might mask that children are sub-optimally immunised and protected during some time in their childhood due to untimely vaccinations. Therefore, immunisation campaigns should aim to improve the timeliness of paediatric vaccinations, in addition to improving overall coverage, for an optimal protection against vaccine preventable diseases. We also propose developing a coefficient to adjust coverage rates accounting for poor vaccine schedule adherence or untimely vaccinations. Coverage rates are typically measured at 1 year, 2 years, and 5 years of age [56], which is between eight and 20 months after the scheduled ages for the last doses of routine paediatric vaccines. This means that discordances between real vaccinations and the immunisation schedule, and potentially long periods with lower coverage and a lack of protection, are inadequately monitored. A monitoring tool that considers the timelines of vaccinations - for instance through a build-in algorithm in the electronic health record - could also assist clinicians in following up not only the completeness of vaccine series, but also the timeliness of doses, thereby indicating potentially invalid doses that may not induce an optimal protection. Therefore, we suggest defining a measure estimating the time that the paediatric population is protected by considering effective ages of vaccination and coverage. This resulting compound measure combining coverage and adherence might provide a better indication for the protection against vaccine preventable diseases in a community.
Declaration of Competing Interest
The authors declare that they have no known competing financial interests or personal relationships that could have appeared to influence the work reported in this paper.
References
- 1.The NHS Information Centre, Workforce and Facilities. NHS Immunisation Statistics England 2008-09. The Health and Social Care Information Centre, Workforce and Facilities; 2009.
- 2.Screening and Immunisations team, Health and Social Care Information Centre. NHS Immunisation Statistics England 2012-13. Health and Social Care Information Centre; 2013.
- 3.Hadjipanayis A. Compliance with vaccination schedules. Human Vaccines & Immunotherapeutics. 2019;15(4):1003–1004. doi: 10.1080/21645515.2018.1556078. [DOI] [PMC free article] [PubMed] [Google Scholar]
- 4.Hargreaves A.L., Nowak G., Frew P.M., Hinman A.R., Orenstein W.A., Mendel J., et al. Adherence to Timely Vaccinations in the United States. Pediatrics. 2020;145(3):e20190783. doi: 10.1542/peds.2019-0783. [DOI] [PubMed] [Google Scholar]
- 5.Bailly A.-C., Gras P., Lienhardt J.-F., Requillart J.-C., Vié-le-Sage F., Martinot A., et al. Timeliness of vaccination in infants followed by primary-care pediatricians in France. Hum Vaccin Immunother. 2018;14(4):1018–1023. doi: 10.1080/21645515.2017.1409318. [DOI] [PMC free article] [PubMed] [Google Scholar]
- 6.NHS. The routine immunisation schedule from Autumn 2018. 2018.
- 7.University of Surrey. Clinical Informatics and Health Outcomes Research Group. ClinInfEu 2020. https://clininf.eu/ (accessed April 28, 2020).
- 8.Correa A., Hinton W., McGovern A., van Vlymen J., Yonova I., Jones S., et al. Royal College of General Practitioners Research and Surveillance Centre (RCGP RSC) sentinel network: a cohort profile. BMJ Open. 2016;6(4):e011092. doi: 10.1136/bmjopen-2016-011092. [DOI] [PMC free article] [PubMed] [Google Scholar]
- 9.Deprtment for Communities and Local Government. 2015 [Google Scholar]
- 10.NHS. Routine childhood immunisation programme 2008.
- 11.Bevan-Jones L, Stones Y. No Nonsense Vaccine Handbook. 2009.
- 12.Thomson J. Paediatric Pearls 2011.
- 13.NHS. Routine childhood immunisations from September 2012. 2012.
- 14.NHS. Routine childhood immunisations from June 2013. 2013.
- 15.NHS. Routine childhood immunisations from July 2014. 2014.
- 16.NHS. The routine immunisation schedule from summer 2016. 2016.
- 17.NHS. The routine immunisation schedule from April 2018. 2018.
- 18.Gras P., Bailly A.-C., Lagrée M., Dervaux B., Martinot A., Dubos F. What timing of vaccination is potentially dangerous for children younger than 2 years? Hum Vaccin Immunother. 2016;12(8):2046–2052. doi: 10.1080/21645515.2016.1157239. [DOI] [PMC free article] [PubMed] [Google Scholar]
- 19.Advisory Committee on Immunization Practices (ACIP). Timing and Spacing of Immunobiologics: General Best Practice Guidelines for Immunization 2020. https://www.cdc.gov/vaccines/hcp/acip-recs/general-recs/timing.html (accessed January 19, 2021).
- 20.Immunization Action Coalition. Administering Vaccines. Ask the Experts: Administering Vaccines 2020. https://www.immunize.org/askexperts/administering-vaccines.asp (accessed January 11, 2021).
- 21.The Children’s Hospital of Philadelphia. Technically Speaking: Minimum Ages and Intervals Between Doses of Vaccines in a Series 2014. https://www.chop.edu/news/technically-speaking-minimum-ages-and-intervals-between-doses-vaccines-series (accessed January 19, 2021).
- 22.Smith P.J., Humiston S.G., Parnell T., Vannice K.S., Salmon D.A. The Association Between Intentional Delay of Vaccine Administration and Timely Childhood Vaccination Coverage. Public Health Rep. 2010;125(4):534–541. doi: 10.1177/003335491012500408. [DOI] [PMC free article] [PubMed] [Google Scholar]
- 23.Walton S., Cortina-Borja M., Dezateux C., Griffiths L.J., Tingay K., Akbari A., et al. Measuring the timeliness of childhood vaccinations: Using cohort data and routine health records to evaluate quality of immunisation services. Vaccine. 2017;35(51):7166–7173. doi: 10.1016/j.vaccine.2017.10.085. [DOI] [PMC free article] [PubMed] [Google Scholar]
- 24.Hull B.P., McIntyre P.B. Timeliness of childhood immunisation in Australia. Vaccine. 2006;24(20):4403–4408. doi: 10.1016/j.vaccine.2006.02.049. [DOI] [PubMed] [Google Scholar]
- 25.Kurosky S.K., Davis K.L., Krishnarajah G. Completion and compliance of childhood vaccinations in the United States. Vaccine. 2016;34(3):387–394. doi: 10.1016/j.vaccine.2015.11.011. [DOI] [PubMed] [Google Scholar]
- 26.Loy S.L., Cheung Y.B., Chan J.K.Y., Soh S.E., Godfrey K.M., Tan K.H., et al. Timeliness of Childhood Vaccination Coverage: the Growing Up in Singapore Towards Healthy Outcomes Study. Prev Sci. 2020;21(3):283–292. doi: 10.1007/s11121-019-01078-2. [DOI] [PubMed] [Google Scholar]
- 27.Moore H.C., Fathima P., Gidding H.F., de Klerk N., Liu B., Sheppeard V., et al. Assessment of on-time vaccination coverage in population subgroups: A record linkage cohort study. Vaccine. 2018;36(28):4062–4069. doi: 10.1016/j.vaccine.2018.05.084. [DOI] [PubMed] [Google Scholar]
- 28.Perry M., McGowan A., Roberts R., Cottrell S. Timeliness and equity of infant pertussis vaccination in wales: Analysis of the three dose primary course. Vaccine. 2020;38(6):1402–1407. doi: 10.1016/j.vaccine.2019.12.001. [DOI] [PubMed] [Google Scholar]
- 29.Wagner A.L., Eccleston A.M., Potter R.C., Swanson R.G., Boulton M.L. Vaccination Timeliness at Age 24 Months in Michigan Children Born 2006–2010. Am J Prev Med. 2018;54(1):96–102. doi: 10.1016/j.amepre.2017.09.014. [DOI] [PubMed] [Google Scholar]
- 30.R Core Team. R: A language and environment for statistical computing. Vienna, Austria: R Foundation for Statistical Computing; 2017.
- 31.Tiley K.S., White J.M., Andrews N., Ramsay M., Edelstein M. Inequalities in childhood vaccination timing and completion in London. Vaccine. 2018;36(45):6726–6735. doi: 10.1016/j.vaccine.2018.09.032. [DOI] [PubMed] [Google Scholar]
- 32.Schneider R., Reinau D., Schur N., Blozik E., Früh M., Signorell A., et al. Coverage rates and timeliness of nationally recommended vaccinations in Swiss preschool children: A descriptive analysis using claims data. Vaccine. 2020;38(6):1551–1558. doi: 10.1016/j.vaccine.2019.11.057. [DOI] [PubMed] [Google Scholar]
- 33.Rybak A., Vié le Sage F., Béchet S., Werner A., Thiebault G., Bakhache P., et al. Timeliness of routine immunization in non-preterm children less than 2 years old using electronic data capture in an ambulatory setting in France in the context of vaccine hesitancy. Archives de Pédiatrie. 2019;26(2):56–64. doi: 10.1016/j.arcped.2018.11.011. [DOI] [PubMed] [Google Scholar]
- 34.Scheepers E.D., van Lier A., Drijfhout I.H., Berbers G., van der Maas N.A.T., de Melker H.E., et al. Dutch national immunization schedule: compliance and associated characteristics for the primary series. Eur J Pediatr. 2017;176(6):769–778. doi: 10.1007/s00431-017-2904-1. [DOI] [PubMed] [Google Scholar]
- 35.Bailie R.S., Si D., Dowden M.C., Selvey C.E., Kennedy C., Cox R., et al. A systems approach to improving timeliness of immunisation. Vaccine. 2009;27(27):3669–3674. doi: 10.1016/j.vaccine.2009.02.068. [DOI] [PubMed] [Google Scholar]
- 36.Akmatov M.K., Kretzschmar M., Krämer A., Mikolajczyk R.T. Timeliness of vaccination and its effects on fraction of vaccinated population. Vaccine. 2008;26(31):3805–3811. doi: 10.1016/j.vaccine.2008.05.031. [DOI] [PubMed] [Google Scholar]
- 37.Ueda M., Kondo N., Takada M., Hashimoto H. Maternal work conditions, socioeconomic and educational status, and vaccination of children: A community-based household survey in Japan. Prev Med. 2014;66:17–21. doi: 10.1016/j.ypmed.2014.05.018. [DOI] [PubMed] [Google Scholar]
- 38.Devaux M. Income-related inequalities and inequities in health care services utilisation in 18 selected OECD countries. Eur J Health Econ. 2015;16(1):21–33. doi: 10.1007/s10198-013-0546-4. [DOI] [PubMed] [Google Scholar]
- 39.Hull B.P., Menzies R., Macartney K., McIntyre P.B. Impact of the introduction of rotavirus vaccine on the timeliness of other scheduled vaccines: the Australian experience. Vaccine. 2013;31(15):1964–1969. doi: 10.1016/j.vaccine.2013.02.007. [DOI] [PubMed] [Google Scholar]
- 40.Fisker A.B., Hornshøj L., Rodrigues A., Balde I., Fernandes M., Benn C.S., et al. Effects of the introduction of new vaccines in Guinea-Bissau on vaccine coverage, vaccine timeliness, and child survival: an observational study. Lancet Glob Health. 2014;2(8):e478–e487. doi: 10.1016/S2214-109X(14)70274-8. [DOI] [PubMed] [Google Scholar]
- 41.NHS. MenACWY vaccine overview. NHS UK 2019. https://www.nhs.uk/conditions/vaccinations/men-acwy-vaccine/ (accessed February 10, 2021).
- 42.Thygesen L.C., Ersbøll A.K. When the entire population is the sample: strengths and limitations in register-based epidemiology. Eur J Epidemiol. 2014;29(8):551–558. doi: 10.1007/s10654-013-9873-0. [DOI] [PubMed] [Google Scholar]
- 43.Australian Government Department of Health. Minimum acceptable dose intervals for children. The Australian Immunisation Handbook 2018. https://immunisationhandbook.health.gov.au/resources/handbook-tables/table-minimum-acceptable-dose-intervals-for-children (accessed January 19, 2021).
- 44.NHS vaccinations and when to have them. NhsUk 2019. https://www.nhs.uk/conditions/vaccinations/nhs-vaccinations-and-when-to-have-them/ (accessed May 26, 2020).
- 45.Masserey S.V. Faktoren, welche Unterschiede in der Durchimpfung zwischen Kantonen in der Schweiz erklären: Ergebnisse der FEVAC-Studie (2014–2015) Bull BAG. 2018;9:12–21. [Google Scholar]
- 46.MacDonald N.E. Vaccine hesitancy: Definition, scope and determinants. Vaccine. 2015;33(34):4161–4164. doi: 10.1016/j.vaccine.2015.04.036. [DOI] [PubMed] [Google Scholar]
- 47.Berry N, Leask J, Danchin M, Snelling T, Macartney K, Georgousakis. Why is the schedule the way it is? 2018.
- 48.Chapter P.H.E. 11: UK Immunisation schedule. Greenbook, Public Health England. 2013 [Google Scholar]
- 49.Public Health England. Vaccine Incident Guidance: Responding to errors in vaccine storage, handling and administration 2019.
- 50.Abahussin A.A., Albarrak A.I. Vaccination adherence: Review and proposed model. Journal of Infection and Public Health. 2016;9(6):781–789. doi: 10.1016/j.jiph.2016.09.006. [DOI] [PubMed] [Google Scholar]
- 51.Crocker-Buque T., Mounier-Jack S. Vaccination in England: a review of why business as usual is not enough to maintain coverage. BMC Public Health. 2018;18(1) doi: 10.1186/s12889-018-6228-5. [DOI] [PMC free article] [PubMed] [Google Scholar]
- 52.Nowlan M., Willing E., Turner N. Influences and policies that affect immunisation coverage-a summary review of literature. N Z Med J. 2019;132:79–88. [PubMed] [Google Scholar]
- 53.Tauil M.d.C., Sato A.P.S., Waldman E.A. Factors associated with incomplete or delayed vaccination across countries: A systematic review. Vaccine. 2016;34(24):2635–2643. doi: 10.1016/j.vaccine.2016.04.016. [DOI] [PubMed] [Google Scholar]
- 54.Homel J., Edwards B. Factors associated with delayed infant immunization in a nationally representative cohort study. Child Care Health Dev. 2018;44(4):583–591. doi: 10.1111/cch.v44.410.1111/cch.12560. [DOI] [PubMed] [Google Scholar]
- 55.Hazan G., Dagan R., Friger M. Maternal Education Is Inversely Related to Vaccination Delay among Infants and Toddlers. The Journal of Pediatrics. 2019;205:120–125.e2. doi: 10.1016/j.jpeds.2018.09.030. [DOI] [PubMed] [Google Scholar]
- 56.Screening & Immunisations Team (NHS Digital), COVER Team (Public Health England). Childhood Vaccination Coverage Statistics England, 2018-19. NHS Digital; 2019.


