Abstract
Cholecystokinin A receptor (CCKAR) belongs to family A G-protein-coupled receptors and regulates nutrient homeostasis upon stimulation by cholecystokinin (CCK). It is an attractive drug target for gastrointestinal and metabolic diseases. One distinguishing feature of CCKAR is its ability to interact with a sulfated ligand and to couple with divergent G-protein subtypes, including Gs, Gi and Gq. However, the basis for G-protein coupling promiscuity and ligand recognition by CCKAR remains unknown. Here, we present three cryo-electron microscopy structures of sulfated CCK-8-activated CCKAR in complex with Gs, Gi and Gq heterotrimers, respectively. CCKAR presents a similar conformation in the three structures, whereas conformational differences in the ‘wavy hook’ of the Gα subunits and ICL3 of the receptor serve as determinants in G-protein coupling selectivity. Our findings provide a framework for understanding G-protein coupling promiscuity by CCKAR and uncover the mechanism of receptor recognition by sulfated CCK-8.
Subject terms: Structural biology, G protein-coupled receptors, Pharmacology, Cell signalling
Cryo-EM structures of sulfated cholecystokinin 8 bound to the cholecystokinin A receptor in complex with Gs, Gi and Gq heterotrimers reveal structural determinants for G-protein coupling selectivity.
Main
Cholecystokinin (CCK), one of the earliest discovered gastrointestinal hormones, participates in gallbladder contraction and pancreatic enzyme secretion. It also acts as a neurotransmitter and is extensively distributed throughout the nervous system1. Selective cleavage of the CCK precursor produces a series of bioactive isoforms of different lengths, with CCK-58, CCK-33, CCK-22 and CCK-8 comprising the major peptide fragments in humans. However, the carboxy-terminal octapeptide CCK-8 (DYMGWMDF) is well conserved across species and is the smallest form that retains the full range of biological actions2, mediated by two CCK receptor subtypes (CCKAR and CCKBR), which are present throughout the central nervous system and the gut. CCKAR is primarily expressed in the alimentary tract, while CCKBR is mainly found in the brain and the stomach3. CCKAR has an ~500-fold higher affinity to CCK with a sulfated tyrosine, whereas CCKBR discriminates poorly between sulfated and non-sulfated CCK4.
CCK regulates appetite and food intake primarily through CCKAR on the vagal afferent neurons5–8, making CCKAR an attractive therapeutic target for obesity. However, the development of drugs against CCKAR is challenging, partly due to limited efficacy and safety concerns. Although several drug candidates are undergoing clinical trials, none has been approved so far9,10. Extensive efforts have been made to elucidate the mechanism of agonism at CCKAR through mutagenesis studies based on modeled receptor structures11–15, but the lack of precise structural information largely impedes our understanding of the molecular details of ligand recognition and receptor activation, and thus the drug discovery targeting CCKAR.
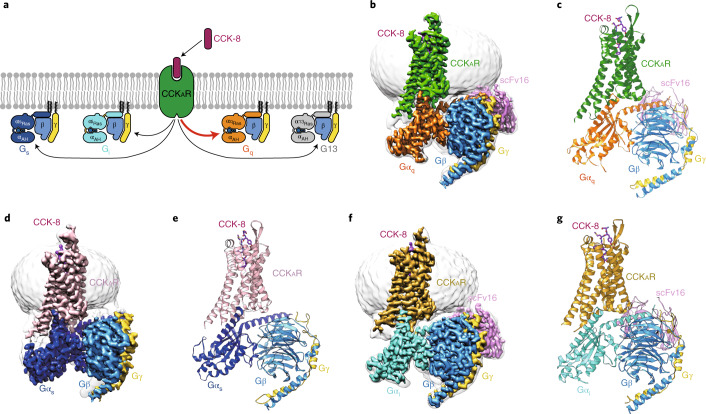
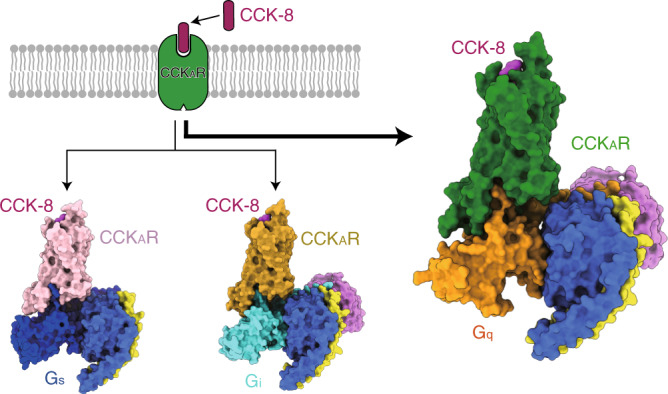
Most G-protein-coupled receptors (GPCRs) are known to couple with a specific subtype of G protein to elicit intracellular signal transduction16–21. There are four G-protein subtypes—stimulatory G protein (Gs), inhibitory G proteins (Gi), Gq and G12/13—participating in signaling pathways involving cyclic adenosine monophosphate (Gs and Gi), calcium (Gq) and small G protein (G12/13). A number of GPCR–G protein complex structures reported recently reveal that the primary determinants of G-protein coupling selectivity reside in the C-terminal α5-helix of the Gα subunit and relative outward movement of transmembrane helix 6 (TM6)22,23. However, CCKAR is different from most GPCRs as a result of its ability to couple with several G-protein subtypes. Activation of CCKAR elicits a diversified G-protein coupling pattern24, predominantly Gq (ref. 25), but Gs (ref. 26), Gi (refs. 25,27) and G13 (refs. 28,29) all play roles in CCKAR signaling. This unique feature makes CCKAR an ideal model to study G-protein selectivity and promiscuity (Fig. 1a). Here, we report three cryo-EM structures of sulfated CCK-8-activated CCKAR in complex with heterotrimeric Gq, Gs or Gi protein, respectively. These structures reveal the unique binding mode in ligand recognition and the structural determinants responsible for the G-protein selectivity and promiscuity of CCKAR.
Fig. 1. Cryo-EM structures of CCKAR–G protein complexes.
a, Schematic of G-protein coupling promiscuity of CCKAR. b–g, Three-dimensional maps and models of the CCK-8–CCKAR–Gq–scFv16 (b,c), CCK-8–CCKAR–Gs (d,e) and CCK-8–CCKAR–Gi–scFv16 (f,g) complexes. CCK-8, magenta; Gq-coupled CCKAR, green (b,c); Gs-coupled CCKAR, pink (d,e); Gi-coupled CCKAR, dark yellow (f,g); Gαq, orange; Gαs, blue; Gαi, cyan; Gβ, light blue; Gγ, yellow; scFv16, light purple.
Overall structures of CCKAR coupled to different G proteins
The structures of sulfated CCK-8-bound CCKAR in complex with Gq, Gs or Gi heterotrimers were determined by single-particle cryo-EM at global resolutions of 2.9 Å, 3.1 Å and 3.2 Å, respectively (Fig. 1b–g, Supplementary Figs. 1–3 and Supplementary Table 1). Sulfated CCK-8 (DYSO3HMGMWDF-NH2), the highest-affinity natural ligand of CCKAR4, was used to assemble the CCKAR–G protein complexes. Three G-protein subtypes were engineered to stabilize the CCKAR–G protein complexes (Supplementary Fig. 4). Gαq is chimerized by replacing its αN-helix with the equivalent region of Gαi1 to facilitate scFv16 binding30. Gαs was modified based on the mini-Gαs that was used in the crystal structure determination of the Gs-coupled adenosine A2A receptor (A2AR)31. Two dominant-negative (DN) mutations (G203A and A326S32) were introduced to Gαi1, and corresponding DN mutations at equivalent sites of Gαs and Gαq were also introduced (Supplementary Fig. 4b). Unless otherwise specified, Gq, Gs and Gi refer to the respective engineered G proteins that are used in the CCKAR structure determination.
The final structures of the CCK-8–CCKAR–G protein complexes contain sulfated CCK-8 (residues D1P-F8P), Gα Ras-like domain, Gβγ subunits, scFv16 and the CCKAR residues (E38N_term-F3858.58, superscripts refer to Ballesteros–Weinstein numbering33). The majority of amino-acid side chains, including CCK-8, transmembrane domain (TMD), intracellular loops (ICLs 1–3) and extracellular loops (ECLs 1–3) were well resolved in the final models (Supplementary Fig. 5). Thus, the complex structures provide reliable details to study mechanisms of ligand recognition and G-protein coupling.
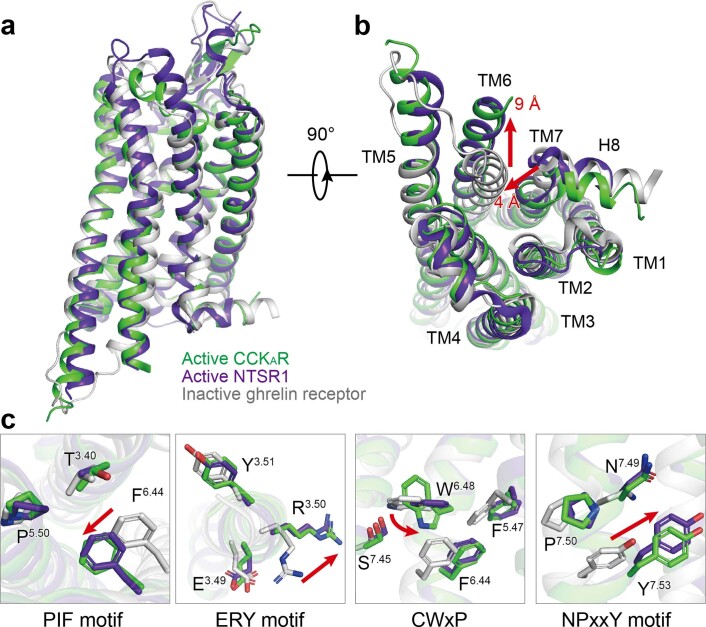
Globally, CCKAR adopts similar overall conformations in all three structures, with an all-atom root-mean-square deviation (r.m.s.d.) of 0.84 for Gq/Gs-coupled receptors and 1.03 for Gq/Gi-coupled receptors. The structure of the CCK-8–CCKAR–Gq complex, which has the highest resolution at 2.9 Å, was used for detailed analysis and mechanistic evaluation of ligand recognition and receptor activation. The inactive and active structures of the closed homolog receptors (inactive: ghrelin receptor, PDB 6KO534; active: neurotensin receptor 1 (NTSR1), PDB 6OS918), all belonging to the β-branch of the rhodopsin family, are applied for structural comparison. CCKAR presents a fully active conformation, resembling the Gi-coupled NTSR1, displaying an ~9-Å outward movement of TM6 (measured at the Cα of the residue at position 6.27 in CCKAR and the ghrelin receptor) and an ~4-Å inward shift of TM7 (Cα carbons of Y7.53) compared with the inactive ghrelin receptor (Extended Data Fig. 1a,b). Similar to the active NTSR1 complex, the conserved residues in the ‘micro-switches’ (PIF, ERY, CWxP and NPxxY) of CCKAR display the conserved conformations observed in active GPCRs (Extended Data Fig. 1c).
Extended Data Fig. 1. Active conformation of CCKAR.
a-b, Structural comparison of inactive ghrelin receptor (grey), active NTSR1 (purple blue), and active CCKAR (green). Side view (a) and intracellular view (b) of the overall comparison are shown. c, Structural rearrangements of key activation motifs (PIF, ERY, CWxP, and NPxxY) in CCKAR compared to inactive ghrelin receptor and active NTSR1. NTSR1, neurotensin receptor 1.
Recognition of sulfated cholecystokinin
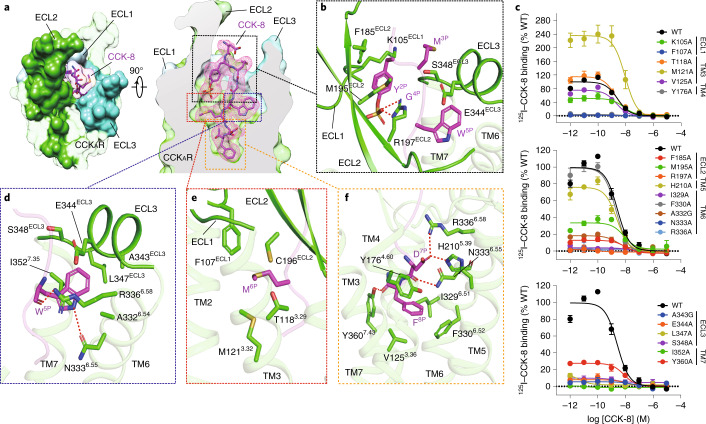
Sulfated CCK-8 occupies the orthosteric binding pocket composed of TM3, TM4, TM5–7 and ECL1–3 (Fig. 2 and Extended Data Figs. 2 and 3), with its C terminus inserting into the TMD bundle and the N terminus facing the extracellular vestibule (Fig. 2a). The binding pocket of CCK-8 is largely overlapped with that of other reported endogenous neuropeptides, such as neurotensin (NTS8-13, PDB 6OS918), angiotensin II (Ang II, PDB 6OS035), orexin B (OXB, PDB 7L1U36) and arginine vasopressin (AVP, PDB 7DW937). It is noteworthy that the extracellular sides of these neuropeptides undergo remarkable conformational shifts, while their intracellular parts converge in an approximately overlapped position at the bottom of the binding pocket (Extended Data Fig. 2).
Fig. 2. Recognition of sulfated CCK-8 by CCKAR.
a, CCK-8 sits in the orthosteric binding pocket of CCKAR, as shown in an extracellular view (left) and side view (right). The density map of CCK-8 is shown as a magenta mesh, and CCK-8 is displayed as magenta sticks. CCKAR is shown in green as a cutaway surface (right). ECL1 (light blue), ECL2 (lime green) and ECL3 (turquoise) are highlighted as solid surfaces. b, Detailed interactions between sulfated CCK-8 and three extracellular loops of CCKAR. c, Effects of mutations in the receptor ligand-binding pocket on CCK-8 binding activity assessed by a radiolabeled ligand-binding assay. Data are presented as mean ± s.e.m. of three independent experiments (n = 3), except for the WT (n = 4), and conducted in triplicate. Competition curves of mutants from ECL1, TM3 and TM4 (upper), ECL2, TM5 and TM6 (middle), and ECL3 and TM7 (bottom) compared to WT CCKAR are shown. d, Recognition of CCK-8 by the deep hydrophobic cavity beneath ECL3 of CCKAR. e, Recognition of CCK-8 by the shallow hydrophobic cavity beneath ECL1 and ECL2 of CCKAR. f, Recognition of CCK-8 by the bottom TMD region of CCKAR. Key interaction residues from CCKAR are shown as green sticks, and the receptor is shown in cartoon presentation. Polar interactions are indicated as red dashed lines.
Extended Data Fig. 2. Structure comparison of CCK-8 with other neuropeptides solved to date.
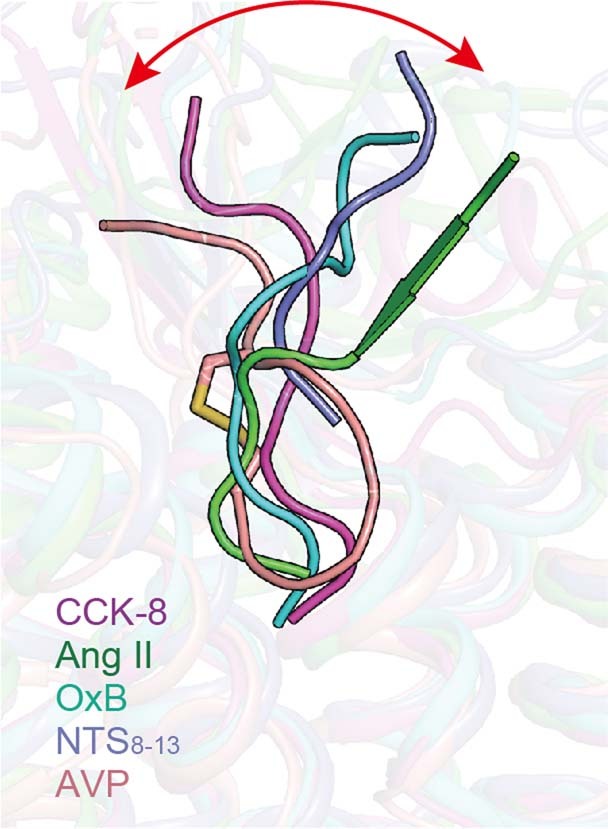
The neuropeptides are shown as a cartoon. The shift of the extracellular part of neuropeptides is highlighted as a red arrow. CCK-8 in the CCK-8–CCKAR–Gq complex structure, magenta; Ang II, angiotensin II (PDB: 6OS0), green; OxB, orexin B (PDB: 7L1U), cyan; NTS8-13, neurotensin 8-13 (PDB: 6OS9), purple blue; AVP, arginine vasopressin (PDB: 7DW9), salmon.
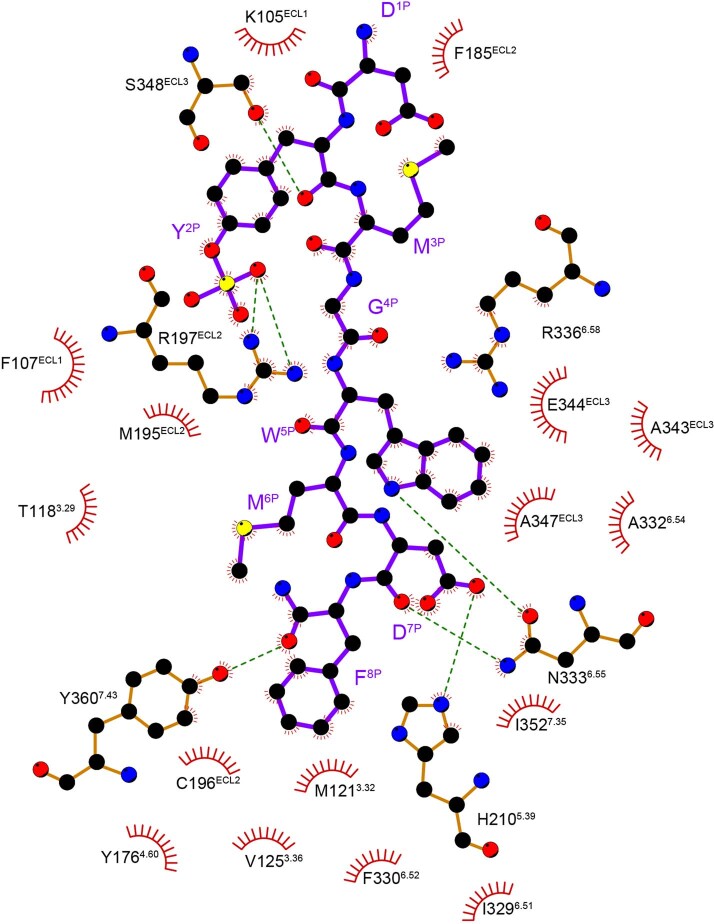
Extended Data Fig. 3. 2D interaction plot of CCKAR recognition by sulfated CCK-8.
Residues in the ligand-binding pocket are colored in green. CCK-8 is displayed as magenta sticks. Polar interactions are indicated as red dashed lines.
It is of interest that the octapeptide CCK-8 almost completely occupies the polypeptide-binding pocket, structurally supporting the fact that it is the smallest active form of CCK isoforms. The binding modes of CCK-8 are highly conserved in all three CCKAR–G protein complexes (all-atom r.m.s.d. of 0.71 for CCK-8 in Gq/Gs-coupled complexes, and 1.18 for CCK-8 in Gq/Gi-coupled complexes), supported by clear EM density maps (Fig. 2a and Supplementary Fig. 5). The region of ligand recognition by CCKAR can be divided into three major parts: (1) the extracellular loops, (2) hydrophobic cavities beneath ECLs and (3) the bottom of the TMD pocket (Fig. 2a).
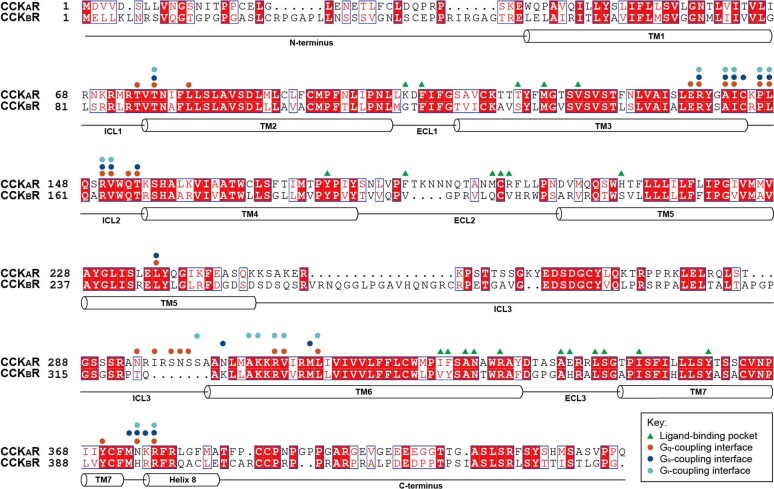
At the extracellular side, three ECLs are folded to embrace the N-terminal amino acids of CCK-8 (Fig. 2a). The sulfate group of ionic Y2P interacts with the side chain of R197ECL2. This polar interaction prompts the aromatic ring of Y2P to form hydrophobic contacts with F185ECL2, M195ECL2 and the main chain of K105ECL1, thus connecting CCK-8 to ECL1 and ECL2 (Fig. 2b and Extended Data Fig. 3). These structural observations are consistent with the previous finding that the R197ECL2M mutation was 1,470-fold less potent than the wild-type (WT) CCKAR11. The alanine mutation of R197ECL2 completely abolishes the binding of CCK-8, thus strongly supporting the contention that R197ECL2 serves as a determinant to discriminate between sulfated and non-sulfated CCK (Fig. 2c and Supplementary Table 2). Likewise, poor ligand selectivity of CCKBR may be attributed to a substitution of arginine for valine at the corresponding position (Extended Data Fig. 4). Meanwhile, M3P, G4P and W5P clamp the interior surface of ECL3 (Fig. 2b).
Extended Data Fig. 4. Sequence alignment of CCK receptors.
Helical secondary structures are shown based on CCKAR. Residues involved in ligand-binding are labeled with green triangles. Residues involved in G protein coupling are labeled with circles (orange, Gq; blue, Gs; cyan, Gi).
Two hydrophobic cavities exist below the ECLs to accommodate W5P and M6P (Fig. 2d,e). The side chain of W5P is sandwiched by the side chains of I3527.35 and R3366.58 and buries in a deep hydrophobic pocket composed of TM6, ECL3 and TM7 (Fig. 2d). The backbone CO group of W5P forms a hydrogen bond with R3366.58, and its indole nitrogen atom makes another hydrogen bond with N3336.55 (Fig. 2d and Extended Data Fig. 3), which is reported to be critical to CCKAR activation38. Alanine mutations in residues N3336.55, R3366.58, A343ECL3, E344ECL3, L347ECL3 and S348ECL3 completely abolish the binding of CCK-8, suggesting the key roles of these residues in CCK-8 recognition (Fig. 2c and Supplementary Table 2). In contrast to the W5P-occupied hydrophobic pocket, M6P sits in a relatively shallow hydrophobic cavity in the opposite direction, constituted by F107ECL1, C196ECL2, T1183.29 and M1213.32 (Fig. 2e and Extended Data Fig. 3). Mutating F107ECL1 and residues in ECL2 and ECL3 to alanine eliminated the binding ability of CCK-8 entirely, highlighting an essential function of the three ECLs in peptide recognition (Fig. 2c and Supplementary Table 2).
At the bottom of the binding pocket, D7P and main chain CO group of CCK-8 form a stabilizing polar interaction network with TM5 (H2105.39), TM6 (N3336.55 and R3366.58) and TM7 (Y3607.43) (Fig. 2f and Extended Data Fig. 3). The phenyl ring of F8P makes a polar hydrogen–π interaction with Y1764.60, and inserts into a large hydrophobic crevice composed of residues from TM3, TM4, TM5 and TM6 (Fig. 2f and Extended Data Fig. 3). Besides N3336.55 and R3366.58, which also interact in a polar manner with W5P, I3296.51 is closely related to CCK-8 binding (Fig. 2c and Supplementary Table 2).
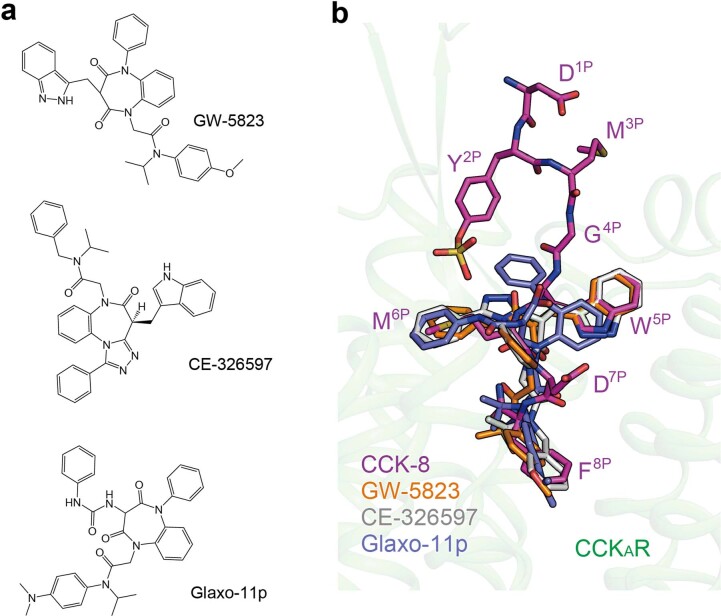
Elucidation of the recognition mechanism of CCK-8 provides clues for therapeutic development against CCKAR. GW-5823, CE-326597 and Glaxo-11p (Extended Data Fig. 5a) are small-molecule agonists for CCKAR with moderate activities10,39,40. Docking of these agonists to the CCKAR shows that they only occupy the bottom half of the TMD binding pocket, thus lacking essential interactions with ECLs 1–3 of CCKAR (Extended Data Fig. 5b). This structural feature may lead to a weaker activity of these small-molecule agonists relative to CCK-8. Together, our data provide a framework for understanding the mechanism of small-molecule agonist recognition and offer a template for guiding drug design targeting CCKAR.
Extended Data Fig. 5. Molecular docking of small molecule agonists to the CCKAR structure.
a, Chemical structures of small molecule agonists of CCKAR. b, Comparison of the binding poses of three agonists with CCK-8. CCK-8, magenta; GW-5823, orange; CE-326597, grey; Glaxo-11p, purple blue. CCK-8 and small molecule agonists are shown as sticks. The amino acids of CCK-8 are labelled.
Overall coupling mode of CCKAR–G protein complexes
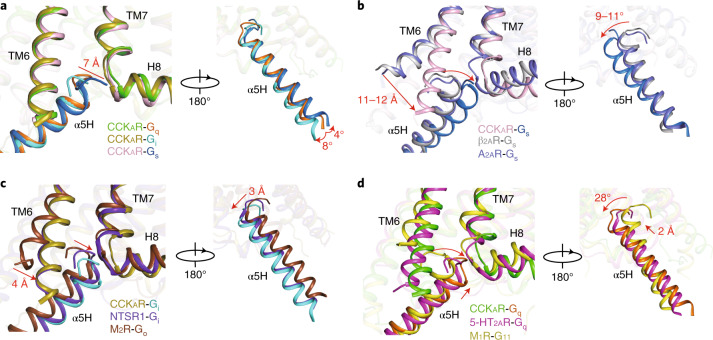
Although all four G-protein subtypes were reported to interact with CCKAR24, only three of the CCKAR–G protein samples (CCKAR–Gq, CCKAR–Gs and CCKAR–Gi protein complexes) were obtained for high-resolution cryo-EM structure determination (Fig. 1). Structural comparison indicated that TM6 and ICL2 in CCKAR adopt nearly identical conformations in Gq-, Gi- and Gs-coupled structures (Fig. 3a and Extended Data Fig. 6a–c). However, slightly different tilts of the Gα α5-helix were seen among the three heterotrimeric G proteins (4° for Gαq/Gαs and 8° for Gαq/Gαi; Fig. 3a). Meanwhile, the distal end of the Gαs α5-helix moves 7 Å outward, away from the TMD core relative to the equivalent Gαq residue (measured at the Cα atom of LH5.25, where superscripts refer to the common Gα numbering (CGN) system41; Fig. 3a). Gq presents the largest solvent-accessible surface area (SASA, 1,492 Å2) with the receptor, compared to a Gs value of 1,293 Å2 and Gi value of 1,167 Å2, consistent with a 6.6- to 20.3-fold increased potency of Gq coupling to CCKAR in comparison to coupling with Gs and Gi (Supplementary Table 3). This finding supports the hypothesis that the size of the G-protein coupling interface may correlate with the ability of a receptor to link with different G proteins21,22. In addition, coupling of different G-protein subtypes exhibits distinct effects on CCK-8 binding. Compared to Gs or Gi proteins, Gq coupling increases the binding affinity of CCK-8 (Supplementary Table 3), consistent with the increased binding activity of isoproterenol against β2AR in the presence of Gs protein16. This finding indicates an allosteric modulation effect of Gq protein on CCK-8 binding, supporting the positive cooperativity between agonists and G proteins42.
Fig. 3. Structural comparison of TM6 and the α5-helix between CCKAR–G protein complexes and representative Gs-, Gq- and Gi-coupled GPCR structures, in two different views.
a, Structural comparison of CCKAR–Gq, CCKAR–Gs and CCKAR–Gi complexes. A 7-Å movement of the distal end of the Gαs α5-helix (α5H) relative to that of Gαq and a swing of the Gα α5-helix are highlighted as red arrows. b, Structural comparison of CCKAR–Gs with β2AR–Gs and A2AR–Gs complexes. Red arrows indicate an 11–12-Å displacement of TM6 and a 9–11° swing of the Gα α5-helix of Gs-coupled CCKAR relative to Gs-coupled β2AR and A2AR. c, Structural comparison of CCKAR–Gi with the NTSR1–Gi and M2R–Go complexes. A 4-Å inward displacement of TM6 and a 3-Å Gαi α5-helix shift of Gq-coupled CCKAR in comparison to Go-coupled M2R are indicated as red arrows. d, Structural comparison of CCKAR–Gq with 5-HT2AR–Gq and M1R–G11 complexes. A 2-Å upward movement of Gαq of Gq-coupled CCKAR compared to Gq-coupled 5-HT2AR and a 28° rotation relative to G11-coupled M1R are highlighted as red arrows. The complex structures are aligned based on TM2–TM4 of the receptors. β2AR–Gs, A2AR–Gs, NTSR1–Gi, M2R–Go, 5-HT2AR–Gq and M1R–G11 structures (PDB 3SN6, 5G53, 6OS9, 6OIK, 6WHA and 6OIJ) are colored in gray, marine, purple blue, dark brown, magenta and yellow, respectively.
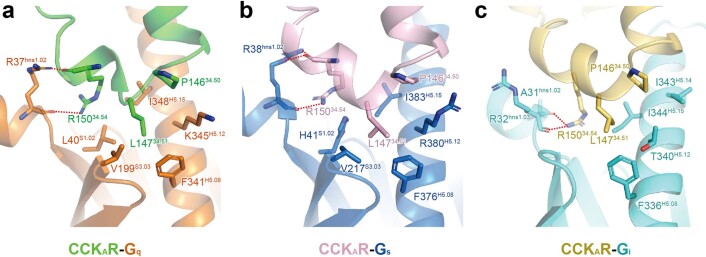
Extended Data Fig. 6. The interface between CCKAR ICL2 and different G proteins.
Detailed interaction between the receptor and Gαq (a), Gαs (b), and Gαi (c) are shown. Side chains of related residues are shown as sticks.
In addition, comparisons of these three complex structures to previously reported G-protein-coupled class A GPCRs reveal the different extent of TM6 displacement and the concomitant shift of the Gα α5-helix (Fig. 3b–d). TM6 of CCKAR in all three G-protein complexes displays an 11–12-Å (measured at the Cα atom of the residue at position 6.27) smaller outward displacement compared to Gs-coupled GPCRs, which translates into a notable swing of the Gα α5-helix in the same direction (9–11° relative to Gs-coupled β2AR and A2AR as measured at the Cα atom of YH5.23). This smaller displacement of TM6 is contrary to the previous assumption that TM6 of Gs-coupled GPCRs undergoes a notable outward movement, thus opening a larger cytoplasmic pocket to accommodate bulkier residues at the distal end of the Gαs α5-helix relative to Gi/o-coupled receptors21,43. To avoid a potential clash with TM6, the distal end of the Gαs α5-helix in the CCKAR–Gs complex stretches away from the TMD core and inserts into the crevice between the TM6 and TM7–helix 8 joint. This featured conformation of the Gαs α5-helix in the CCKAR–Gs complex is unique compared to that in structures of the Gs-coupled β2AR and A2AR, supporting the complexity of the GPCR–G protein coupling mechanism (Fig. 3b).
TM6 and the Gα α5-helix of CCKAR–G protein complexes display similar conformational changes to other Gi- and Gq-coupled GPCRs, such as the Gi-coupled NTSR1 and the Gq-coupled 5-HT2AR (Fig. 3c,d). TM6 of the CCKAR–Gi protein complex is highly overlaid with that of Gi-coupled NTSR1, while the cytoplasmic end of TM6 shows a 4-Å smaller outward displacement compared to that of Go-coupled M2R (Fig. 3c). On the G-protein side, the α5-helix of Gαi in the CCKAR–Gi complex shows a nearly overlapped conformation with that of the NTSR1–Gi complex. In contrast, it exhibits a 3-Å (measured at the Cα atom of YH5.23) shift away from TM6 relative to that of Go-coupled M2R (Fig. 3c). Structural comparison of Gq-coupled CCKAR with Gq/G11-coupled GPCRs demonstrates a 2-Å (measured at the Cα atom of YH5.23) upward shift toward the cytoplasmic cavity in comparison to the Gq-coupled 5-HT2AR and a 28° rotation away from TM6 relative to G11-coupled M1R (Fig. 3d).
Interactions of the ‘wavy hook’ of CCKAR–G protein complexes
The ‘wavy hook’ at the extreme C terminus of the Gα α5-helix is thought to be one of the coupling specificity determinants for G proteins44,45, and undergoes distinct conformational rearrangements among the three CCKAR–G protein complexes (Fig. 3a).
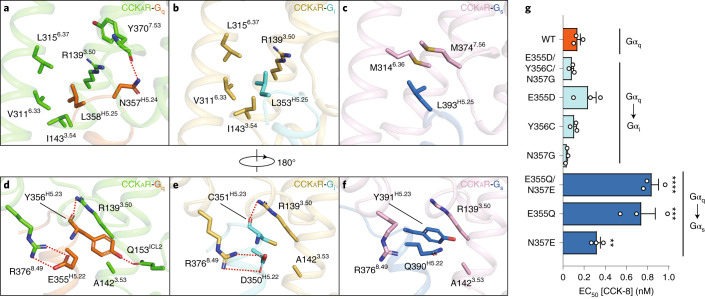
A structural comparison of the interaction interface between the receptor cytoplasmic cavity and the Gα ‘wavy hook’ reveals distinct features of CCKAR–G protein coupling. Well-defined densities of Gα-protein ‘wavy hook’ residues allow for detailed structural analyses except for residues at the –1 position. The L(–2)H5.25 in the α5-helix is highly conserved across the G-protein families and plays a pivotal role in G-protein coupling. Both L358H5.25 in Gαq and L353H5.25 in Gαi hydrophobically interact with residues in TM3 and TM6 (R1393.50, I1433.54, V3116.33 and L3156.37; Fig. 4a,b). Owing to the notable displacement of the Gαs C terminus, L393H5.25 in Gαs moves 7 Å outward away from the TMD core relative to the equivalent Gαq residue (Fig. 3a), repositioning it in a hydrophobic subpocket formed by M3146.36 and M3737.56 (Fig. 4c). In contrast to L(–2)H5.25, residues at positions H(–3)5.24, H(–4)5.23 and H(–5) 5.22 are less conserved. N357(–3)H5.24 in Gαq makes a hydrogen bond with the backbone CO group of Y3707.53 (Fig. 4a). As a result of the replacement of Gαi G352(–3)H5.24 and the repositioning of Gαs E392(–3)H5.24, the corresponding hydrogen bond is absent in CCKAR–Gi and CCKAR–Gs complex structures. Additionally, Y356(–4)H5.23 in Gαq forms extensive interactions with the receptor cytoplasmic cavity by making hydrogen bonds with R1393.50 and Q153ICL2 (Fig. 4d). By contrast, C351(–4)H5.23 in Gαi only forms a weak hydrogen bond with R1393.50 via its backbone CO group (Fig. 4e). Y391(–4)H5.23 in Gαs exhibits limited hydrophobic and van der Waals interactions with residues in TM2 and TM3 (T762.39, R1393.50 and A1423.53; Fig. 4f). Furthermore, both E355(–5)H5.22 in Gαq and D350(–5)H5.22 in Gαi form salt bridges with R3768.49 in CCKAR, while Q390(–5)H5.22 in Gαs disfavors the formation of the corresponding electrostatic interaction (Fig. 4d–f). To understand the ‘wavy hook’-mediated G-protein selectivity, we displaced the amino acids (H5.22–H5.25) in the Gαq subunit with the corresponding ones in the Gαs and Gαi subunits. Bioluminescence resonance energy transfer (BRET) assay results show that the Gαi displacement has no impact on CCKAR–G protein coupling compared to the WT Gαq subunit. However, partial (E355Q or N357E) or complete Gαs substitution remarkably decreased the G-protein coupling activity of CCKAR (Fig. 4g). These results indicate that the ‘wavy hook’ may play a crucial role in the coupling selectivity of CCKAR with Gq over the Gs protein.
Fig. 4. Distinct interaction patterns of residues from the ‘wavy hook’ motif.
a–c, Details of the interaction between CCKAR and L358H5.25 and N357H5.24 of the Gαq subunit (a), L353H5.25 of the Gαi subunit (b) and L393H5.25 of the Gαs subunit (c). d–f, Details of the interaction between CCKAR and Y356H5.23 and E355H5.22 of the Gαq subunit (d), C351H5.23 and D350H5.22 of the Gαi subunit (e) and Y391H5.23 and Q390H5.22 of the Gαs subunit (f). Hydrogen bonds and salt bridges are indicated as red dashed lines. g, BRET assay evaluating the effects of ‘wavy hook’ substitutions on CCKAR–G protein coupling. The ‘wavy hook’ residues of the Gαq subunit were displaced by the corresponding residues in the Gαs and Gαi subunits. Data are shown as mean ± s.e.m. of three independent experiments (n = 3), conducted in triplicate. All data were analyzed by one-way analysis of variance Dunnett multiple comparisons test (P = 1, P = 0.9827, P = 0.7521, P = 0.9994, P = 0.7421, P < 0.0001, P < 0.0001 and P = 0.2078 from top to bottom, ***P < 0.001, ****P < 0.0001 versus WT).
Contribution of CCKAR ICL3 to Gq coupling selectivity
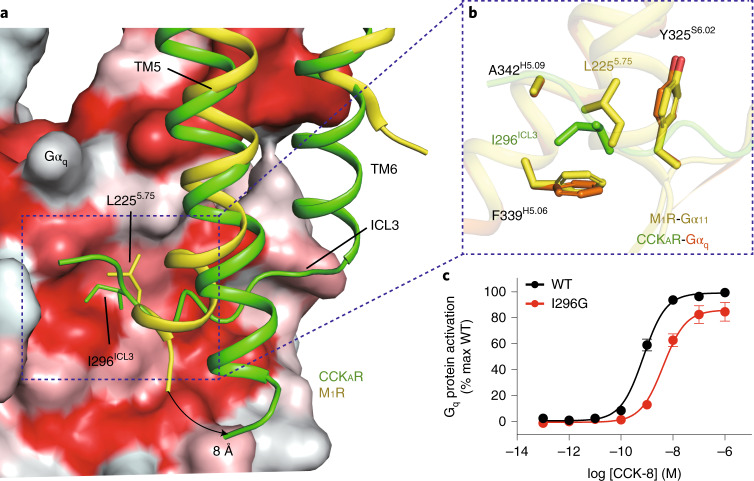
In the CCKAR–Gq protein complex structure, CCKAR displays a comparable length of TM5 relative to the M1R–G11 complex19. However, the cytoplasmic end of the CCKAR TM5 exhibits an 8-Å outward bend (measured at the Cα atoms of A5.73), which prevents it from interacting with the Gαq subunit (Fig. 5a). Instead, the ICL3 inserts into the cleft between TM5 of CCKAR and the α5-helix of the Gαq subunit (Fig. 5a). Compared to L2255.75 in M1R, I296ICL3 in CCKAR interacts with the same hydrophobic patch formed by the side chains of Y325S6.02, F339H5.06 and A342H5.09 in the Gαq subunit, but is buried deeper to create more closely packed hydrophobic contacts (Fig. 5a,b). These hydrophobic interactions are critical to CCKAR–Gq coupling, as evidenced by our BRET analysis showing that the I296ICL3G mutation significantly weakens Gq coupling to CCKAR but has no impact on Gs and Gi coupling (Fig. 5c and Supplementary Table 4). This hydrophobic patch, which lies on the outer surface, may be unique for the Gq/11 subunit. The equivalent residues in the Gαs and Gαi subunits are polar or charged residues, for which it would be energetically unfavorable to form hydrophobic interactions (Extended Data Fig. 7a–d). Indeed, this unconventional ICL3–Gq interaction is not seen in the structures of Gs- and Gi/o-coupled CCKARs (Fig. 3b,c). Together, our findings offer structural evidence on the possible role of ICL3 in CCKAR–Gq coupling preference. Hydrophobic residues on the inner surface of the ICL3 loop of CCKAR or the extended TM5 of M1R may represent a common feature of Gq/11-coupled GPCRs.
Fig. 5. Interaction between the ICL3 loop of CCKAR and the Gαq subunit.
a, I296ICL3 of CCKAR and L2255.75 of M1R occupy the same hydrophobic subpocket of the Gα subunit. The Gαq subunit is shown as a surface presentation by hydrophobicity (hydrophobic surface in red). An 8-Å outward bend of TM5 of CCKAR relative to that of M1R is highlighted by a black arrow. b, Detail of the interactions between I296ICL3(CCKAR)/L2255.75(M1R) and the hydrophobic patch comprising Y325S6.02, F339H5.06 and A342H5.09 of the Gαq and Gα11 subunits. c, BRET assay showing that the I296G mutation decreases the association rate of CCKAR with the Gq heterotrimer. Data are shown as mean ± s.e.m. of three independent experiments (n = 3), conducted in triplicate.
Extended Data Fig. 7. Comparison of the hydrophobic patch in Gαq subunit to the corresponding sites in other G proteins.
a, Sequence alignment of S6.02, H5.06, and H5.09 from Gαq, Gαs, and Gαi subunits. Residues at positions S6.02, H5.06, and H5.09 comprise the hydrophobic patch to interact with CCKAR ICL3. b-d, Surface presentation of the patch by hydrophobicity. Side chains of residues at positions S6.02, H5.06, and H5.09 in Gαq (b), Gαs (c), and Gαi (d) subunits are shown.
Discussion
As the largest family of cell surface receptors, GPCRs have more than 800 members but only couple to four G-protein subtypes. Specific GPCR signaling requires the receptor to couple with either a single or multiple G-protein subtypes45–47. Thus, one of the main questions is how does a given GPCR select a G-protein subtype for downstream signal transduction. The critical G-protein determinants of selectivity vary widely for different receptors that couple to specific G proteins. It is thought that Gs- or Gq-coupled receptors are relatively promiscuous and to some extent couple to Gi1 (ref. 22). However, Gi-coupled receptors are more selective22. The minor outward movement of TM6 contributes to such a superior Gi coupling selection in comparison to that of Gs (refs. 17,23,44,48,49). Although proven to be promiscuous, Gq-coupled receptors tend to adopt an active conformation similar to that of Gi-coupled GPCRs, reflecting the complexity of the GPCR–G protein coupling mechanism19,20. Because CCKAR has the ability to couple with different G-protein subtypes, it stands out as a suitable model for studying the promiscuity of G-protein coupling. In this article, we show that TM6 of CCKAR undergoes a similar outward displacement relative to Gi/o-coupled (NTSR1 and M2R) and Gq/11-coupled GPCRs (5-HT2AR and M1R), but has a smaller shift relative to Gs-coupled GPCRs (β2AR and A2AR). CCKARs share almost identical conformations, whereas Gq, Gs and Gi proteins vary in distinct orientations, producing different sizes of receptor–G protein interface. The predominant coupling to Gq by CCKAR can be explained by its largest interface of the three CCKAR–G protein complexes. Structural comparison of the three CCKAR–G protein complexes reveals that ‘wavy hook’ residues of the Gα α5-helix and ICL3 of the receptor are important for the coupling promiscuity. In addition, detailed inspections disclose structural clues relative to the recognition mechanism of sulfated CCK-8 by CCKAR, in which R197ECL2 is a major determinant. Together, our structures provide a framework for better understanding ligand recognition as well as G-protein coupling selectivity and promiscuity by CCKAR.
Methods
Expression and purification of CCKAR–G protein complexes
The WT CCKAR (residues 1–428) was used for cryo-EM studies. Full-length CCKAR complementary DNA was cloned into a modified pFastBac vector (Invitrogen) containing a hemagglutinin (HA) signal sequence followed by an 8× histidine tag, a double-maltose binding protein tag and a tobacco etch virus (TEV) protease site before the receptor sequence using homologous recombination (using a CloneExpress One Step Cloning Kit, Vazyme; Supplementary Fig. 4a). The N-terminal 1–29 amino acids of Gαq were replaced by the equivalent residues of Gαi1 to facilitate scFv16 binding19. An engineered Gαs construct was generated based on mini-Gαs31. The N-terminal 1–18 amino acids and the α-helical domain of Gαs were replaced by human Gαi1, thus providing binding sites for scFv16 and Fab-G50, respectively17,19. Additionally, human Gαi1 with two dominant-negative mutations (G203A and A326S32) was used to assemble a stable GPCR–Gi protein complex. These two cognate mutations also exist in engineered Gαq and Gαs (Supplementary Fig. 4b). Receptor, rat H6-Gβ, bovine Gγ and the specific Gα subunit were co-expressed in Spodoptera frugiperda (sf9) insect cells (Invitrogen) as previously described50. In addition, GST-Ric-8A (a gift from B. Kobilka) was applied to improve the expression of Gαq.
ScFv16 was applied to improve the protein stability of CCKAR–Gq and CCKAR–Gi complex samples. The monomeric scFv16 was prepared as previously reported51. Cell pellets of the co-expression culture were thawed and lysed in 20 mM HEPES, pH 7.4, 100 mM NaCl, 10% glycerol, 5 mM MgCl2 and 10 mM CaCl2 supplemented with EDTA-free protease inhibitor cocktail (TargetMol). CCKAR–G protein complexes were assembled at room temperature (r.t.) for 1 h by the addition of 10 μM CCK-8 (GenScript) and 25 mU ml−1 apyrase. The lysate was then solubilized in 0.5% lauryl maltose neopentyl glycol (LMNG), 0.1% cholesteryl hemisuccinate TRIS salt (CHS), and the soluble fraction was purified by nickel affinity chromatography (Ni Smart Beads 6FF, SMART Lifesciences). In the case of CCKAR–Gi and CCKAR–Gq complexes, a three-molar excess of scFv16 was added to the protein elute. The mixture was incubated with amylose resin for 2 h at 4 °C. The excess G protein and scFv16 were washed with 20 column volumes of 20 mM HEPES, pH 7.4, 100 mM NaCl, 10% glycerol, 0.01% LMNG, 0.002% CHS and 2 μM CCK-8. TEV protease was then included to remove the N-terminal fusion tags of CCKAR. After 1 h of incubation at r.t., the flow-through was collected, concentrated and injected onto a Superdex 200 10/300 column equilibrated in buffer containing 20 mM HEPES, pH 7.4, 100 mM NaCl, 0.00075% LMNG, 0.00025% glycol-diosgenin (GDN), 0.0002% CHS and 10 μM CCK-8. The monomeric complex peak was collected and concentrated to ~5 mg ml−1 for cryo-EM studies.
Cryo-electron microscopy grid preparation and image collection
For preparation of cryo-EM grids, 2.5 µl of each purified CCKAR–G protein complex was applied individually onto glow-discharged holey carbon grids (Quantifoil, Au300 R1.2/1.3) in a Vitrobot chamber (FEI Vitrobot Mark IV). The chamber was set to 100% humidity at 4 °C. Extra samples were blotted for 2 s and vitrified by plunging into liquid ethane. Grids were stored in liquid nitrogen for condition screening and data collection usage.
Automatic data collection of CCK-8–CCKAR–G protein complexes was performed on an FEI Titan Krios system at 300 kV. The microscope was operated with a nominal magnification of ×81,000 in counting mode, corresponding to a pixel size of 1.045 Å for the micrographs. A total of 5,415 videos for the dataset of the CCK-8–CCKAR–Gq–scFv16 complex, 5,008 for the dataset of the CCK-8–CCKAR–Gs complex and 4,811 for the dataset of the CCK-8–CCKAR–Gi–scFv16 complex were collected, respectively, by a Gatan K3 Summit direct electron detector with a Gatan energy filter (operated with a slit width of 20 eV; GIF) using SerialEM software. The images were recorded at a dose rate of ~26.7 e Å−2 s−1 with a defocus ranging from −0.5 to −3.0 μm. The total exposure time was 3 s and intermediate frames were recorded in intervals of 0.083 s, resulting in a total of 36 frames per micrograph.
Image processing and map reconstruction
Image stacks were subjected to beam-induced motion correction and aligned using MotionCor 2.1. Contrast transfer function (CTF) parameters were estimated by Ctffind4. Data processing was performed using RELION-3.052. Micrographs with measured resolution worse than 4.0 Å and micrographs imaged within the carbon area were discarded, generating 3,806 micrographs for the CCK-8–CCKAR–Gq–scFv16 dataset, 4,963 for the CCK-8–CCKAR–Gs dataset and 4,543 for the CCK-8–CCKAR–Gi–scFv16 dataset for further data processing. For particle selection, two-dimensional (2D) and 3D classifications were performed on a binned dataset with a pixel size of 2.09 Å. About 2,000 particles were manually selected and subjected to 2D classification. Representative averages were chosen as a template for particle autopicking. The autopicking process produced 3,405,355 particles for the CCK-8–CCKAR–Gq–scFv16 complex, 4,680,972 for the CCK-8–CCKAR–Gs complex and 4,270,010 for the CCK-8–CCKAR–Gi–scFv16 complex, which were subjected to reference-free 2D classifications to discard bad particles. Initial reference map models for 3D classification were generated by Relion using representative 2D averages. For the CCK-8–CCKAR–Gq–scFv16 complex, the particles selected from 2D classification were subjected to six rounds of 3D classification, resulting in a single well-defined subset with 555,628 particles. For the CCK-8–CCKAR–Gs complex, particles resulting from 2D classification were subjected to five rounds of 3D classification, resulting in two well-defined subsets with 499,924 particles. For the CCK-8–CCKAR–Gi–scFv16 complex, particles selected from 2D classification were subjected to seven rounds of 3D classifications, resulting in two well-defined subsets with 140,602 particles. Further 3D refinement, CTF refinement, Bayesian polishing and DeepEnhancer processing generated density maps with an indicated global resolution of 2.9 Å for the CCK-8–CCKAR–Gq–scFv16 complex, 3.1 Å for the CCK-8–CCKAR–Gs complex and 3.2 Å for the CCK-8–CCKAR–Gi–scFv16 complex, respectively, at a Fourier shell correlation of 0.143.
Model building and refinement
For the CCKAR–Gq complex, the initial Gq protein and scFv16 model were adopted from the cryo-EM structure of the M1R–G11 protein complex (PDB 6OIJ)19. The initial CCKAR model was generated by an online homology model building tool53. All models were docked into the EM density map using Chimera54, followed by iterative manual adjustment and rebuilding in COOT55 and ISOLDE56, and real-space refinement using Phenix programs57. The model statistics were validated using Phenix comprehensive validation. A model of the refined CCKAR from the CCKAR–Gq complex was used for the other two complexes. Models from PTH1R–Gs (PDB 6NBF) and FPR2–Gi (PDB 6OMM) were used as templates for the model building of Gs in the CCKAR–Gs complex and Gi1–scFv16 in the CCKAR–Gi complex, respectively. The fitted models were then built in the same way as the CCKAR–Gq complex. The final refinement statistics are provided in Supplementary Table 1. All figures were prepared using PyMol and Chimera software.
Radiolabeled ligand-binding assay
The WT or mutant CCKARs were transiently transfected into HEK 293T/17 cells (purchased from the Cell Bank at the Chinese Academy of Sciences), which were cultured in a poly-d-lysine-coated 96-well plate. After 24 h, the cells were washed twice and incubated with blocking buffer (Dulbecco’s modified Eagle medium (DMEM) supplemented with 33 mM HEPES, and 0.1% (wt/vol) bovine serum albumin (BSA), pH 7.4) for 2 h at 37 °C. After three washes with ice-cold phosphate-buffered saline (PBS), the cells were treated by a constant concentration of 125I-CCK-8 (40 pM, PerkinElmer) plus eight different doses of CCK-8 (1 pM to 10 μM) for 3 h at r.t. Cells were washed three times with ice-cold PBS and lysed by 50 μl of lysis buffer (PBS supplemented with 20 mM Tris-HCl and 1% (vol/vol) Triton X-100, pH 7.4). Subsequently, the plates were counted for radioactivity (counts per minute) in a scintillation counter (MicroBeta2 plate counter, PerkinElmer) using 150 μl of scintillation cocktail (OptiPhase SuperMix, PerkinElmer).
G-protein dissociation assay
G-protein dissociation was monitored by BRET experiments performed as previously reported58. Briefly, a C-terminal fragment of the G-protein-coupled receptor kinase 3 (GRK3ct) fused to a luciferase serves as a BRET donor. Gβγ dimer is labeled with the fluorescent protein Venus, a BRET acceptor. Upon G-protein heterotrimer activation, free Gβγ-Venus is released and binds to membrane-associated GRK3ct-luciferase, leading to an increased signal detectable by BRET.
HEK 293T/17 cells were seeded onto a 10 μg ml−1 Matrigel-coated six-well plate (1 × 10⁶ cells per well). After 4 h of culture, WT or mutant CCKAR (0.84 μg), Gα (Gαq, Gαs and Gαi, 2.1 μg each), Gβ (0.42 μg), Gγ (0.42 μg) and GRK (0.42 μg) were transiently transfected with Lipofectamine LTX reagent (Invitrogen). At 24 h post-transfection, cells were washed once with DMEM medium (no phenol red) and detached by EDTA. Cells were then collected by centrifugation at 1,000 r.p.m. for 5 min and resuspended in DMEM medium. Approximately 75,000 cells per well were distributed in 96-well flat-bottomed white microplates (PerkinElmer). The NanoBRET substrate (furimazine, 25 μl per well, Promega) was added, and the BRET signal (535 nm/475 nm ratio) was determined using an EnVision multilabel plate reader (PerkinElmer). The average baseline value recorded before CCK-8 stimulation was subtracted from BRET signal values.
NanoBiT G-protein recruitment assay
The recruitment of CCKAR to Gi protein was detected in sf9 cells using the NanoBiT method as previously reported59. Briefly, the LgBiT fragment of NanoBiT luciferase was fused to the C terminus of CCKAR. SmBiT was fused to the C terminus of the Gβ subunit with a 15-amino-acid flexible linker. CCKAR-LgBiT, Gαi1, SmBiT-fused human Gβ1 and human Gγ2 were co-expressed in sf9 insect cells. Cell pellets were collected by centrifugation after infection for 48 h. The cell suspension was dispensed in a 96-well plate (64,000 cells per well) at a volume of 80 μl diluted in the assay buffer (Hanks’ balanced salt solution buffer supplemented with 10 mM HEPES, pH 7.4) and incubated for 30 min at 37 °C. The cells were then reacted with 10 μl of 50 mM coelenterazine H (Yeasen) for 2 h at r.t. The luminescence signal was measured using an EnVision plate reader (PerkinElmer) at 30-s intervals (25 °C). The baseline was measured before CCK-8 addition for eight intervals, and the measurements continued for 20 intervals following ligand addition. Data were corrected to baseline measurements and the results were analyzed using GraphPad Prism 8.0 (Graphpad Software).
NanoBiT G-protein dissociation assay
Gs activation was measured by a NanoBiT dissociation assay. G-protein NanoBiT split luciferase constructs were generated by fusing the LgBiT in Gαs and the SmBiT to Gγ (a gift from A. Inoue, Tohoku University) as previously reported60. In brief, HEK 293T/17 cells were plated in 10-cm plates at a density of 3 × 10⁶ cells per plate. After 24 h, cells were transfected with 1.62 μg receptor plasmids, 0.81 μg Gαs-LgBiT, 4.1 μg Gβ and 4.1 μg SmBiT-Gγ using Lipofectamine LTX reagent (Invitrogen). The transiently transfected cells were then seeded into poly-d-lysine-coated 96-well plates (50,000 cells per well) and grown overnight before incubation in assay buffer. Measurement of the luminescence signal was identical to the steps described above.
Surface expression assay
HEK 293T/17 cells were seeded into a six-well plate and incubated overnight. After transient transfection with WT or mutant plasmids for 24 h, the cells were collected and blocked with 5% BSA in PBS at r.t. for 15 min and incubated with primary anti-Flag antibody (1:300, Sigma-Aldrich) at r.t. for 1 h. The cells were then washed three times with PBS containing 1% BSA followed by 1 h of incubation with donkey anti-mouse Alexa Fluor 488-conjugated secondary antibody (1:1,000, Thermo Fisher) at 4 °C in the dark. After three washes, the cells were resuspended in 200 µl of PBS containing 1% BSA for detection in a NovoCyte flow cytometer (ACEA Biosciences) utilizing laser excitation and emission wavelengths of 488 nm and 519 nm, respectively. For each assay point, ~15,000 cellular events were collected, and the total fluorescence intensity of the positive expression cell population was calculated. The gating strategy and the method for the calculation of expression are shown in Supplementary Fig. 6.
Molecular docking
Before docking, hydrogens were added to CCKAR and the whole system coordinates were optimized with a pH of 7.0. A grid file was then generated on the peptide pocket in our Gq-coupled CCKAR structure. Small-molecule ligands Glaxo-11p, GW-5823 and CE-326597 were prepared in the OPLS3 force field with a pH of 7.0 to generate 3D structures. Finally, glide docking with standard precision was applied to all ligands and the structures with the best docking score were picked as outputs.
Statistics
All functional study data were analyzed using Prism 8 (GraphPad) and are shown as the mean ± s.e.m. from at least three independent experiments. Concentration–response curves were evaluated with a three-parameter logistic equation. Significance was determined with either a two-tailed Student’s t-test or one-way analysis of variance Dunnett multiple comparisons test, and P < 0.05 was considered statistically significant.
Reporting Summary
Further information on research design is available in the Nature Research Reporting Summary linked to this Article.
Online content
Any methods, additional references, Nature Research reporting summaries, source data, extended data, supplementary information, acknowledgements, peer review information; details of author contributions and competing interests; and statements of data and code availability are available at 10.1038/s41589-021-00841-3.
Supplementary information
Supplementary Tables 1–4 and Figs. 1–6.
Unprocessed SDS-PAGE for Supplementary Fig. 1a.
Unprocessed SDS-PAGE for Supplementary Fig. 2a.
Unprocessed SDS-PAGE for Supplementary Fig. 3a.
Acknowledgements
We thank K. A. Martemyanov for expert advice on the BRET assay. The cryo-EM data were collected at the Cryo-Electron Microscopy Research Center, Shanghai Institute of Materia Medica (SIMM). We thank the staff at the SIMM Cryo-Electron Microscopy Research Center for their technical support. This work was partially supported by Ministry of Science and Technology (China) grants 2018YFA0507002 (H.E.X.) and 2018YFA0507000 (M.-W.W.); National Natural Science Foundation of China grants 31770796 (Y.J.), 81872915 (M.-W.W.), 81773792 (D.Y.) and 81973373 (D.Y.); National Science and Technology Major Project of China—Key New Drug Creation and Manufacturing Programs 2018ZX09735–001 (M.-W.W.), 2018ZX09711002-002-002 (Y.J.) and 2018ZX09711002-002–005 (D.Y.); Shanghai Municipal Science and Technology Commission Major Project 2019SHZDZX02 (H.E.X.); the Strategic Priority Research Program of Chinese Academy of Sciences (XDB37030103 to H.E.X.); Shanghai Sailing Program 19YF1457600 (Q.L.); Wellcome Trust Principal Research Fellowship 209407/Z/17/Z (T.I.C.); Novo Nordisk-CAS Research Fund grant NNCAS-2017–1-CC (D.Y.); China Postdoctoral Science Foundation grant 2021T140689 (F.Z.).
Extended data
Source data
Statistical source data.
Statistical source data.
Statistical source data.
Author contributions
Q.L. screened the expression constructs, optimized the CCKAR–G protein complexes, prepared the protein samples for final structure determination, participated in cryo-EM grid inspection and data collection, built and refined the structure models, prepared the constructs for functional assays, analyzed the structures and prepared the figures and wrote the initial manuscript. Y.Z. performed cryo-EM grid preparation, data collection and structure determination and participated in protein sample optimization and figure and manuscript preparation. T.I.C. helped build and refine the structure model. X.H. performed the molecular docking. J.D. and W.Y. designed G-protein constructs. F.Z. participated in data analysis. B.W. and Q.Z. supervised research. H.E.X. conceived and supervised the project, analyzed the structures and initiated collaborations with M.-W.W., and supervised Q.L., Y.Z., F.Z., J.D. and W.Y. M.-W.W. and D.Y. supervised X.C., A.D. and C.Y. in G-protein assay development and data analysis. M.-W.W. participated in manuscript writing. Y.J. supervised the studies, performed the structural analysis, prepared the figures and wrote the manuscript with input from all co-authors.
Data availability
Density maps and structure coordinates have been deposited in the Electron Microscopy Data Bank (EMDB) and the Protein Data Bank (PDB) with accession codes EMD-31387 and 7EZH for the CCK-8–CCKAR–Gi–scFv16 complex, EMD-31388 and 7EZK for the CCK-8–CCKAR–Gs complex, and EMD-31389 and 7EZM for the CCK-8–CCKAR–Gq–scFv16 complex. Source data are provided with this paper.
Competing interests
The authors declare no competing interests.
Footnotes
Peer review information Nature Chemical Biology thanks Zhenhua Shao, Irina Tikhonova and the other, anonymous, reviewer(s) for their contribution to the peer review of this work.
Publisher’s note Springer Nature remains neutral with regard to jurisdictional claims in published maps and institutional affiliations.
These authors contributed equally: Qiufeng Liu, Dehua Yang, Youwen Zhuang.
Contributor Information
H. Eric Xu, Email: eric.xu@simm.ac.cn.
Ming-Wei Wang, Email: mwwang@simm.ac.cn.
Yi Jiang, Email: yijiang@simm.ac.cn.
Extended data
is available for this paper at 10.1038/s41589-021-00841-3.
Supplementary information
The online version contains supplementary material available at 10.1038/s41589-021-00841-3.
References
- 1.Bowers ME, Choi DC, Ressler KJ. Neuropeptide regulation of fear and anxiety: implications of cholecystokinin, endogenous opioids and neuropeptide Y. Physiol. Behav. 2012;107:699–710. doi: 10.1016/j.physbeh.2012.03.004. [DOI] [PMC free article] [PubMed] [Google Scholar]
- 2.Rehfeld JF, Friis-Hansen L, Goetze JP, Hansen TV. The biology of cholecystokinin and gastrin peptides. Curr. Top. Med. Chem. 2007;7:1154–1165. doi: 10.2174/156802607780960483. [DOI] [PubMed] [Google Scholar]
- 3.Wank SA. Cholecystokinin receptors. Am. J. Physiol. 1995;269:G628–G646. doi: 10.1152/ajpgi.1995.269.5.G628. [DOI] [PubMed] [Google Scholar]
- 4.Dufresne M, Seva C, Fourmy D. Cholecystokinin and gastrin receptors. Physiol. Rev. 2006;86:805–847. doi: 10.1152/physrev.00014.2005. [DOI] [PubMed] [Google Scholar]
- 5.Moran TH, Smith GP, Hostetler AM, McHugh PR. Transport of cholecystokinin (CCK) binding sites in subdiaphragmatic vagal branches. Brain Res. 1987;415:149–152. doi: 10.1016/0006-8993(87)90278-2. [DOI] [PubMed] [Google Scholar]
- 6.Weatherford SC, Chiruzzo FY, Laughton WB. Satiety induced by endogenous and exogenous cholecystokinin is mediated by CCK-A receptors in mice. Am. J. Physiol. 1992;262:R574–R578. doi: 10.1152/ajpregu.1992.262.4.R574. [DOI] [PubMed] [Google Scholar]
- 7.Miller LJ, Holicky EL, Ulrich CD, Wieben ED. Abnormal processing of the human cholecystokinin receptor gene in association with gallstones and obesity. Gastroenterology. 1995;109:1375–1380. doi: 10.1016/0016-5085(95)90601-0. [DOI] [PubMed] [Google Scholar]
- 8.Hewson G, Leighton GE, Hill RG, Hughes J. The cholecystokinin receptor antagonist L364,718 increases food intake in the rat by attenuation of the action of endogenous cholecystokinin. Br. J. Pharmacol. 1988;93:79–84. doi: 10.1111/j.1476-5381.1988.tb11407.x. [DOI] [PMC free article] [PubMed] [Google Scholar]
- 9.Jordan J, et al. Stimulation of cholecystokinin-A receptors with GI181771X does not cause weight loss in overweight or obese patients. Clin. Pharmacol. Ther. 2008;83:281–287. doi: 10.1038/sj.clpt.6100272. [DOI] [PubMed] [Google Scholar]
- 10.Elliott RL, et al. Discovery of N-benzyl-2-[(4S)-4-(1H-indol-3-ylmethyl)-5-oxo-1-phenyl-4,5-dihydro-6H-[1,2,4]triazolo[4,3-a][1,5]benzodiazepin-6-yl]-N-isopropylacetamide, an orally active, gut-selective CCK1 receptor agonist for the potential treatment of obesity. Bioorg. Med. Chem. Lett. 2010;20:6797–6801. doi: 10.1016/j.bmcl.2010.08.115. [DOI] [PubMed] [Google Scholar]
- 11.Gigoux V, et al. Arginine 197 of the cholecystokinin-A receptor binding site interacts with the sulfate of the peptide agonist cholecystokinin. Protein Sci. 1999;8:2347–2354. doi: 10.1110/ps.8.11.2347. [DOI] [PMC free article] [PubMed] [Google Scholar]
- 12.Escrieut C, et al. The biologically crucial C terminus of cholecystokinin and the non-peptide agonist SR-146,131 share a common binding site in the human CCK1 receptor. Evidence for a crucial role of Met-121 in the activation process. J. Biol. Chem. 2002;277:7546–7555. doi: 10.1074/jbc.M108563200. [DOI] [PubMed] [Google Scholar]
- 13.Archer-Lahlou E, et al. Molecular mechanism underlying partial and full agonism mediated by the human cholecystokinin-1 receptor. J. Biol. Chem. 2005;280:10664–10674. doi: 10.1074/jbc.M409451200. [DOI] [PubMed] [Google Scholar]
- 14.Archer-Lahlou E, et al. Modeled structure of a G-protein-coupled receptor: the cholecystokinin-1 receptor. J. Med. Chem. 2005;48:180–191. doi: 10.1021/jm049886y. [DOI] [PubMed] [Google Scholar]
- 15.Miller LJ, Gao F. Structural basis of cholecystokinin receptor binding and regulation. Pharmacol. Ther. 2008;119:83–95. doi: 10.1016/j.pharmthera.2008.05.001. [DOI] [PMC free article] [PubMed] [Google Scholar]
- 16.Rasmussen SG, et al. Crystal structure of the β2 adrenergic receptor–Gs protein complex. Nature. 2011;477:549–555. doi: 10.1038/nature10361. [DOI] [PMC free article] [PubMed] [Google Scholar]
- 17.Kang Y, et al. Cryo-EM structure of human rhodopsin bound to an inhibitory G protein. Nature. 2018;558:553–558. doi: 10.1038/s41586-018-0215-y. [DOI] [PMC free article] [PubMed] [Google Scholar]
- 18.Kato HE, et al. Conformational transitions of a neurotensin receptor 1–Gi1 complex. Nature. 2019;572:80–85. doi: 10.1038/s41586-019-1337-6. [DOI] [PMC free article] [PubMed] [Google Scholar]
- 19.Maeda S, Qu Q, Robertson MJ, Skiniotis G, Kobilka BK. Structures of the M1 and M2 muscarinic acetylcholine receptor/G-protein complexes. Science. 2019;364:552–557. doi: 10.1126/science.aaw5188. [DOI] [PMC free article] [PubMed] [Google Scholar]
- 20.Kim K, et al. Structure of a hallucinogen-activated Gq-coupled 5-HT2A serotonin receptor. Cell. 2020;182:1574–1588. doi: 10.1016/j.cell.2020.08.024. [DOI] [PMC free article] [PubMed] [Google Scholar]
- 21.Qiao A, et al. Structural basis of Gs and Gi recognition by the human glucagon receptor. Science. 2020;367:1346–1352. doi: 10.1126/science.aaz5346. [DOI] [PubMed] [Google Scholar]
- 22.Okashah N, et al. Variable G protein determinants of GPCR coupling selectivity. Proc. Natl Acad. Sci. USA. 2019;116:12054–12059. doi: 10.1073/pnas.1905993116. [DOI] [PMC free article] [PubMed] [Google Scholar]
- 23.Rose AS, et al. Position of transmembrane helix 6 determines receptor G protein coupling specificity. J. Am. Chem. Soc. 2014;136:11244–11247. doi: 10.1021/ja5055109. [DOI] [PubMed] [Google Scholar]
- 24.Hauser AS, et al. Pharmacogenomics of GPCR drug targets. Cell. 2018;172:41–54. doi: 10.1016/j.cell.2017.11.033. [DOI] [PMC free article] [PubMed] [Google Scholar]
- 25.Paulssen RH, Fraeyman N, Florholmen J. Activation of phospholipase C by cholecystokinin receptor subtypes with different G-protein-coupling specificities in hormone-secreting pancreatic cell lines. Biochem. Pharmacol. 2000;60:865–875. doi: 10.1016/s0006-2952(00)00383-x. [DOI] [PubMed] [Google Scholar]
- 26.Wu V, et al. First intracellular loop of the human cholecystokinin-A receptor is essential for cyclic AMP signaling in transfected HEK-293 cells. J. Biol. Chem. 1997;272:9037–9042. doi: 10.1074/jbc.272.14.9037. [DOI] [PubMed] [Google Scholar]
- 27.Scemama JL, et al. CCK and gastrin inhibit adenylate cyclase activity through a pertussis toxin-sensitive mechanism in the tumoral rat pancreatic acinar cell line AR 4-2J. FEBS Lett. 1988;242:61–64. doi: 10.1016/0014-5793(88)80985-2. [DOI] [PubMed] [Google Scholar]
- 28.Sabbatini ME, Bi Y, Ji B, Ernst SA, Williams JA. CCK activates RhoA and Rac1 differentially through Gα13 and Gαq in mouse pancreatic acini. Am. J. Physiol. Cell Physiol. 2010;298:C592–C601. doi: 10.1152/ajpcell.00448.2009. [DOI] [PMC free article] [PubMed] [Google Scholar]
- 29.Le Page SL, Bi Y, Williams JA. CCK-A receptor activates RhoA through Gα12/13 in NIH3T3 cells. Am. J. Physiol. Cell Physiol. 2003;285:C1197–C1206. doi: 10.1152/ajpcell.00083.2003. [DOI] [PubMed] [Google Scholar]
- 30.Maeda S, et al. Development of an antibody fragment that stabilizes GPCR/G-protein complexes. Nat. Commun. 2018;9:3712. doi: 10.1038/s41467-018-06002-w. [DOI] [PMC free article] [PubMed] [Google Scholar]
- 31.Carpenter B, Nehme R, Warne T, Leslie AG, Tate CG. Structure of the adenosine A2A receptor bound to an engineered G protein. Nature. 2016;536:104–107. doi: 10.1038/nature18966. [DOI] [PMC free article] [PubMed] [Google Scholar]
- 32.Liu P, et al. The structural basis of the dominant negative phenotype of the Gαi1β1ɣ2 G203A/A326S heterotrimer. Acta Pharmacol. Sin. 2016;37:1259–1272. doi: 10.1038/aps.2016.69. [DOI] [PMC free article] [PubMed] [Google Scholar]
- 33.Ballesteros JA, Weinstein H. Integrated methods for the construction of three-dimensional models and computational probing of structure–function relations in G protein-coupled receptors. Methods Neurosci. 1995;25:366–428. [Google Scholar]
- 34.Shiimura Y, et al. Structure of an antagonist-bound ghrelin receptor reveals possible ghrelin recognition mode. Nat. Commun. 2020;11:4160. doi: 10.1038/s41467-020-17554-1. [DOI] [PMC free article] [PubMed] [Google Scholar]
- 35.Wingler LM, et al. Angiotensin and biased analogs induce structurally distinct active conformations within a GPCR. Science. 2020;367:888–892. doi: 10.1126/science.aay9813. [DOI] [PMC free article] [PubMed] [Google Scholar]
- 36.Hong C, et al. Structures of active-state orexin receptor 2 rationalize peptide and small-molecule agonist recognition and receptor activation. Nat. Commun. 2021;12:815. doi: 10.1038/s41467-021-21087-6. [DOI] [PMC free article] [PubMed] [Google Scholar]
- 37.Zhou, F. et al. Molecular basis of ligand recognition and activation of human V2 vasopressin receptor. Cell Res.10.1038/s41422-021-00480-2 (2021). [DOI] [PMC free article] [PubMed]
- 38.Gigoux V, et al. Arginine 336 and asparagine 333 of the human cholecystokinin-A receptor binding site interact with the penultimate aspartic acid and the C-terminal amide of cholecystokinin. J. Biol. Chem. 1999;274:20457–20464. doi: 10.1074/jbc.274.29.20457. [DOI] [PubMed] [Google Scholar]
- 39.Henke BR, et al. Optimization of 3-(1H-indazol-3-ylmethyl)-1,5-benzodiazepines as potent, orally active CCK-A agonists. J. Med. Chem. 1997;40:2706–2725. doi: 10.1021/jm970265x. [DOI] [PubMed] [Google Scholar]
- 40.Aquino CJ, et al. Discovery of 1,5-benzodiazepines with peripheral cholecystokinin (CCK-A) receptor agonist activity. 1. Optimization of the agonist ‘trigger’. J. Med. Chem. 1996;39:562–569. doi: 10.1021/jm950626d. [DOI] [PubMed] [Google Scholar]
- 41.Flock T, et al. Universal allosteric mechanism for Gα activation by GPCRs. Nature. 2015;524:173–179. doi: 10.1038/nature14663. [DOI] [PMC free article] [PubMed] [Google Scholar]
- 42.DeVree BT, et al. Allosteric coupling from G protein to the agonist-binding pocket in GPCRs. Nature. 2016;535:182–186. doi: 10.1038/nature18324. [DOI] [PMC free article] [PubMed] [Google Scholar]
- 43.Garcia-Nafria J, Tate CG. Cryo-EM structures of GPCRs coupled to Gs, Gi and Go. Mol. Cell. Endocrinol. 2019;488:1–13. doi: 10.1016/j.mce.2019.02.006. [DOI] [PubMed] [Google Scholar]
- 44.Garcia-Nafria J, Nehme R, Edwards PC, Tate CG. Cryo-EM structure of the serotonin 5-HT1B receptor coupled to heterotrimeric Go. Nature. 2018;558:620–623. doi: 10.1038/s41586-018-0241-9. [DOI] [PMC free article] [PubMed] [Google Scholar]
- 45.Kim HR, et al. Structural mechanism underlying primary and secondary coupling between GPCRs and the Gi/o family. Nat. Commun. 2020;11:3160. doi: 10.1038/s41467-020-16975-2. [DOI] [PMC free article] [PubMed] [Google Scholar]
- 46.Albert PR, Robillard L. G protein specificity: traffic direction required. Cell. Signal. 2002;14:407–418. doi: 10.1016/s0898-6568(01)00259-5. [DOI] [PubMed] [Google Scholar]
- 47.Woehler A, Ponimaskin EG. G protein-mediated signaling: same receptor, multiple effectors. Curr. Mol. Pharm. 2009;2:237–248. doi: 10.2174/1874467210902030237. [DOI] [PubMed] [Google Scholar]
- 48.Koehl A, et al. Structure of the µ-opioid receptor–Gi protein complex. Nature. 2018;558:547–552. doi: 10.1038/s41586-018-0219-7. [DOI] [PMC free article] [PubMed] [Google Scholar]
- 49.Draper-Joyce CJ, et al. Structure of the adenosine-bound human adenosine A1 receptor–Gi complex. Nature. 2018;558:559–563. doi: 10.1038/s41586-018-0236-6. [DOI] [PubMed] [Google Scholar]
- 50.Duan J, et al. Cryo-EM structure of an activated VIP1 receptor–G protein complex revealed by a NanoBiT tethering strategy. Nat. Commun. 2020;11:4121. doi: 10.1038/s41467-020-17933-8. [DOI] [PMC free article] [PubMed] [Google Scholar]
- 51.Zhuang Y, et al. Structure of formylpeptide receptor 2–Gi complex reveals insights into ligand recognition and signaling. Nat. Commun. 2020;11:885. doi: 10.1038/s41467-020-14728-9. [DOI] [PMC free article] [PubMed] [Google Scholar]
- 52.Scheres SH. RELION: implementation of a Bayesian approach to cryo-EM structure determination. J. Struct. Biol. 2012;180:519–530. doi: 10.1016/j.jsb.2012.09.006. [DOI] [PMC free article] [PubMed] [Google Scholar]
- 53.Kelley LA, Mezulis S, Yates CM, Wass MN, Sternberg MJ. The Phyre2 web portal for protein modeling, prediction and analysis. Nat. Protoc. 2015;10:845–858. doi: 10.1038/nprot.2015.053. [DOI] [PMC free article] [PubMed] [Google Scholar]
- 54.Pettersen EF, et al. UCSF Chimera—a visualization system for exploratory research and analysis. J. Comput. Chem. 2004;25:1605–1612. doi: 10.1002/jcc.20084. [DOI] [PubMed] [Google Scholar]
- 55.Emsley P, Cowtan K. Coot: model-building tools for molecular graphics. Acta Crystallogr. D Biol. Crystallogr. 2004;60:2126–2132. doi: 10.1107/S0907444904019158. [DOI] [PubMed] [Google Scholar]
- 56.Croll TI. ISOLDE: a physically realistic environment for model building into low-resolution electron-density maps. Acta Crystallogr. D Struct. Biol. 2018;74:519–530. doi: 10.1107/S2059798318002425. [DOI] [PMC free article] [PubMed] [Google Scholar]
- 57.Adams PD, et al. PHENIX: a comprehensive Python-based system for macromolecular structure solution. Acta Crystallogr. D Biol. Crystallogr. 2010;66:213–221. doi: 10.1107/S0907444909052925. [DOI] [PMC free article] [PubMed] [Google Scholar]
- 58.Masuho I, Martemyanov KA, Lambert NA. Monitoring G protein activation in cells with BRET. Methods Mol. Biol. 2015;1335:107–113. doi: 10.1007/978-1-4939-2914-6_8. [DOI] [PMC free article] [PubMed] [Google Scholar]
- 59.Xu P, et al. Structures of the human dopamine D3 receptor–Gi complexes. Mol. Cell. 2021;81:1147–1159. doi: 10.1016/j.molcel.2021.01.003. [DOI] [PubMed] [Google Scholar]
- 60.Inoue A, et al. Illuminating G-protein-coupling selectivity of GPCRs. Cell. 2019;177:1933–1947. doi: 10.1016/j.cell.2019.04.044. [DOI] [PMC free article] [PubMed] [Google Scholar]
Associated Data
This section collects any data citations, data availability statements, or supplementary materials included in this article.
Supplementary Materials
Supplementary Tables 1–4 and Figs. 1–6.
Unprocessed SDS-PAGE for Supplementary Fig. 1a.
Unprocessed SDS-PAGE for Supplementary Fig. 2a.
Unprocessed SDS-PAGE for Supplementary Fig. 3a.
Data Availability Statement
Density maps and structure coordinates have been deposited in the Electron Microscopy Data Bank (EMDB) and the Protein Data Bank (PDB) with accession codes EMD-31387 and 7EZH for the CCK-8–CCKAR–Gi–scFv16 complex, EMD-31388 and 7EZK for the CCK-8–CCKAR–Gs complex, and EMD-31389 and 7EZM for the CCK-8–CCKAR–Gq–scFv16 complex. Source data are provided with this paper.


