Abstract
Cancer metastasis accounts for nearly 90% of all cancer deaths. Metastatic cancer progression requires both cancer cell migration to the site of the metastasis and subsequent proliferation after colonization. However, it has long been recognized that cancer cell migration and proliferation can be uncoupled; but the mechanism underlying this paradox is not well understood. Here we report that TNFAIP8 (tumor necrosis factor-α-induced protein 8), a “professional” transfer protein of phosphoinositide second messengers, promotes cancer cell migration or metastasis but inhibits its proliferation or cancer growth. TNFAIP8-deficient mice developed larger tumors, but TNFAIP8-deficient tumor cells completely lost their ability to migrate toward chemoattractants and were defective in colonizing lung tissues as compared to wild-type counterparts. Mechanistically, TNFAIP8 served as a cellular “pilot” of tumor cell migration by locally amplifying PI3K–AKT and Rac signals on the cell membrane facing chemoattractant; at the same time, TNFAIP8 also acted as a global inhibitor of tumor cell growth and proliferation by regulating Hippo signaling pathway. These findings help explain the migration–proliferation paradox of cancer cells that characterizes many cancers.
Keywords: TNFAIP8, migration, proliferation, cellular pilot, YAP
Introduction
Tumor metastasis, the spread and outgrowth of tumor cells in distant organs, is a multi-step process that can induce epithelial-to-mesenchymal transition (EMT), cancer cell migration, colonization and proliferation in distant organs[1, 2]. Although both cancer cell migration and proliferation are required for effective metastasis, these two processes can be uncoupled as reported in many cancers[3, 4]. A switch from a proliferative state to an invasive or migratory state may be even be required for effective cancer cell dissemination, a critical step of metastasis. Tumor dormancy may also be explained by the decoupling between proliferation and migration of tumor cells. However, the mechanism(s) underlying this proliferation–migration uncoupling are not well understood.
TNFAIP8 (tumor necrosis factor-α-induced protein 8) is a member of the TIPE (TNFAIP8-like) family that also includes TIPE1, TIPE2 and TIPE3[5, 6]. TNFAIP8 has been reported to be an oncogene and negative regulator of apoptosis[7] and TNFAIP8 overexpression was positively associated with metastasis and poor prognosis in human epithelial ovarian cancer[8], gastric adenocarcinoma[9], esophageal squamous cell carcinoma[10], and other cancers[11, 12]. However, how TNFAIP8 regulates tumor development and metastasis remains poorly understood.
TIPE proteins are “professional” transfer proteins of PIP2 (phosphatidylinositol 4,5-bisphosphate) and PIP3 (phosphatidylinositol 3,4,5-trisphosphate), and are associated with both inflammation and cancer[6]. Although phosphoinositides constitute approximately only 1% of the membrane lipids, they play crucial roles in membrane receptor signaling. Immune receptors such as antigen receptors, integrins and chemokine receptors utilize phosphoinositides to exert their spatially and temporarily specific effects on cellular activation and/or migration. PIP3 is highly enriched in the leading edge, and controls cell migration by enhancing actin polymerization through both GTPase-dependent and -independent mechanisms. The Rho family of small GTPases that hydrolyze guanosine triphosphate (GTP) are among the best-characterized signaling molecules involved in cell migration. They are inactive when bound to GDP but active when bound to GTP, serving as molecular “on-and-off’ switches for signaling pathways[13]. During cell migration, the leading edge is loaded with active Rac1-GTP and thus promotes actin polymerization. By contrast, Rac1 is inactivated at the trailing edge (uropod), preventing the formation of leading-edge protrusions. TIPE proteins can directly bind and inhibit Rac1 in cells[14].
We recently reported that leukocytes lacking both TNFAIP8 and TIPE2 are “pilot-less” and thereby they were unable to migrate towards chemoattractants or into nervous tissue to facilitate the development of encephalomyelitis[15]. This prompted us to examine the hypothesis that TIPE proteins may function as cellular pilot to drive metastasis in tumor cells.
The Hippo/YAP signaling pathway was initially reported to regulate organ size and growth[16, 17]. This pathway is characterized by a series of protein phosphorylation events: Mst1/2 phosphorylates Lats which in turn phosphorylates YAP, resulting in its cytoplasmic retention and degradation. When Hippo signaling pathway is inactive, YAP enters nucleus, and together with Tead, activates downstream target gene transcription. Ctgf, Cyr61 and Ankrd1 are well-characterized YAP target genes in epithelial cells[18, 19]. Tremendous efforts have been made to identify the receptors that directly activate or inactivate Hippo signaling. G protein-coupled receptors (GPCR), the largest and most diverse integral membrane proteins, activated by external ligands to regulate internal signal transduction pathways were recently found to be linked to the Hippo pathway[18, 20]. In unstimulated cells, Gα is bound to guanosine diphosphate (GDP) as well as Gβγ to form the inactive G protein trimer. Upon stimulation, the α subunit, together with GTP, dissociates from β/γ subunits to initiate intracellular signaling in an α subunit-specific manner[21]. Lysophosphatidic acid (LPA) is a bioactive lipid that directly engages with the Hippo pathway to regulate cell proliferation. It works through G12/13-coupled receptors-mediated inhibition of Hippo pathway kinases Lats1/2, thereby activating YAP/TAZ transcription coactivators[18]. Importantly, TNFAIP8 was reported to preferentially interact with activated Gαi proteins via a 15-amino acid region in its C-terminus [22]. Using both genetic and immunological approaches, we report here that TNFAIP8 regulates tumor cell proliferation by targeting the Hippo pathway.
Results
Roles of TNFAIP8 in human and murine tumorigenesis
To determine the relevance of TNFAIP8 in human cancers, we analyzed the gene expression profile of TNFAIP8 in more than 20 types of cancers from the GEPIA2 database[23]. We found that TNFAIP8 mRNA expression was either positively or negatively associated with the patient survival for several tumor types (Extended Fig. 1a and b). Additionally, TNFAIP8 mRNA expression was positively correlated with the metastasis of many cancers (Extended Fig. 1c).
To explore the potential roles of TNFAIP8 in tumorigenesis, we induced liver tumors and fibrosarcoma in WT and TNFAIP8 knockout (TKO) mice with carcinogens DEN (diethylnitrosamine) and MCA (3-methylcholanthrene) as shown in Fig. 1a and d, respectively. Both carcinogens can induce tumors. DEN induced multiple tumors in the mice liver (Extended Fig. 2a), while MCA induced tumor subcutaneously (Extended Fig. 2b). The total tumor number per mouse in both models were similar between WT and TKO mice (Fig. 1b for liver tumor model and Fig. 1e for fibrosarcoma model). However, TKO mice developed larger tumors than WT mice (Fig. 1c for liver tumor model and Fig. 1f for fibrosarcoma model).
Fig. 1. Roles of TNFAIP8 in murine tumorigenesis and tumor cell proliferation.
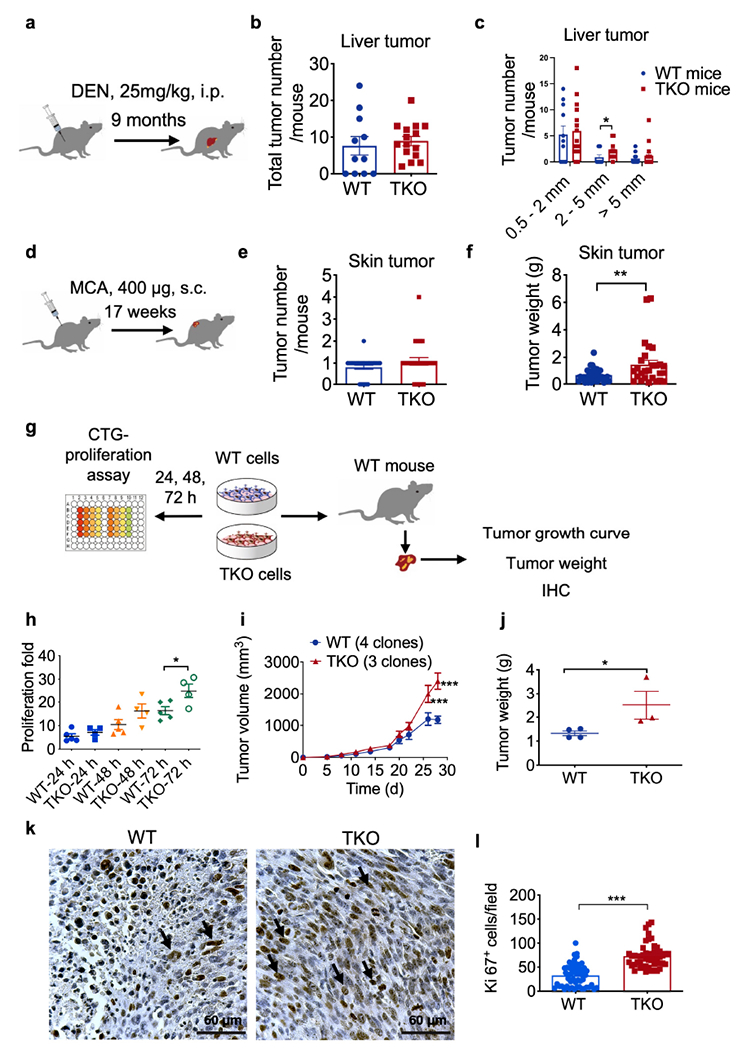
a, Schematics of experimental design of DEN-induced liver tumor.
b,c, Total liver tumor numbers per mouse (b) and numbers of different sizes of liver tumors per mouse (c) in wild-type (WT, n=11) and Tnfaip8−/− (TKO, n=15) mice, pooled from 2 experiments (*p = 0.0342).
d, Schematics of experimental design of MCA-induced fibrosarcoma.
e,f, Total tumor numbers per mouse (e) and MCA-induced fibrosarcoma tumor weight (f) in wild-type (WT, n=35) and Tnfaip8−/− (TKO, n=27) mice, pooled from 3 experiments (*p = 0.0057).
g, Schematics of experimental design of cell proliferation in vitro and in vivo.
h, In vitro cell proliferation of five WT (573, 604, 2595, 3850 and 3853) and four TKO (717, 719, 720 and 7320) MCA-induced fibrosarcoma cell lines for indicated times as determined by cell titer glo assay, representative of 4 experiments. Each data point represents a different cell line (*p = 0.0343)
i,j, Tumor growth in WT mice that were injected s.c. with WT and TKO cells (i, WT 604, 2595, 3850 and 3853 cells; TKO 717, 720 and 7320 cells, ***p = 0.000006 for day 26, ***p < 0.000001 for day 28), and tumor weight at the end of the experiment (j, ***p = 0.000006), representative of 3 experiments.
k,l, IHC staining for Ki67 of tumor tissue sections. Representative photographs of WT and TKO tumor sections (k) and their quantification of Ki67+ cells (1, ***p < 0.0001), n=12 mice, 4-7 sections per tumor, representative of 3 experiments. Scale bars = 60 μm.
For all graphs, *p < 0.05; **p <0.01; ***p < 0.001 vs WT; data are presented as mean ± SEM. Statistical significance was determined by two-tailed unpaired t-test (b, e, h and l) or multiple t test (i).
The larger tumors observed in TKO mice could be related to either tumor cell-autonomous and/or tumor cell-exogenous roles of TNFAIP8. To distinguish between these two possibilities, WT and TKO tumor derived fibrosarcoma cell line[24] were subcutaneously inoculated into both WT and TKO syngeneic mice (Extended Fig. 2c). TNFAIP8 deficiency in recipient mice did not significantly affect the growth of either WT or TKO tumor cells, indicating that “cancer cell-intrinsic TNFAIP8”, but not TNFAIP8 expression in non-cancer cells, controlled tumor growth in our model (Extended Fig. 2d–g).
Increased proliferation of TNFAIP8-deficient fibrosarcoma cells
From MCA-induced tumors, several WT and TKO fibrosarcoma primary cell lines (each from a separate mouse) were generated[24]. Tnfaip8 mRNA levels in WT cells were all similar, but were lost in TKO cells (Extended Fig. 2h and j). All cell lines had fibroblast-like morphology (Extended Fig. 2i). By contrast, TNFAIP8 deficiency in tumor cells resulted in significantly increased cell growth both in vitro (Fig. 1g and h) and in vivo (Fig. 1i and j). Consistent with these observation, cell proliferation was increased in TKO tumors, as judged by a cell proliferation marker, Ki67 (Fig. 1k and l).
Complete loss of directionality of TNFAIP8-deficient fibrosarcoma cells during chemotaxis
To test the potential roles of TNFAIP8 in cancer cell migration, we first studied WT and TKO fibrosarcoma cells in a transwell migration assay. WT cells demonstrated greater migration ability when compared with TKO cells (Fig. 2a–c). Effective chemotaxis requires both motility (the ability to move) and directionality (the ability to follow the chemoattractant gradient), which cannot be distinguished by transwell assay. We therefore performed time-lapse video microscopy to track the trajectory of individual migrating cells following treatment with chemoattractant platelet-derived growth factor (PDGF). Remarkably, TKO cells showed complete loss of directionality and slightly reduced velocity (Fig. 2d–g). In addition to PDGF, we tested another chemoattractant called lysophosphatidic acid (LPA), a GPCR-binding ligand[25]. Again, WT cells demonstrated greater migratory ability towards LPA than TKO cells as shown in the Extended Fig. 3. Colony formation and adhesion assays revealed no significant differences between five WT and four TKO cell lines (Extended Fig. 2k and l).
Fig. 2. Roles of TNFAIP8 in tumor cell migration in vitro and tumor cell trafficking in mice.
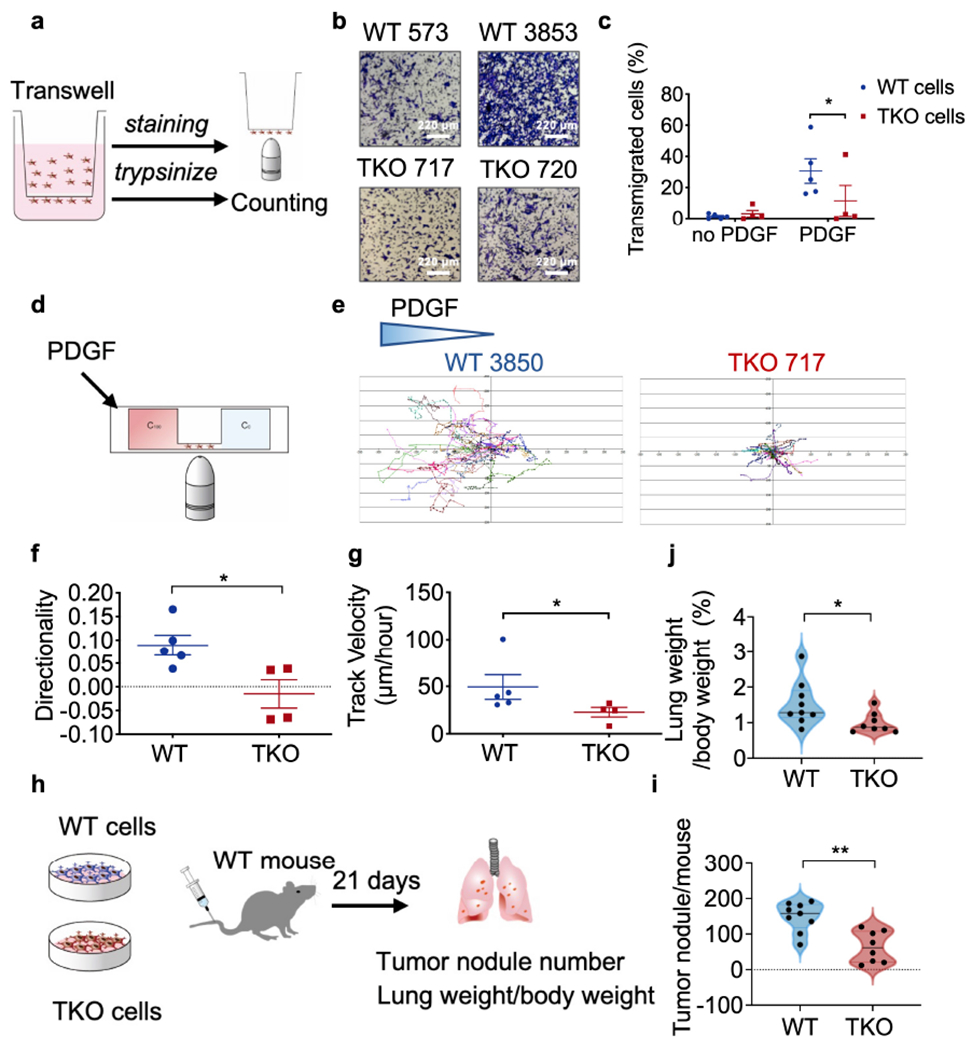
a, Schematics of experimental design of the transwell assay.
b,c, In vitro transmigration of five WT (573, 604, 2595, 3850 and 3853) and four TKO (717, 719, 720 and 7320) tumor cell lines with or without PDGF treatment for 16 h, as determined by the transwell assay. Representative photographs of 3 experiments (b) and percentages of transmigrated cells (c, p=0.0493) are shown. Scale bars = 220 μm. representative of 3 experiments.
d, Schematics of experimental design of μ-slide migration assay.
e-g, In vitro migration of five WT (573, 604, 2595, 3850 and 3853) and four TKO (717, 719, 720 and 7320) tumor cell lines with or without PDGF stimulation as measured by the μ-slide assay. Representative migration tracks (e), directionality (f, p=0.0317) and speed (g, p=0.0317) of tumor cells from 3 experiments. N=15-20 cells per cell line.
h, Schematics of the experimental model of tumor cell metastasis.
i,j, Tumor nodule numbers in WT mice that were injected i.v. with WT (573, 604, 2595, 3850, 3853) or TKO (717, 719, 720, 7320) tumor cells (i, n=9 mice/group pooled from 3 experiments, p=0.0037), and lung weight as a percentage of the body weight at the end of the experiment (j, p=0.0274).
For all graphs, *p < 0.05; **p < 0.01 vs WT; data are presented as mean ± SEM. Statistical significance was determined by Mann-Whitney U-test (b, f, g, i, j).
Consistent with the migratory defect described above, in a murine experimental model of metastasis in which WT and TKO tumor cells were inoculated via tail vein, there were significantly more tumor nodules in the lungs of WT mice when compared with TKO mice (Fig. 2h–j) indicating that TNFAIP8 controls experimental tumor metastasis in vivo.
Increased YAP and myogenesis signaling pathway in TNFAIP8-deficient fibrosarcoma cells
To determine the global impact of TNFAIP8 deficiency on gene expression, we treated WT and TKO cells with or without PDGF or LPA and performed RNA-sequencing (Fig. 3a). About 650 genes were upregulated in TKO cells by more than 4-fold changes (Fig. 3b and c). We found that YAP was one of the genes upregulated in TKO cells. Among the affected pathways, myogenesis (Fig. 3d and g) and YAP-related (Fig. 3e and f) genes were highly enriched. Myogenesis genes (Myod1 and Myog) were upregulated in TKO cells or tumors (Fig. 4a). Cyr61 and Ankrd1 are well-characterized YAP target genes that regulate cell proliferation[18]. Transcripts Per Kilobase Million (TPM) of Anrkd1 mRNAs were more abundant in TKO cells after LPA stimulation (Fig. 3f), which was also confirmed by qPCR with cell lines and tumors (Fig. 4b). LPA belongs to a family of glycerophospholipid-signaling molecules present in all tissues, and it is effective in inducing YAP de-phosphorylation, causing nuclear YAP translocation. Under resting state, all TKO cells exhibited higher levels of YAP in the nucleus. After LPA stimulation, TKO cells had further increase in nuclear YAP translocation compared to WT cells (Fig. 4c and d). When Hippo signaling pathway is inactive, YAP enters the nucleus, combined with Tead, and activates downstream target gene transcriptions. We found that Cyr61 and Ankrd1 were significantly upregulated in TKO cells, indicating that the increased nuclear YAP activation had downstream functional effects on cell growth. Furthermore, under resting culture condition, we saw less phosphorylated YAP (Ser397 and Ser127) and more phosphorylated MOB in TKO cells (Fig. 4e and Extended Fig. 4), whereas LPA induced less YAP phosphorylation in TKO (Fig. 4f and g), together indicating increased YAP activation. LPA also induced more proliferation in TKO cells (Extended Fig. 5a). In addition, the YAP/TEAD inhibitor-verteporfin delayed TKO cell proliferation much more than it did in WT cells (Extended Fig. 5b). Interestingly, Verteporfin blocked PDGF induced migration and AKT phosphorylation in WT cells in a dose-dependent manner (Extended Fig. 5c and Extended Fig. 6).
Fig. 3. The global impact of TNFAIP8 deficiency on tumor cell gene expression.
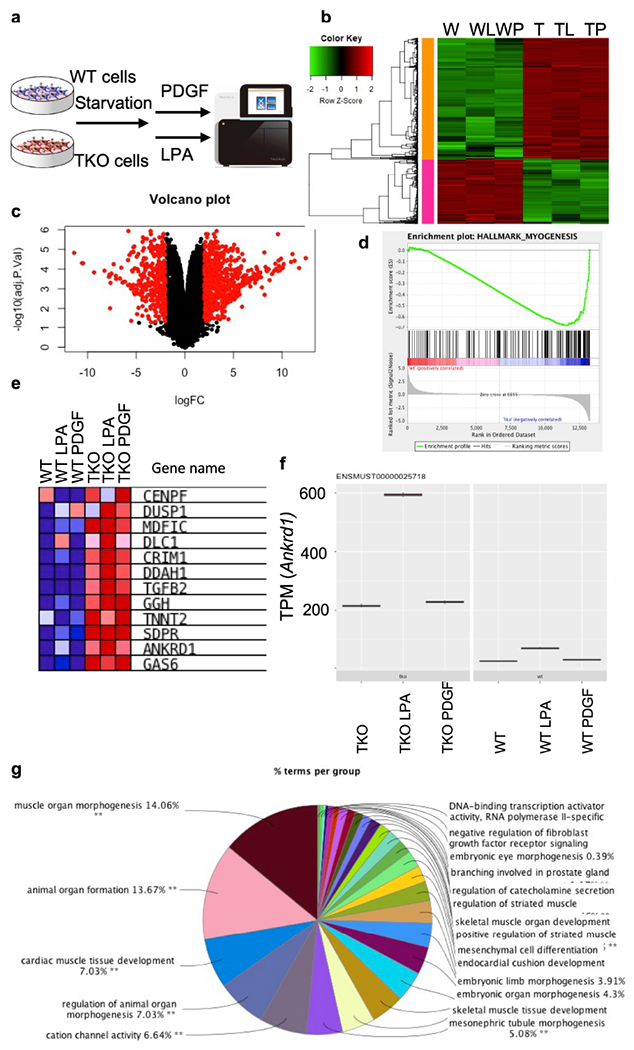
a, Schematics of experimental design of RNAseq. RNA sample was pooled from five WT (573, 604, 2595, 3850 and 3853) cell lines and four TKO (717, 719, 720 and 7320) cell lines.
b, Heat map of WT and TKO cells (with no treatment, or with LPA or PDGF treatment). FDR<0.05, fold regulation>4.
c, Volcano plot showing genes that are changed in TKO cancer cells.
d, Results from gene set enrichment analysis (GSEA) of the RNAseq data of WT and TKO cells (without stimulation), showing enrichment of genes related to myogenesis.
e, Heat map of the RNAseq data of WT and TKO cells, showing enrichment of Hippo pathway-related genes.
f, Transcripts Per Kilobase Million (TPM) value of YAP downstream gene Ankrd1 in the RNA samples, with or without PDGF/LPA stimulations.
g, Top enriched Gene Ontology pathways of downregulated genes in TKO tumor cells.
Fig. 4. Hippo- and myogenesis-related gene expression and YAP nuclear translocation.
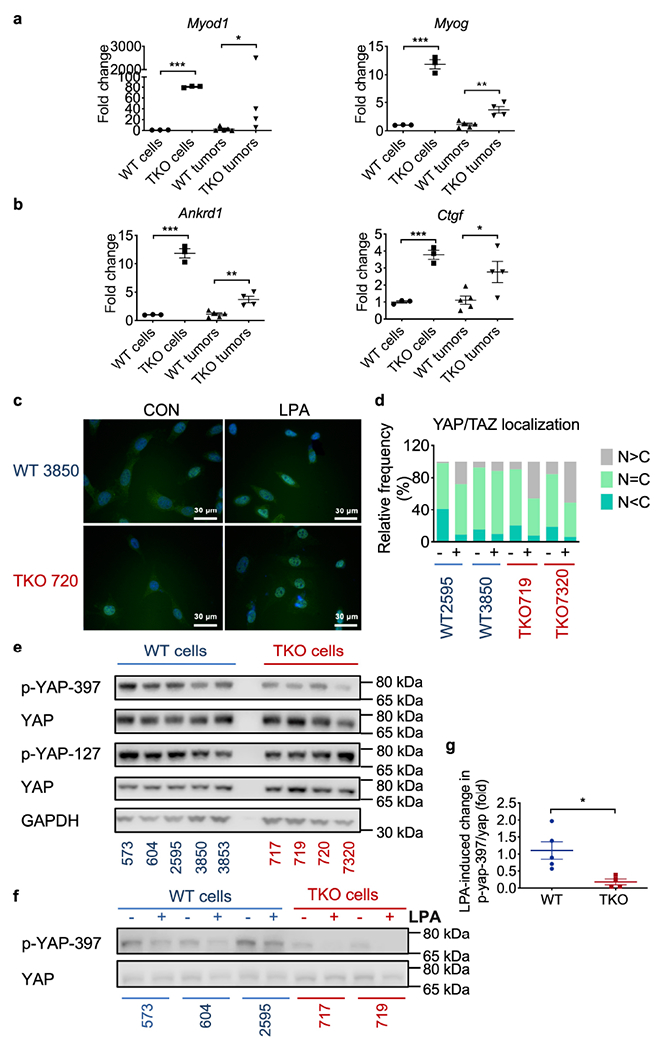
a,b, Relative mRNA levels of myogenesis (a p<0.0001 and p=0.0317 for Myod1, p=0.0002 and p=0.0026 for Myog) and Hippo related genes (b, p=0.0002 and p=0.0026 for Ankrd1, p=0.0005 and p=0.0305 for Ctgf) in LPA-stimulated cells from RNAseq samples and individual tumors from the subcutaneous model as compared to WT samples, as determined by real-time RT-PCR. Representative of 3 experiments with duplicates or triplicates.
c,d, YAP/TAZ subcellular localization determined by immunofluorescence staining along with DAPI staining for DNA. Representative photographs (c) and quantification of cells (n=50) from five randomly selected fields (d) for YAP/TAZ localization. N, nuclear; C, cytoplasmic. Scale bars = 30 μm. Representative of 3 experiments with 2-3 cell lines each time.
e, YAP protein expression in WT (n=5 cell lines) and TKO (n=4 cell lines) fibrosarcoma cells under normal culture condition as determined by Western blot. Representative of 3 experiments.
f,g, Phosphorylated YAP397 and total YAP protein expression in lysates of WT and TKO fibrosarcoma cells cultured with (+) or without (−) LPA stimulation for 1 hour, and their quantification (g, p=0.018, WT 573, 604, 2595, 3850 and 3853; TKO 717, 719, 720 and 7320) as determined by Western blot.
For all graphs, *p < 0.05; **p < 0.01; ***p < 0.001 vs WT; data are presented as mean ± SEM. Representative of 3 experiments. Statistical significance was determined by two-tailed unpaired t-test except Myod1 in tumor sample which was analyzed by Mann-Whitney U-test.
Defective activation of phosphoinositide second messengers and signaling
To explore downstream signaling, we performed Western blot analyses for AKT, GSK3β, and cofilin. Without stimulation, WT and TKO cells showed similar phosphorylation levels of AKT and GSK3β (Fig. 5a). After PDGF stimulation, phosphorylation of AKT-S473 and GSK3β increased markedly in WT cells, but little or no change was found in TKO cells (Fig. 5a). To quantify phosphorylation, fold change was calculated using the un-stimulated WT and TKO cells as individual controls (Fig. 5b). Phosphorylation level of AKT-308 was also examined after stimulation via flow cytometry, which showed significant activation defect in TKO cells as compared to WT cells (Fig. 5c and d). These data showed that WT cells were more responsive to PDGF stimulation. Additionally, WT cells were more sensitive to LPA stimulation when compared with TKO cells (Fig. 5e–g). We next used PLCD-PH domain and AKT-PH domain biosensors to visualize PIP2 and PIP3 with or without PDGF stimulation. After stimulation, PIP2 levels in WT cells were significant decreased, with a concordant increase in PIP3 level. By contrast, PDGF stimulation did not significantly alter either PIP2 or PIP3 levels in TKO cells (Fig. 5h and i). Finally, mass ELISA confirmed the presence of increased PIP3 in WT tumor cells when comparing with TKO cells (Fig. 5j and k).
Fig. 5. Activation of phosphoinositide second messengers and signals.
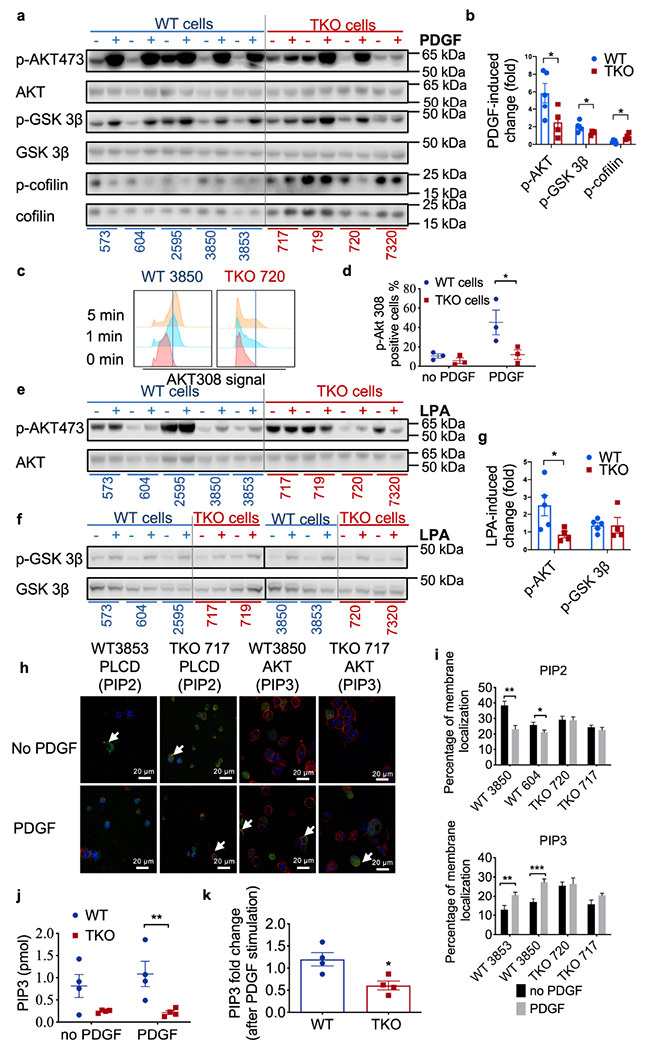
a,b, AKT, GSK-3β and cofilin protein expression in lysates of fibrosarcoma cells cultured with (+) or without (−) PDGF stimulation for 20 min as determined by Western blot (a), and quantification for 5 WT and 4 TKO cell lines (b, p=0.0468 for p-AKT, p=0.047 for p-GSK-3β, p=0.0225 for cofilin). Representative of 3 experiments.
c,d, Phosphorylated AKT308 abundance in WT 3850 and TKO 720 fibrosarcoma cells with (+) or without (−) PDGF stimulation on for 0, 1 and 5 min as determined by Flow cytometry (c) and its quantification for WT 604, 3850, 3853 and TKO 717, 720, 7320 cells (d, p=0.0103). Representative of 4 experiments.
e-g, AKT, GSK-3β and YAP protein expression in lysates of fibrosarcoma cells cultured with (+) or without (−) LPA stimulation for 1 hour as determined by Western blot and its quantification for 5 WT and 4 TKO cells (g, p=0.0463). Representative of 2 experiments.
h,i, Visualization of PLCD-PH-GFP and AKT-PH-GFP by confocal microscopy, with cell membrane stained with WGA and nuclei stained with DAPI in WT and TKO cells. White arrows indicate GFP signals on membrane. Two cell lines were used for each genotype. Cells (n=50) in five randomly selected fields were selected for the quantification of PIP2 and PIP3 signals on membrane (i, p=0.0012 and 0.0434 for PIP2, p=0.0061 and 0.0003 for PIP3). Scale bars = 20 μm. Representative of 4 experiments.
j,k, PIP3 amount in 4 WT (573, 604, 2595, 3850 and 3853) and 4 TKO (717, 719, 720 and 7320) cells with and without PDGF stimulation detected by ELISA (j, p=0.008), and calculated PIP3 fold changes before and after stimulation (k, p=0.0172). Representative of 2 independent experiments. For all graphs, *p < 0.05; **p < 0.01; ***p < 0.001 vs WT; data are presented as mean ± SEM. Statistical significance was determined by two-tailed unpaired t-test (b, i and k) and multiple t test (d, g and j).
More migration but less proliferation when TNFAIP8 expression is rescued in TKO cells
We next assessed the role of TNFAIP8 in regulating cellular proliferation and migration by rescuing TNFAIP8 expression in TKO cells using an MSCV-Luciferase-EF1-copGFP-T2A-Puro plasmid (Fig. 6a). The expression level of TNFAIP8 was tested by qPCR (Extended Fig. 7a) and Western blot (Extended Fig. 7b). TNFAIP8 was partially rescued in these cells (Extended Fig. 7c) with the isoform information in Extended Fig.8. PDGF induced more phosphorylated AKT in TNFAIP8-long cells (Fig. 6b and Extended Fig. 7d). Functionally, TNFAIP8 rescue downregulated cell proliferation (Fig. 6c) but upregulated cell migration (Fig. 6d). To confirm the signaling result generated in vitro, tumor proteins (in vivo samples) were extracted and probed for AKT and YAP. As expected, less phosphorylation of AKT and YAP was observed in these cells (Fig. 6e and f).
Fig. 6. Effect of TNFAIP8 loss and re-expression on tumor cells.
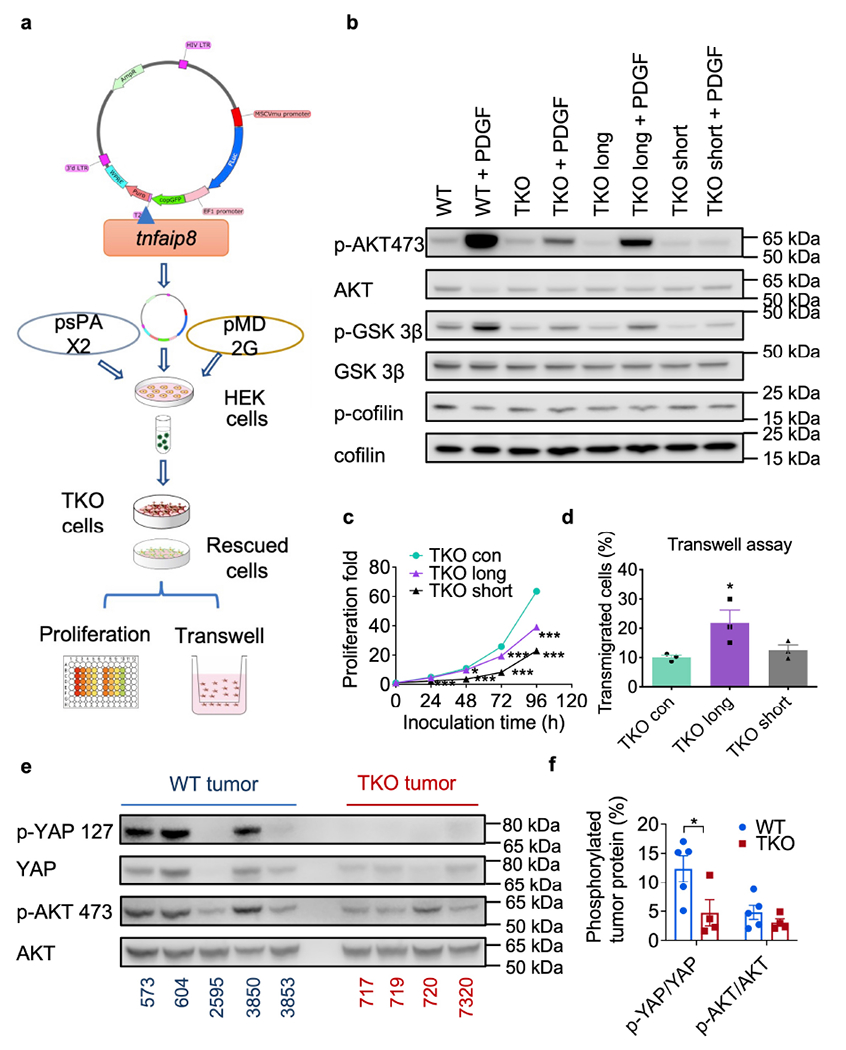
a, Schematics of the experimental design of TNFAIP8 rescue experiment.
b, AKT, GSK-3β and cofilin protein expression in WT3850, TKO 717, TKO 717 cells expressing long or short TNFAIP8, cultured with or without PDGF for 20 min as determined by Western blot. representative of 2 experiments
c, In vitro cell proliferation of TKO 717 and rescued TKO 717 cells for the indicated times as determined by cell titer glo assay, representative of 3 experiments, p=0.0223 for TKO long at 48 h, p=0.0006 for TKO long at 72h, and p<0.0001 for all others compared to TKO con at indicated time point.
d, In vitro transmigration of TKO 717 and rescued TKO 717 cells with or without PDGF stimulation for 16 h as determined by the transwell assay, representative of 3 experiments.
e,f, AKT and YAP protein expression in lysates of WT ( n=5) and TKO (n=4) tumors as determined by Western blot (e) and its quantification (f, p=0.0491). Representative of 2 experiments.
For all graphs, *p < 0.05; ***p < 0.001 vs parental TKO cells; data are presented as mean ± SEM. Statistical significance was determined by two-tailed unpaired t-test.
Loss of polarization in TNFAIP8-deficient tumor cells
To examine how TNFAIP8 controls tumor cell migration, we studied the polarization of tumor cells in response to point-source chemoattractant stimulation. To visualize polarization, we stained cells for Rac1-GTP (the active form of Rac1) or AKT phosphorylation at Ser473 (p-AKT 473). Without stimulation, cell polarization and Rac1-GTP and p-AKT signals were similar between WT and TKO cells (Fig. 7a and b, 0 min). By contrast, after PDGF stimulation, WT cells showed more Rac1 polarization and higher Rac1-GTP and p-AKT473 signals than TKO cells (Fig.7a–c).
Fig. 7. Visualization of Rac1-GTP and pAKT473 signaling, and a working model.
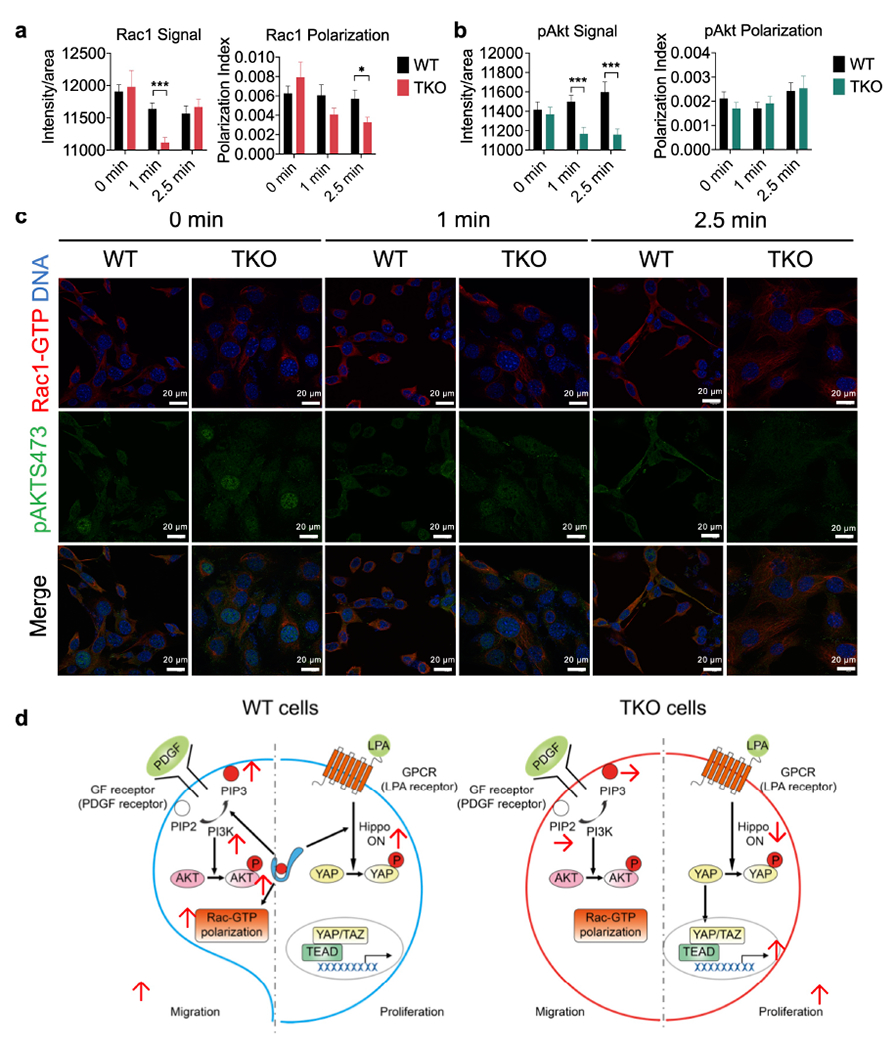
a-c, Rac1-GTP (a, p=0.00002 for Rac Signal, p=0.02277 for Rac polarization) and pAKT473 (b, p=0.000453 and 0.0007 for pAkt Signal at 1 and 2.5 min) polarization and activation in pooled five WT (573, 604, 2595, 3850 and 3853) and four TKO (717, 719, 720 and 7320) fibrosarcoma cells stimulated with PDGF (1 μg/ml) for the indicated amounts of times as determined by confocal microscopy. Results are pooled from 3 independent experiments, with ≥17 cells/condition analyzed per experiment. Total N per condition ≥67. Scale bars = 20 μm. *p < 0.05; ***p < 0.001 vs WT; data are presented as mean ± SEM. Statistical significance was determined by two-tailed unpaired t-test.
d, A working model for the paradoxical function of TNFAIP8 in tumor cell proliferation and migration. In migrating cells, TNFAIP8 sensitizes cells to PDGF stimulation to generate more PIP3 (through lipid transfer) and more Rac1-GTP polarization, promoting cell migration. By contrast, in proliferating cells, TNFAIP8 controls hippo activation and decreases YAP nucleus translocation, reducing the rate of cell proliferation.
Discussion
Based on our results, we propose a model where TNFAIP8 serves as a signaling toggle in tumor cells, to direct tumor migration while negatively controlling tumor cell proliferation (Fig. 7d). With PDGF stimulation (which tests cell migration), WT cells generate more PIP3 with the help of TNFAIP8, which leads to enhancement of AKT phosphorylation, and downstream phosphorylation and inactivation of YAP[26], as well as proper Rac1 polarization. This results in migratory capacity with inhibition of proliferation. In contrast, TKO cells lack the ability to migrate, due to defect in PIP3 signaling. On the other hand, LPA stimulation (which stimulates cellular proliferation) in WT cells results in decreased YAP nuclear translocation and cellular proliferation. In contrast, TKO cells lack the ability to engage with the inhibitory Hippo signaling and showed enhanced cellular proliferation. Thus, in this model, TNFAIP8 serves as a toggle to allow cancer cells to switch between proliferative and migratory states.
Interestingly, our data suggests a surprising tumor suppressor role of “oncogene” [27, 28] TNFAIP8. In contrast, several previous publications demonstrated that TNFAIP8 could be an oncogene[29, 30], promoting tumor proliferation, and inhibition of TNFAIP8 delayed tumor proliferation. One of the possible explanations is that most of these publications that reported a pro-tumor role of TNFAIP8 in malignancies of epithelial tissue, whereas we studied mouse fibrosarcoma cells (fibroblast type). The embryonic origins are different and one feature of fibrosarcoma is their ability to drive myogenesis. PI3K/AKT signaling affects myogenesis through control of Cyclin D1 expression and regulation of chromatin remodeling[31]. AKT phosphorylates YAP at serine 127, leading to YAP binding to 14-3-3. Phosphorylation of YAP at Ser127[26] leads to gene expression changes related to myogenesis and cell cycle[32]. Myogenesis genes are the most upregulated genes in TKO fibrosarcoma cells by RNAseq and the cell cycle gene Cyclin D1 RNA is 3-fold higher in TKO cells as compared to WT cells. Thus, TNFAIP8 may work differently based on the cell context. The other possible reason we see differences from previous publications is that we are using gene KO cell lines induced by MCA in TKO mice, while other publications used siRNA[29] [33, 34] in vitro and/or shRNA to explore the mechanism, which are not total loss of function approaches.
In summary, we discovered that TNFAIP8 serves as a toggle switch for tumor proliferation and migration. TNFAIP8 serves as a central switch in tumor development, and it is not a simple oncogene as previously reported, but rather more complexly regulates different pathways based on the cell type being studied, with accordingly varied downstream effects. This novel surprising tumor suppressor role of TNFAIP8 in tumor proliferation would need to be considered when targeting TNFAIP8 for treating cancer metastasis.
Materials and Methods
Clinical Sample Analysis
Clinical data was obtained and analyzed using tools from the GEPIA2 database. Overall survival with custom cutoff (75:25) were set. TNFAIP8 expression level with cancer stage was plotted in Expression DIY/Stage plot, all cancer types from website were selected.
Mice
Tnfaip8−/− (TKO) mice were generated as previously described[35]. Mice were housed in pathogen-free environment and all animal procedures were pre-approved by the Institutional Animal Care and Use Committee of the University of Pennsylvania.
Tumor models
To induce liver and skin tumors, carcinogen DEN (diethylnitrosamine, Sigma-Aldrich, St. Louis, MO) and MCA (3-methylcholanthrene, Sigma-Aldrich, St. Louis, MO) were used, respectively. For liver tumor initiation, aged 12-16 days-old, gender-matched WT/TKO mice were inoculated intraperitoneally with 25 mg/kg DEN[36, 37]. After nine months induction, mice were euthanized and tumor number were counted as less than 2 mm, between 2-5 mm and larger than 5 mm. For skin tumor initiation, groups of aged 8-12 weeks-old, gender-matched WT/TKO mice were inoculated subcutaneously with 400 μg of MCA[38, 39]. Mice were monitored and tumor volume was calculated: π(width2 × length)/6.
For the subcutaneous tumor model, 1 million fibrosarcoma cell lines were injected subcutaneously, tumor size was measured in a blinded-manner. Tumor volume was calculated (large diameter × (small diameter)2/2). In experimental metastasis model, half million cells were suspended in 200 μl PBS and intravenously injected in the tail vein. Three weeks later, tumor nodules number and lung/body weight were counted and measured in a blinded-manner.
Cell culture
Fibrosarcoma cell lines were obtained from MCA-induced tumors. Tumor samples were finely minced and enzymatically digested with collagenase P (1.0 mg/ml, Roche) at 37°C for 15 min with rapid shaking. Then tumor samples were thoroughly washed and cultured in Dulbecco’s Modified Eagle Medium (DMEM, Gibco, Gaithersburg, MD) supplemented with 15% heat-inactivated fetal bovine serum (HyClone) plus penicillin and streptomycin (Gibco). Fibrosarcoma cell lines and HEK293 T cells were maintained in DMEM medium with 10% fetal bovine serum (FBS). Unless otherwise specified, cells were seeded overnight, starved with plain DMEM for 16 h and stimulated with PDGF (50 ng/ml, Peprotech, Rocky Hill, NJ) for 20 min or LPA (20 μM, Sigma) for 1 h.
Cell proliferation, morphology, adhesion and colony formation assays
For cell proliferation assays, equal number of cells were seeded in 96-well plates and cell viability was detected by Cell Titer Glo (CTG, Promega, Madison, WI). Cell adhesion was measured by CTG after cell attachment. Cells were seeded in with/without fibronectin coated plates and incubated for 60 min. Supernant and unattached cells were then decanted. CTG was then performed on the remaining adherent cells. Adherence was calculated as the number attached cells divided by the seeding cell number. For cell morphology, cells were stained with crystal violet, fixed with 4% PFA and analyzed by light microscope. For colony formation assay, cells were seeded, then stained with crystal violet and finally counted.
Transmigration assay
The transmigration assay was performed using Transwell inserts (CLS3464, Corning, NY) in 24-well plates. Inserts were coated with 10 μg/ml of fibronectin overnight at 4 °C. Cells were trypsinized and seeded in plain DMEM medium on the top layer. Then the cell media with stimulus PDGF/LPA was added to the lower chamber. After 16 h culture at 37 °C, inserts were washed in PBS and stained with crystal violet to take pictures or cells were digested/counted. The results were quantified as transmigrated cells (%), which is equal to the number of migrated cells divided by their starting number.
Ibidi μ-slide migration assay
To determine the migration directionality and speed, cells were tested in the Ibidi μ-slide migration assay (Ibidi, Madison, WI)[15, 40]. Briefly, cells were loaded in fibronectin-coated slide for 90-120 min at 37 °C, PDGF was added to one of the reservoirs to a concentration of 500 ng/ml. Cells were recorded by Leica DMI4000 microscope with Yokogawa CSU-X1 spinning disk confocal at 10 × magnification. Images were analyzed by Volocity software (Perkin Elmer, Waltham, MA). Cell directionality (Directional Meandering Index, DMI) was identified as the sine of the bearing angle or the cosine of the migration angle. A value of −1 represents migration away from the chemoattractant, while a value of 1 represents migration directly towards the chemoattractant.
RNA isolation and RT-PCR
RNA was extracted with the RNeasy Mini Kit (Qiagen, Valencia, CA). Reverse transcription was performed with reverse transcription kit (Applied Biosystems, Foster City, CA). Real-time PCRwas carried out using the Fast SYBR Green PCR Master Mix (Applied Biosystems). Relative fold changes were determined using the ΔΔCT calculation method with 18 s ribosomal RNA as internal control. Primers information was listed in Extended Table 2.
RNAseq and bioinformatics analysis
Pool cells were equally pooled from individual 5 WT and 4 TKO fibrosarcoma cell lines, seeded in 6 well plate with plain DMEM starvation for 16 h, then stimulated with PDGF or LPA. Total RNA was extracted and sent to BGI (Shenzhen, China). The procedures were similar as we used before[41]. Pathway analysis was performed using ClueGo and GSEA (http://software.broadinstitute.org/gsea/index.jsp).
Electroporation, phospholipid membrane co-localization staining
The PtdIns (4,5) P2 and PtdIns (3,4,5) P3 in live cells were visualized using EGFP-tagged PLCD-PH domain and AKT-PH domain (Addgene, Watertown, MA), respectively. Briefly, two million cells were resuspended in 100 μl of 1SM electroporation buffer (KCl 5 mM, MgCl2 15 mM, Na2HPO4/NaH2PO4, Ph7.2, based, 0.2 M 120 mM, Sodium Succinate 25 mM, Manitol 25 mM). Cells were electroporated with 2 μg plasmid DNA in certified cuvette using by Amaxa Nucleofector II (program L005, Lonza). After 24-hour culture, live cells were starved with plain DMEM for 2 hours and stimulated with 50 ng/ml PDGF for 20 min and fixed with 1% PFA for 10 min. Cells were stained with Wheat Germ Agglutinin CF640R (1:1000 dilution, Biotium, Fremont, CA) and mounted. Confocal images were obtained with a Leica TC8 SP8 Confocal (Leica Microsystems, Buffalo Grove, IL). Co-localization was analyzed as described previously[42].
Lipid extraction and PIP2/PIP3 mass ELISA
To extract lipid, cells were seeded, starved and stimulated with PDGF (50 ng/ml) for 20 min. Then cells were detached with 0.5 M Trichloroacetic Acid (TCA, Millipore Sigma, Burlington, MA). Pellet was resuspended with 5% TCA/1mM EDTA, following by MeOH: CHCL3(2:1), MeOH:CHCl3:12N HCl (80:40:1) and CHCl3/0.1 N HCL extractions. PIP lipids were obtained from organic phase. The protein levels of samples were also quantified by Pierce™ BCA Protein Assay Kit (Thermo Fisher, 23225). PIP2 and PIP3 Mass ELISA (Echelon) was performed per the manufacturer’s protocol. Values were normalized to the protein levels.
Immunofluorescence microscopy of YAP/TAZ localization, polarization of Rac-GTP
After treatment, cells were fixed with 4% PFA, permeabilized with 0.1 % Triton X, blocked with 5% BSA, and incubated with primary antibodies (YAP, 1:100; CST, MA, USA) and secondary antibody Alexa Fluor 488 (Invitrogen, 1:1000 dilution). Samples were mounted using anti-fade media containing DAPI (Vector Laboratories, H-1500) and immunofluorescence was detected using fluorescence microscopy Echo Revolve (Echo, San Diego, CA). Cells in five randomly views (more than100 cells) were selected for the quantification of YAP/TAZ localization as described previously[43].
For Rac and Akt polarization and activation, after 16 h starvation, cells were treated with point-source PDGF at 1 μg/ml, immediately fixed with 4% PFA and permeablization with 0.25% Triton X. Cells were stained overnight with anti-Rac1-GTP (NB-26903, NewEast Biosciences, King of Prussia, PA) and anti-p-AKT 473 (4060, CST). The cells were stained with secondary anti-rabbit IgG Fab-Alexa Fluor 555, or anti-mouse IgM Fab-Alexa Fluor 488 (Thermo Fisher). DNA was stained with DAPI and the coverslips were mounted using Flouromount-G. Signal intensity was calculated dividing the total intensity (IntDens) by the area of the image, for each channel. Images were analyzed using ImageJ (v1.52, NIH, Bethesda MD) as previously[40].
Plasmid construction, lentivirus infection and TNFAIP8 rescue cell generation
MSCV-Luciferase-EF1α-copGFP-T2A-Puro Lentivector plasmid was purchased from System Biosciences (BLIV713PA-1). We cloned two isoforms of TNFAIP8 (Extended Data Fig. 6 and 7). TNFAIP8 long or short sequence was inserted into T2A site. To generate lentivirus, HEK 293T cells were transfected with lentiviral packaging plasmids (psPAX2 and pMD2G) and above lentivector constructs using Lipofectamine 2000. In Lentivirus infection, TransDux MAX (LV860A-1, SBI) was used for lentivirus transduction for 24 h and cells were cultured with medium containing the 2 μg/ml puromycin. Cells were then sorted by GFP signal, stored and used for rescue experiments.
Western blot
Briefly, 30-40 μg of cell lysates were run on 4-12% gradient SDS-PAGE gels. Blocked PVDF membranes were probed overnight with primary antibody in 1% non-fat milk (1:1000 if not specified). After incubation, membranes were washed with 0.1% TBS-Tween (TBST) solution and incubated with the appropriate HRP-conjugated secondary antibody at 1:3000 dilution (GE Healthcare, Marlborough, MA). Membranes were exposed with Pico or Femto ECL reagent (Thermo Fisher) and analyzed by LiCor Odyssey imaging system (Li-cor, Lincoln, NE).
Flow-cytometry analysis of p-AKT(T308) cellular content
Cells were starved with HBSS and treated with PDGF (100 ng/ml) for 0, 1 and 5 min. Cells were then fixed and permeabilized in pre-warmed Cytofix/Cytoperm (51-2090KZ, BD, San Jose, CA) for 10 minutes at 37 °C. Cells were washed by Perm/Wash Buffer (51-2091KZ, BD) stained with p-AKT308 (13038S, CST) and secondary antibody Alexa Fluor 488 (A-11070, Thermo Fisher).
Quantification and statistical analysis
Statistical analyses were performed using Prism 9 software and all data are presented as mean ± SEM with P < 0.05 considered as significant. For comparisons between two groups, a two-tailed Student’s t-test was used. In figures, asterisks were used as follows: *p < 0.05; **p < 0.01, ***p <0.001.
Data availability
RNA-seq data that support the findings of this study have been deposited in the ArrayExpress under accession nos. E-MTAB-10468.
Extended Data
Extended Data Fig. 1. Relationship between TNFAIP8 mRNA expression and human cancer patient survival.
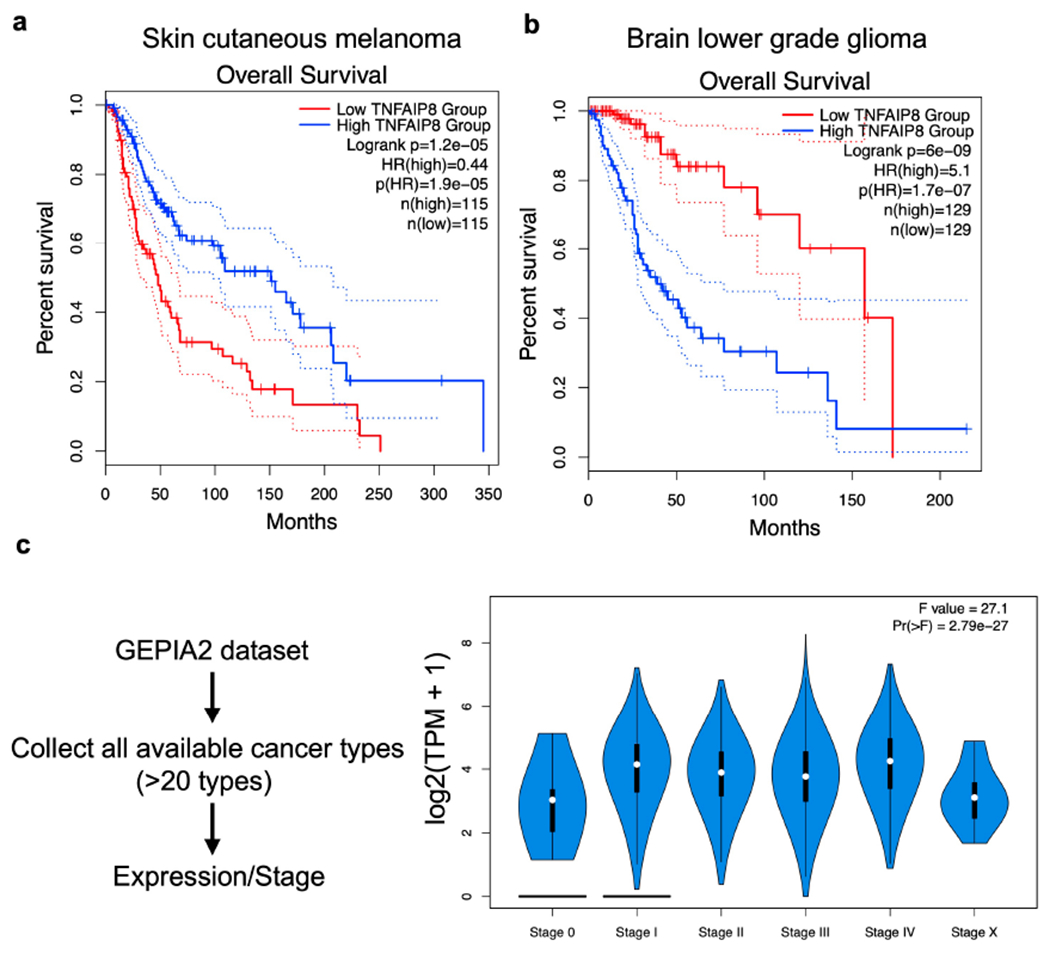
related to Fig. 1.
a,b, Survival curves of patients with cutaneous melanoma (a) and brain lower grade glioma (b).
c, TNFAIP8 expression during different stages of more than 20 cancers. Data is obtained from the GEPIA2 cancer database (http://gepia2.cancer-pku.cn/#index).
Extended Data Fig. 2. Liver and skin tumor generated after DEN or MCA treatment.
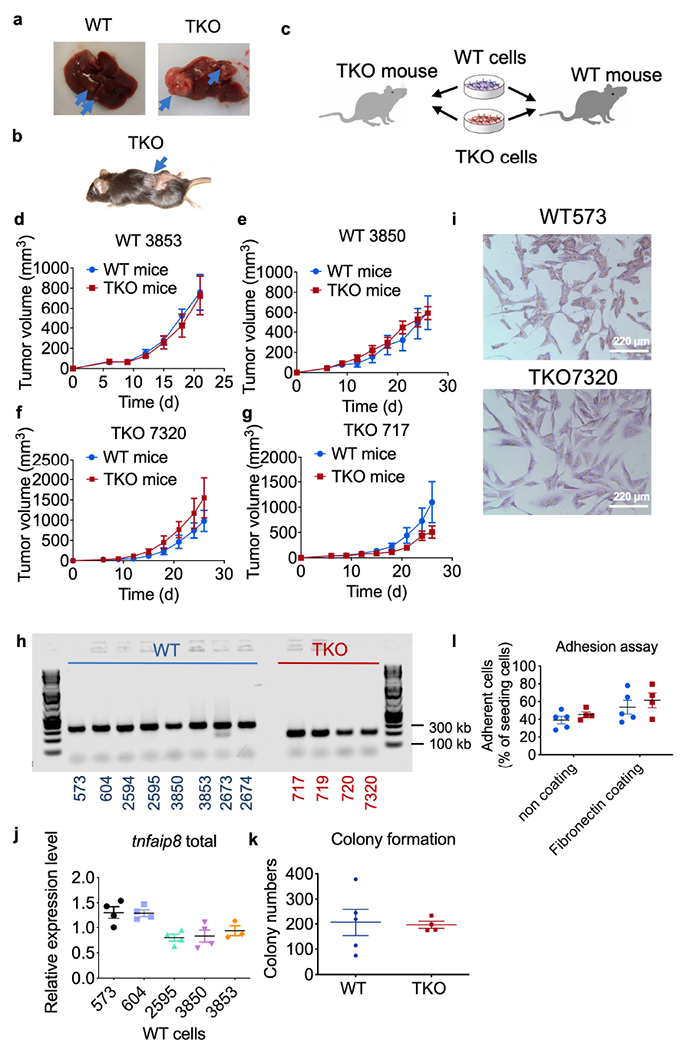
related to Fig. 1.
a,b, Representative tumors developed in the liver (a) and skin (b). The blue arrows pointed to tumors.
c, Schematics of experimental design of tumor inoculation on WT and TKO mice.
d-g, Tumor growth in WT and TKO mice that were injected s.c. with WT (d, e, n=2 WT cell lines) and TKO fibrosarcoma cells (e, f, n=2 TKO cell lines). N=4-5 mice for each cell line. Representative of 2 independent experiments.
h, PCR genotyping results of WT and TKO mice. Representative of 2 independent experiments.
i, Morphology of WT and TKO fibrosarcoma cells stained with crystal violet. Scale bar=220 μm.
j, Relative mRNA levels of tnfaip8 expression in WT fibrosarcoma cells. Representative of 2 independent experiments.
k,l, Colony formation (k) and adhesion abilities (l) of five WT (573, 604, 2595, 3850 and 3853) and four TKO (717, 719, 720 and 7320) fibrosarcoma cell lines. Representative of 3 (l) or 4 (k) independent experiments.
Extended Data Fig. 3. Tumor cell transmigration towards LPA.
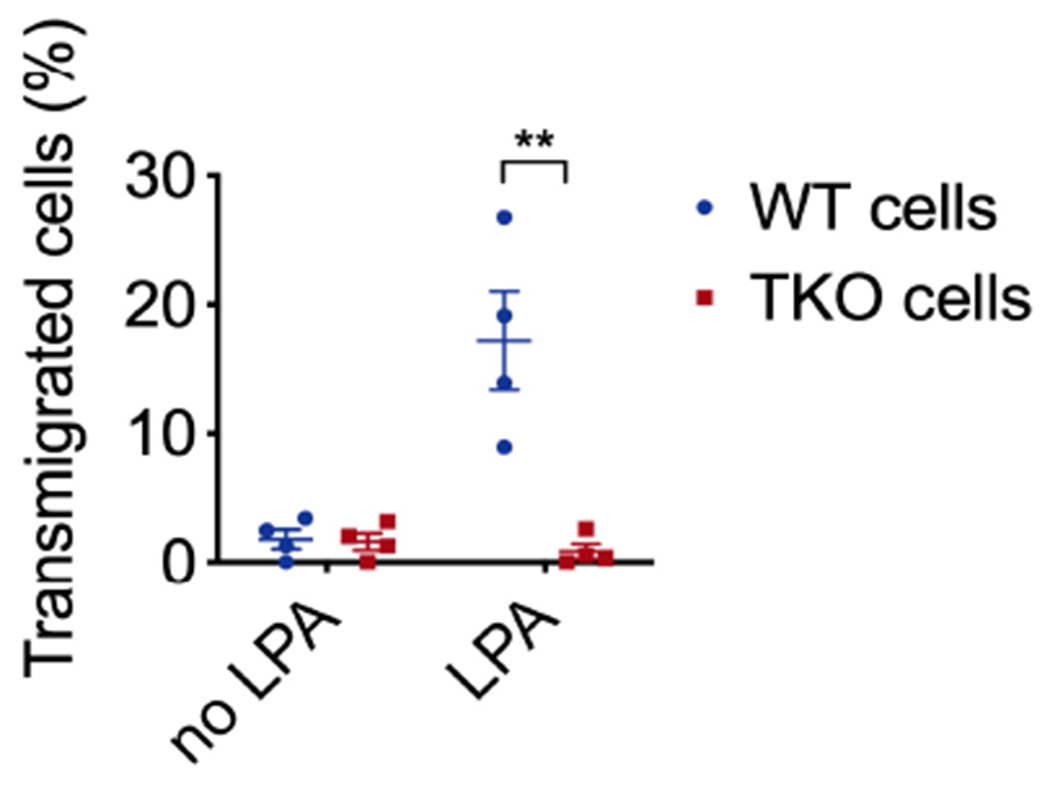
related to Fig. 2
Tumor cells were pooled from five WT (573, 604, 2595, 3850 and 3853) and four TKO (717, 719, 720 and 7320) lines, and treated with or without LPA (20 μM) for 16 h in the Boyden migration chamber. Representative of 4 independent experiments is shown. p=0.0055.
Data are presented as mean ± SEM. Statistical significance was determined by two-tailed unpaired t-test. **p<0.01.
Extended Data Fig. 4. Constitutive levels of protein expression in tumor cells.
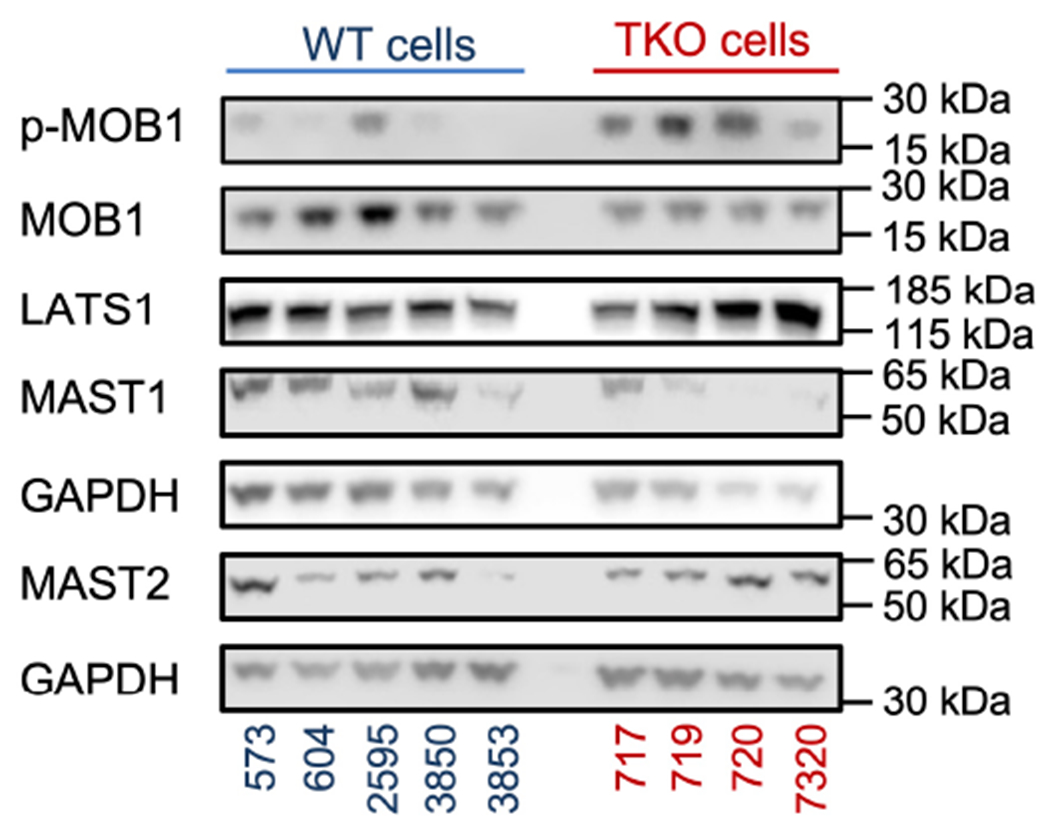
related to Fig. 4.
Key proteins of the hippo pathway in five WT (573, 604, 2595, 3850 and 3853) and four TKO (717, 719, 720 and 7320) fibrosarcoma cells under normal culture conditions as determined by Western blot. Representative of 3 independent experiments.
Extended Data Fig. 5. Cell proliferation with LPA stimulation by CTG assay.
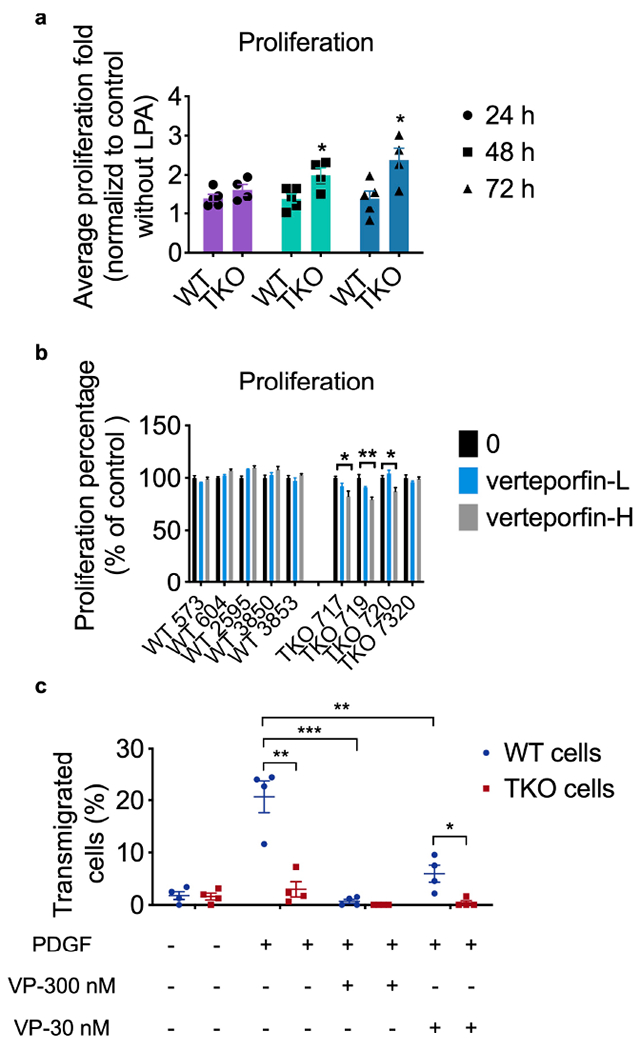
a, In vitro cell proliferation of five WT (573, 604, 2595, 3850 and 3853) and four TKO (717, 719, 720 and 7320) cell lines for the indicated times under normal cell culture condition as determined by cell titer glo assay, representative of 3 experiments, with p=0.0276 for 48 h, p=0.025 for 72 h.
b, In vitro cell proliferation of five WT and four TKO cell lines with or without high dose (312.5 nM) or low dose (78.125 nM) VP treatment for 72 h, representative of 3 experiments with p=0.0261 for TKO 717, p=0.0069 for TKO 719.
c, Tumor cells were pooled from five WT (573, 604, 2595, 3850 and 3853) and four TKO (717, 719, 720 and 7320) lines, and treated with or without PDGF (500 ng/μl), high dose (300 nM) or low dose (30 nM) Verteporfin for 16 h in the Boyden migration chamber. Representative of 4 independent experiments is shown. p=0.0019 for WT and TKO under PDGF stimulation only, p=0.0161 for WT and TKO plus VP 30 nM under PDGF stimulation, p=0.0006 for WT and WT plus VP 300 nM under PDGF stimulation, p=0.0053 for WT and WT plus VP30 nM under PDGF stimulation.
*p < 0.05, **p < 0.01, ***p < 0.001; data are presented as mean ± SEM. Statistical significance was determined by two-tailed unpaired t-test.
Extended Data Fig. 6. Effect of Yap inhibitor Verteporfin (VP) on YAP and AKT expression and activation.
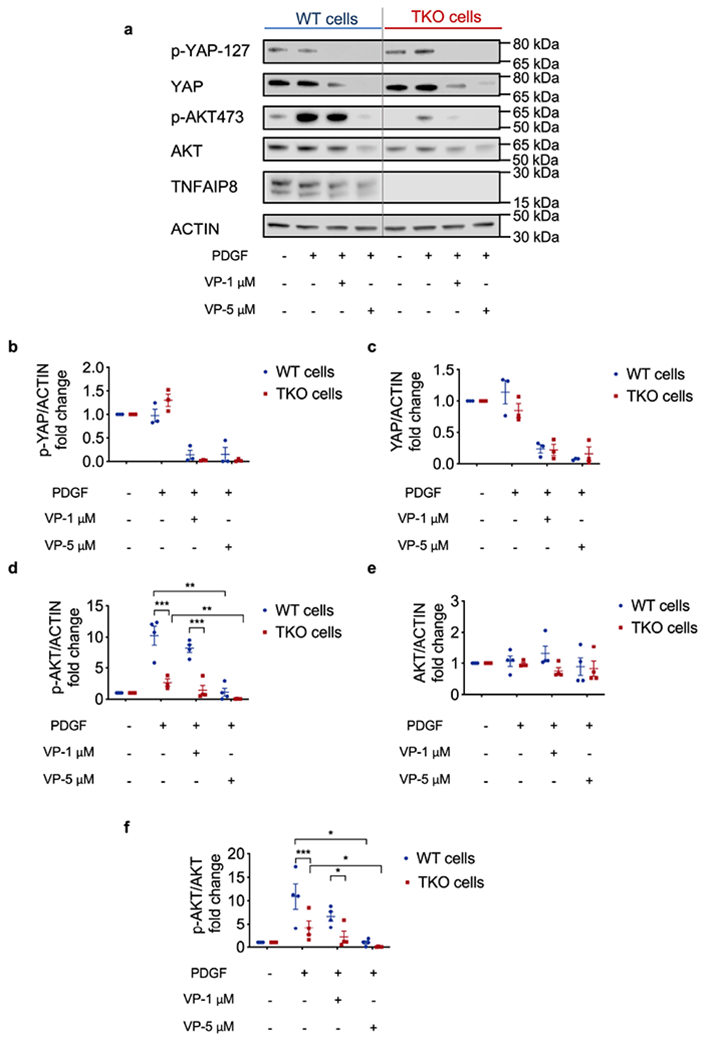
a, Protein expression in WT (pooled 573, 604, 2595, 3850 and 3853) and TKO (pooled 717, 719, 720, 7320) fibrosarcoma cells, treated with or without PDGF (500 ng/μl), high dose (5 μM) or low dose (1 μM) Verteporfin for 8 h. Representative of 3 or 4 independent experiments.
b,c, Quantification of p-YAP 127 (b) and YAP/ACTIN (c).
d-f, Quantification of p-AKT473 (d), AKT/ACTIN (e) and p-AKT473/AKT (f). In d, p<0.000001 for WT and TKO under PDGF stimulation only, p<0.000001 for WT and TKO plus VP 1 μM under PDGF stimulation, p=0.0014 for WT and WT plus VP 5 μM under PDGF stimulation, p=0.0036 for TKO and TKO plus VP 5 μM under PDGF stimulation. In f, p=0.000829 for WT and TKO under PDGF stimulation only, p<0.016803 for WT and TKO plus VP 1 μM under PDGF stimulation, p=0.0108 for WT and WT plus VP 5 μM under PDGF stimulation, p=0.0356 for TKO and TKO plus VP 5 μM under PDGF stimulation.
*p < 0.05, **p < 0.01, ***p < 0.001; data are presented as mean ± SEM. Statistical significance was determined by multiple t- test or two-tailed unpaired t-test.
Extended Data Fig. 7. Confirmation of TNFAIP8 rescue in TKO cells.
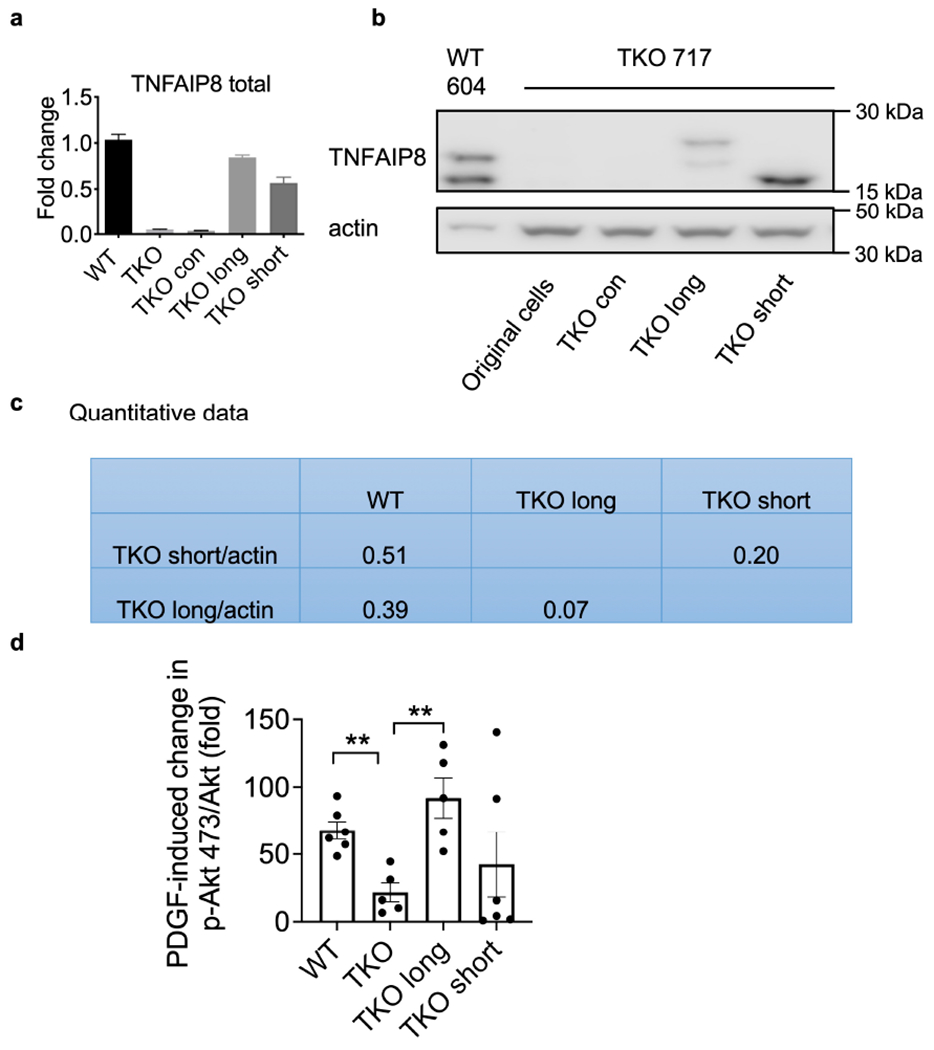
related to Fig. 6.
a, Relative mRNA levels of tnfaip8 in WT (average level of 5 WT cell lines), parental TKO 717 cells and long and short TNFAIP8 rescued cells as determined by qPCR. Tnfaip8 expression level was normalized to the WT average. Representative of 2 independent experiments.
b,c, TNFAIP8 protein in WT 604 cells, parental TKO 717 cells, and long and short TNFAIP8 rescued cells under normal culture condition as determined by Western blot (b), and the quantified data (c). Representative of 2 independent experiments.
d, Quantification of fold change of p-AKT473 protein expression after PDGF stimulation in WT3850, TKO 717, TKO 717 cells expressing long or short TNFAIP8 as determined by Western blot. Representative of 5-6 experiments. **p < 0.01 vs parental TKO cells; data are presented as mean ± SEM. Statistical significance was determined by two-tailed unpaired t-test.
Extended Data Fig. 8. TNFAIP8 isoform information.
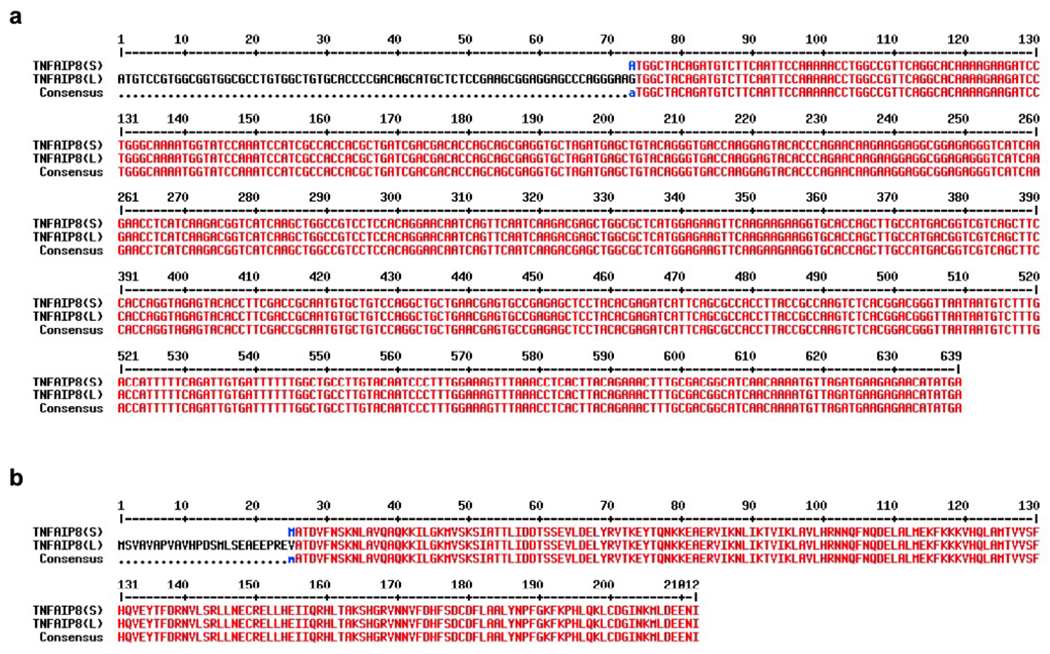
related to Fig. 6. and Extended Data Fig. 6
a, cDNA sequence alignments of mouse TNFAIP8 transcript variants are presented (S stand for short isoform (NM_001177759) and L stand for long isoform (NM_134131)). The consensus region is shown in red color.
b, Amino acid sequence alignments of mouse TNFAIP8 short (s) and long (L) protein isoforms. The conserved motif is shown in red color and the N-terminal region of TNFAIP8 (L) is shown in black color. (MultAlin program was used for multiple sequence alignment; https://multalin.toulouse.inra.fr/multalin/cgi-bin/multalin.pl#Alignment).
Extended Table 1.
Normalized fold change of Hippo related gene expression after treatment
| WT | WT LPA | WT PDGF | TKO | TKO LPA | TKO PDGF | |
|---|---|---|---|---|---|---|
| CENPF | 1 | 0.607 | 0.637 | 1.243 | 0.830 | 1.351 |
| DUSP1 | 1 | 2.270 | 2.877 | 1.844 | 4.839 | 3.531 |
| MDFIC | 1 | 1.132 | 1.149 | 1.935 | 1.982 | 1.813 |
| DLC1 | 1 | 1.932 | 1.046 | 1.724 | 3.454 | 1.855 |
| CRIM1 | 1 | 1.136 | 1.030 | 1.762 | 2.029 | 1.850 |
| TGFB2 | 1 | 1.034 | 0.985 | 1.844 | 2.643 | 2.283 |
| GGH | 1 | 1.196 | 1.026 | 1.927 | 2.193 | 2.242 |
| TNNT2 | 1 | 0.672 | 0.797 | 1.492 | 1.169 | 1.419 |
| SDPR | 1 | 1.442 | 1.194 | 4.696 | 4.989 | 4.807 |
| ANKRD1 | 1 | 2.843 | 1.179 | 8.346 | 23.109 | 8.598 |
| GAS6 | 1 | 1.268 | 1.166 | 8.797 | 7.088 | 7.570 |
Extended Table 2.
Primers for qPCR
| Gene name | Forward (5’-3’) | Reverse (5’-3’) |
|---|---|---|
|
| ||
| 18s | GTAACCCGTTGAACCCCATT | CCATCCAATCGGTAGTAGCG |
| Ankrd1 | TGCGATGAGTATAAACGGACG | GTGGATTCAAGCATATCTCGGAA |
| Ctgf | GTGCCAGAACGCACACTG | CCC CGG TTA CAC TCC AAA |
| Myod1 | AAGACGACTCTCACGGCTTG | GCAGGTCTGGTGAGTCGAAA |
| Myog | GAGGAAGTCTGTGTCGGTGG | CCACGATGGACGTAAGGGAG |
Significance:
Cellular pilot protein TNFAIP8 differently regulates tumor cell proliferation and migration. It suggests that tumor cell metastasis and proliferation need to be targeted separately to cure cancer.
Acknowledgements:
We thank Drs. Warren Pear, Martha Jordan and T.S. Karin Eisinger for scientific inputs. We would like to thank Drs. Chin-Nien Lee, Mei Lin, Lei Guan, Ling Lu, Xu Chen, Lianxiang Luo and Shifeng Li, for valuable suggestions and technical supports. We are grateful to Dr. Daniel P. Beiting and Gordon Ruthel from Penn Vet Imaging Core for technical assistance.
This work was supported in part by grants from the National Institutes of Health (NIH), USA (R01AI143676 and R01AI1136945).
Footnotes
Competing Interests: YHC is a member of the advisory board of Amshenn Co. and Binde Co. All other authors declare no competing interests.
Conflict of Interest: YHC is a member of the advisory board of Amshenn Co., and Binde Co.
Current address for Li Zhang: Department of Clinical Laboratory Medicine, The First Affiliated Hospital of Shandong First Medical University & Shandong Provincial Qianfoshan Hospital, Jinan, Shandong, China.
Reference
- 1.Leung H-W, Wang Z, Yue GG-L, Zhao S-M, Lee JK-M, Fung K-P et al. Cyclopeptide RA-V inhibits cell adhesion and invasion in both estrogen receptor positive and negative breast cancer cells via PI3K/AKT and NF-;κB signaling pathways. Biochimica et Biophysica Acta (BBA) - Molecular Cell Research 2015; 1853: 1827–1840. [DOI] [PubMed] [Google Scholar]
- 2.Massague J, Obenauf AC. Metastatic colonization by circulating tumour cells. Nature 2016; 529: 298–306. [DOI] [PMC free article] [PubMed] [Google Scholar]
- 3.Svensson S, Nilsson K, Ringberg A, Landberg G. Invade or proliferate? Two contrasting events in malignant behavior governed by p16(INK4a) and an intact Rb pathway illustrated by a model system of basal cell carcinoma. Cancer Res 2003; 63: 1737–1742. [PubMed] [Google Scholar]
- 4.Kohrman AQ, Matus DQ. Divide or Conquer: Cell Cycle Regulation of Invasive Behavior. Trends Cell Biol 2017; 27: 12–25. [DOI] [PMC free article] [PubMed] [Google Scholar]
- 5.Sun H, Gong S, Carmody RJ, Hilliard A, Li L, Sun J et al. TIPE2, a negative regulator of innate and adaptive immunity that maintains immune homeostasis. Cell 2008; 133: 415–426. [DOI] [PMC free article] [PubMed] [Google Scholar]
- 6.Goldsmith JR, Fayngerts S, Chen YH. Regulation of inflammation and tumorigenesis by the TIPE family of phospholipid transfer proteins. Cell Mol Immunol 2017; 14: 482–487. [DOI] [PMC free article] [PubMed] [Google Scholar]
- 7.Kumar D, Gokhale P, Broustas C, Chakravarty D, Ahmad I, Kasid U. Expression of SCC-S2, an antiapoptotic molecule, correlates with enhanced proliferation and tumorigenicity of MDA-MB 435 cells. Oncogene 2004; 23: 612–616. [DOI] [PubMed] [Google Scholar]
- 8.Liu T, Gao H, Chen X, Lou G, Gu L, Yang M et al. TNFAIP8 as a predictor of metastasis and a novel prognostic biomarker in patients with epithelial ovarian cancer. Br J Cancer 2013; 109: 1685–1692. [DOI] [PMC free article] [PubMed] [Google Scholar]
- 9.Yang M, Zhao Q, Wang X, Liu T, Yao G, Lou C et al. TNFAIP8 overexpression is associated with lymph node metastasis and poor prognosis in intestinal-type gastric adenocarcinoma. Histopathology 2014; 65: 517–526. [DOI] [PubMed] [Google Scholar]
- 10.Hadisaputri YE, Miyazaki T, Suzuki S, Yokobori T, Kobayashi T, Tanaka N et al. TNFAIP8 overexpression: clinical relevance to esophageal squamous cell carcinoma. Ann Surg Oncol 2012; 19 Suppl 3: S589–596. [DOI] [PubMed] [Google Scholar]
- 11.Zhang Y, Wang MY, He J, Wang JC, Yang YJ, Jin L et al. Tumor necrosis factor-alpha induced protein 8 polymorphism and risk of non-Hodgkin’s lymphoma in a Chinese population: a case-control study. PLoS One 2012; 7: e37846. [DOI] [PMC free article] [PubMed] [Google Scholar]
- 12.Padmavathi G, Banik K, Monisha J, Bordoloi D, Shabnam B, Arfuso F et al. Novel tumor necrosis factor-alpha induced protein eight (TNFAIP8/TIPE) family: Functions and downstream targets involved in cancer progression. Cancer Lett 2018; 432: 260–271. [DOI] [PubMed] [Google Scholar]
- 13.Colicelli J Human RAS superfamily proteins and related GTPases. Sci STKE 2004; 2004: RE13. [DOI] [PMC free article] [PubMed] [Google Scholar]
- 14.Wang Z, Fayngerts S, Wang P, Sun H, Johnson DS, Ruan Q et al. TIPE2 protein serves as a negative regulator of phagocytosis and oxidative burst during infection. Proc Natl Acad Sci U S A 2012; 109: 15413–15418. [DOI] [PMC free article] [PubMed] [Google Scholar]
- 15.Fayngerts SA, Wang Z, Zamani A, Sun H, Boggs AE, Porturas TP et al. Direction of leukocyte polarization and migration by the phosphoinositide-transfer protein TIPE2. Nat Immunol 2017; 18: 1353–1360. [DOI] [PMC free article] [PubMed] [Google Scholar]
- 16.Zhao B, Lei QY, Guan KL. The Hippo-YAP pathway: new connections between regulation of organ size and cancer. Curr Opin Cell Biol 2008; 20: 638–646. [DOI] [PMC free article] [PubMed] [Google Scholar]
- 17.Kango-Singh M, Singh A. Regulation of organ size: insights from the Drosophila Hippo signaling pathway. Dev Dyn 2009; 238: 1627–1637. [DOI] [PubMed] [Google Scholar]
- 18.Yu FX, Zhao B, Panupinthu N, Jewell JL, Lian I, Wang LH et al. Regulation of the Hippo-YAP pathway by G-protein-coupled receptor signaling. Cell 2012; 150: 780–791. [DOI] [PMC free article] [PubMed] [Google Scholar]
- 19.Zhao B, Li L, Lei Q, Guan KL. The Hippo-YAP pathway in organ size control and tumorigenesis: an updated version. Genes Dev 2010; 24: 862–874. [DOI] [PMC free article] [PubMed] [Google Scholar]
- 20.Miller E, Yang J, DeRan M, Wu C, Su AI, Bonamy GM et al. Identification of serum-derived sphingosine-1-phosphate as a small molecule regulator of YAP. Chem Biol 2012; 19: 955–962. [DOI] [PubMed] [Google Scholar]
- 21.Wettschureck N, Offermanns S. Mammalian G proteins and their cell type specific functions. Physiol Rev 2005; 85: 1159–1204. [DOI] [PubMed] [Google Scholar]
- 22.Laliberte B, Wilson AM, Nafisi H, Mao H, Zhou YY, Daigle M et al. TNFAIP8: a new effector for Galpha(i) coupling to reduce cell death and induce cell transformation. J Cell Physiol 2010; 225: 865–874. [DOI] [PMC free article] [PubMed] [Google Scholar]
- 23.Tang Z, Kang B, Li C, Chen T, Zhang Z. GEPIA2: an enhanced web server for large-scale expression profiling and interactive analysis. Nucleic Acids Res 2019; 47: W556–W560. [DOI] [PMC free article] [PubMed] [Google Scholar]
- 24.Devalaraja S, To TKJ, Folkert IW, Natesan R, Alam MZ, Li M et al. Tumor-Derived Retinoic Acid Regulates Intratumoral Monocyte Differentiation to Promote Immune Suppression. Cell 2020; 180: 1098–1114 e1016. [DOI] [PMC free article] [PubMed] [Google Scholar]
- 25.Asokan SB, Johnson HE, Sondek J, Shutova MS, Svitkina TM, Haugh JM et al. Lysophosphatidic acid provokes fibroblast chemotaxis through combinatorial regulation of myosin II. bioRxiv 2019: 355610. [Google Scholar]
- 26.Basu S, Totty NF, Irwin MS, Sudol M, Downward J. Akt phosphorylates the Yes-associated protein, YAP, to induce interaction with 14-3-3 and attenuation of p73-mediated apoptosis. Mol Cell 2003; 11: 11–23. [DOI] [PubMed] [Google Scholar]
- 27.Niture S, Dong X, Arthur E, Chimeh U, Niture SS, Zheng W et al. Oncogenic Role of Tumor Necrosis Factor alpha-Induced Protein 8 (TNFAIP8). Cells 2018; 8. [DOI] [PMC free article] [PubMed] [Google Scholar]
- 28.Xing Y, Liu Y, Liu T, Meng Q, Lu H, Liu W et al. TNFAIP8 promotes the proliferation and cisplatin chemoresistance of non-small cell lung cancer through MDM2/p53 pathway. Cell Commun Signal 2018; 16: 43. [DOI] [PMC free article] [PubMed] [Google Scholar]
- 29.Xie Y, Zhou F, Zhao X. TNFAIP8 promotes cell growth by regulating the Hippo pathway in epithelial ovarian cancer. Exp Ther Med 2018; 16: 4975–4982. [DOI] [PMC free article] [PubMed] [Google Scholar]
- 30.Han Y, Tang Z, Zhao Y, Li Q, Wang E. TNFAIP8 regulates Hippo pathway through interacting with LATS1 to promote cell proliferation and invasion in lung cancer. Mol Carcinog 2018; 57: 159–166. [DOI] [PubMed] [Google Scholar]
- 31.Briata P, Lin WJ, Giovarelli M, Pasero M, Chou CF, Trabucchi M et al. PI3K/AKT signaling determines a dynamic switch between distinct KSRP functions favoring skeletal myogenesis. Cell Death Differ 2012; 19: 478–487. [DOI] [PMC free article] [PubMed] [Google Scholar]
- 32.Watt KI, Judson R, Medlow P, Reid K, Kurth TB, Burniston JG et al. Yap is a novel regulator of C2C12 myogenesis. Biochem Biophys Res Commun 2010; 393: 619–624. [DOI] [PubMed] [Google Scholar]
- 33.Zhong M, Zhu M, Liu Y, Lin Y, Wang L, Ye Y et al. TNFAIP8 promotes the migration of clear cell renal cell carcinoma by regulating the EMT. J Cancer 2020; 11: 3061–3071. [DOI] [PMC free article] [PubMed] [Google Scholar]
- 34.Day TF, Kallakury BVS, Ross JS, Voronel O, Vaidya S, Sheehan C et al. Dual Targeting of EGFR and IGF1R in the TNFAIP8 Knockdown Non-small Cell Lung Cancer Cells. Mol Cancer Res 2019. [DOI] [PMC free article] [PubMed] [Google Scholar]
- 35.Sun H, Lou Y, Porturas T, Morrissey S, Luo G, Qi J et al. Exacerbated experimental colitis in TNFAIP8-deficient mice. J Immunol 2015; 194: 5736–5742. [DOI] [PMC free article] [PubMed] [Google Scholar]
- 36.Sakurai T, He G, Matsuzawa A, Yu GY, Maeda S, Hardiman G et al. Hepatocyte necrosis induced by oxidative stress and IL-1 alpha release mediate carcinogen-induced compensatory proliferation and liver tumorigenesis. Cancer Cell 2008; 14: 156–165. [DOI] [PMC free article] [PubMed] [Google Scholar]
- 37.Maeda S, Kamata H, Luo JL, Leffert H, Karin M. IKKbeta couples hepatocyte death to cytokine-driven compensatory proliferation that promotes chemical hepatocarcinogenesis. Cell 2005; 121: 977–990. [DOI] [PubMed] [Google Scholar]
- 38.Swann JB, Vesely MD, Silva A, Sharkey J, Akira S, Schreiber RD et al. Demonstration of inflammation-induced cancer and cancer immunoediting during primary tumorigenesis. Proc Natl Acad Sci U S A 2008; 105: 652–656. [DOI] [PMC free article] [PubMed] [Google Scholar]
- 39.Schreiber TH, Podack ER. A critical analysis of the tumour immunosurveillance controversy for 3-MCA-induced sarcomas. Br J Cancer 2009; 101: 381–386. [DOI] [PMC free article] [PubMed] [Google Scholar]
- 40.Sun H, Lin M, Zamani A, Goldsmith JR, Boggs AE, Li M et al. The TIPE Molecular Pilot That Directs Lymphocyte Migration in Health and Inflammation. Sci Rep 2020; 10: 6617. [DOI] [PMC free article] [PubMed] [Google Scholar]
- 41.Li T, Li X, Zamani A, Wang W, Lee CN, Li M et al. c-Rel Is a Myeloid Checkpoint for Cancer Immunotherapy. Nat Cancer 2020; 1: 507–517. [DOI] [PMC free article] [PubMed] [Google Scholar]
- 42.Goldsmith JR, Spitofsky N, Zamani A, Hood R, Boggs A, Li X et al. TNFAIP8 controls murine intestinal stem cell homeostasis and regeneration by regulating microbiome-induced Akt signaling. Nat Commun 2020; 11: 2591. [DOI] [PMC free article] [PubMed] [Google Scholar]
- 43.Moroishi T, Hayashi T, Pan WW, Fujita Y, Holt MV, Qin J et al. The Hippo Pathway Kinases LATS1/2 Suppress Cancer Immunity. Cell 2016; 167: 1525–1539 e1517. [DOI] [PMC free article] [PubMed] [Google Scholar]
Associated Data
This section collects any data citations, data availability statements, or supplementary materials included in this article.
Data Availability Statement
RNA-seq data that support the findings of this study have been deposited in the ArrayExpress under accession nos. E-MTAB-10468.


