Abstract
Patients’ remote monitoring becomes even more crucial due to the spreading of the COVID-19 disease. Hospitals cannot accommodate all the patients who need to be taken care. Hence, tele-medicine or, as also named, tele-health, remains the only means available to keep the situation under control. In particular, it is important to monitor the patients who are subject to the home quarantine period. The reason is twofold: (i) their live status and symptoms must be controlled; (ii) they must not leave the permitted area during the quarantine period. To this end, the paper defines a set of rules and processes based on the Internet of Things (IoT) paradigm, which enable the integration of different devices, in order to monitor the required parameters related to the patient and notify life-threatening situations to the connected health-care structure. The conceived IoT network is developed by means of Node-RED, which is a flow-based programming tool targeted to the IoT. Particular attention is also paid to security and privacy requirements, since sensitive data related to the patients must be kept safe. The proposed solution is preliminary assessed by means of a test-bed.
Keywords: internet of Things, E-health, Remote monitoring, COVID-19, Node-RED, Prototyping
1. Introduction
When the COVID-19 disease was rapidly spreading throughout the world, the most difficulty faced by hospitals were the lack of enough places (i.e., beds) to accommodate the patients (Hamzah et al., 2020). Hence, they were forced to send back the patients with mild symptoms to their homes for self-quarantine (Nussbaumer-Streit et al., 2020). During the home quarantine period, it is very troublesome to monitor the patients’ live status by doctors or other medical staffs. Proper medications have to be provided promptly in case the symptoms get worse. No delays in notifications can be tolerated. The implementation of an Home Quarantine Patient Monitoring System, with the help of IoT network, would minimize the physical gap between the patient and the healthcare system.
To such an aim, an Internet of Things (IoT) based network infrastructure is conceived in this paper, since heterogeneous devices can be involved in remote monitoring applications (Luo, Chen, Tang, & Luo, 2009); in fact, it comprises of wearable sensors, GPS tracker, air quality sensor, a lightweight database and a monitoring dashboard. Wearable sensors would monitor the body temperature, blood pressure, oxygen saturation, heart rate and respiratory rate. GPS tracker would ensure the patient does not leave the permitted area during the quarantine period. This helps to prevent the community spread. The air quality of the quarantine room is also measured as it has a role in patients’ recovery from the effect of COVID-19 on lungs. All the measured values are accessible by the patient itself, the allotted doctor and other authorized medical staff, by means of proper credentials.
A monitoring dashboard is assigned to accommodate all the sensor values. All the measured values are encrypted before sending through the involved network nodes to keep the privacy of the patient intact (Boric-Lubecke et al., 2014). Alerts like dashboard sound notification, popup notification and SMS message would be initiated on situations where the vital measurements exceed or fall behind the normal range. The medical staff can then take the necessary actions required, like sending ambulance to the patient’s home or arranging an intensive care bed.
The just described features and functionalities are designed, developed and simulated by means of Node-RED 1 . It is an open project, initially developed by IBM, which proposes a flow-based programming tool. The behavior of the application which must be designed/developed can be represented as a network of black-boxes, which may communicate with each others and regulate the flow of the information within the envisioned system. It also provides a visual representation, which supports the developers in better understanding the interactions happening within the whole IoT network architecture as well as the messages’ passing. In fact, different kinds of entity can be modeled, in particular both hardware (e.g., sensors) and software (e.g., services). Such a feature perfectly fits the IoT concept and the requirements of the tele-medicine system to be realized.
The remainder of this paper is organized as follows. Section 2 investigates the actual state of the art about remote monitoring in IoT systems, also in relation to the COVID-19 disease. Section 3 presents the system’s definition and its behavior (i.e., entities, interactions, rules, functionalities). Section 4 describes the rules and processes definition by means of the Node-RED tool; while Section 5 provides a discussion on security related functionalities. Finally, Section 6 ends the paper, detailing a discussion about the conducted study and drawing some directions for future research work.
2. Related work
Disasters and pandemics pose unique challenges to health care delivery, as pointed out in Hollander and Carr (2020). Clinicians must be able to monitor the patients from a remote place. There are many reason for such a requirements: (i) remotely monitoring in real-time the patients who are subject to the quarantine period; (ii) facilitating the evaluation of the patients’ life status before hospital transfer, potentially allowing them to be placed directly in a hospital bed, reducing exposure for health care workers and other patients; (iii) health care workers may also be quarantined, sick, or absent, because of exposure to COVID-19.
The work, described in Wosik et al. (2020), provides an interesting description of the role that tele-health has played in transforming health-care delivery during the 3 phases of the U.S. COVID-19 pandemic: (i) stay-at-home outpatient care; (ii) initial COVID-19 hospital surge; (iii) post-pandemic recovery. Within each of these 3 phases, the study examines how people, process, and technology work together to support a successful tele-health transformation, which is still under development.
Unfortunately, as revealed by Ohannessian, Duong, and Odone (2020), most countries lack a regulatory framework to authorize, integrate, and reimburse tele-medicine services, including in emergency and outbreak situations. As well, Portnoy, Waller, and Elliott (2020) recognizes that people are not totally aware of the existence of tele-health systems, or they do not know how they work and do not care about their benefits.
Many works (Maghdid et al., 2020, Moazzami et al., 2020) propose the use of smartphones or webcam-enabled computers to effectively screen patients with early signs of COVID-19 before they reach to hospital or when they undergo the quarantine period. But such devices are not the only ones which can be adopted for patients’ remote monitoring. In fact, different kinds of wearables devices, GPS trackers, or air quality sensors can be involved, in order to accurately screen in real-time the people’s conditions. Such technologies can be integrated in a unique IoT network, and connected towards health-care structures.
IoT within infectious disease epidemiology is an emerging field (Rahman et al., 2020). However, the possibility of deploying ubiquitous and smart technologies surely supports in predicting, preventing and controlling the spread of COVID-19, through the globalization and interconnectedness of the local areas. Note that web-based surveillance tools and epidemic intelligence methods have recently emerged in several countries (Christaki, 2015) to facilitate risk assessment and timely outbreak detection, however widespread use of the available technologies is still lacking, as hinted above.
In this sense, IoT related technology helps both to increase patient satisfaction and can reduce readmission rate in the hospitals (Singh, Javaid, Haleem, & Suman, 2020), together with Artificial Intelligence (AI) (Nguyen, 2020) and deep learning mechanisms (Ting, Carin, Dzau, & Wong, 2020), which can enhance the detection and diagnosis of COVID-19.
The work in Nasajpour et al. (2020) presents the most complete analysis about the role of IoT-based technologies in facing with COVID-19 and reviews the state-of-the-art architectures, platforms, applications, and industrial IoT-based solutions combating COVID-19 in the three main phases, which include early diagnosis, quarantine time, and after recovery. Besides the IoT hardware devices to be put in action, it is important to define a proper IoT framework, able to manage them and to provide the adequate support via software, in order to promptly gather the information acquired by the IoT sources and take proper actions in response to the changes. Since the emergency is currently still in place, lightweight solutions must be preferred.
Hence, the scope of the present paper is to propose a rapid approach for the development of IoT related applications, by means of a tool, named Node-RED, which is able to allow the representation of the IoT infrastructure closer as much as possible to the future working system, in order to provide to designers and developers a complete view of the final architecture before its real deployment, as demonstrated in Blackstock and Lea, 2014, Lekic and Gardasevic, 2018, Sicari et al., 2019 and Tomasic, Khosraviani, Rosengren, Jornten-Karlsson, and Linden (2018) (further details are presented in Section 4.1.1). Note that many solutions, tailored to specific features of the realization of IoT-based systems (e.g., routing algorithms, security mechanisms, data exchange methods, etc.), have been proposed in literature Al-Fuqaha, Guizani, Mohammadi, Aledhari, and Ayyash (2015) and Castellani et al. (2010), but often they only provide a partial representation of the whole architecture. Such a limit prevents to have a complete understanding of the implications and possible side effects of a designed IoT infrastructure; while the possibility of early (i.e., in a testing environment) analyzing and running the conceived IoT network could allow to save time before the final development, and to avoid mistakes. Moreover, it is fundamental to have the possibility of separately representing the hardware and the software functionalities of an application, in order to let them being interchangeable (e.g., the need of testing an application with different hardware to choose the best one). These are the reason for adopting Node-RED for the design, development, and prototyping of the envisioned remote health monitoring system to face COVID-19 diffusion. It is worth to remark that we primarily refer to the realization of applications to be used in local geographical areas, with the aim of offering a quickly support to small realities, which feel often globally abandoned.
3. System definition and behavior
The envisioned remote health monitoring system should be mainly composed by: (i) heterogeneous IoT devices, able to acquire relevant patient related information, which will be details in the following; (ii) a publish&subscribe based system, in charge of managing the acquisition and sharing of data, with an MQTT broker as an intermediary; (iii) a lightweight database management system for the historization of the monitored information; (iv) an application for the visualization of the analyzed data. A control application manages all such entities. Fig. 1 provides an high-level vision of the system schema. The next subsections will detail the monitored parameters and the rules to be applied within the e-health environment. Note that such rules will determine the behavior of the whole system, in response to changes.
Fig. 1.
System schema.
3.1. Health vitals
The most important parameters that are monitored in the system are that of health vitals. The health vital signs which are screened are body temperature, systolic pressure, diastolic pressure, oxygen saturation, heart rate and respiratory rate. Their healthy normal ranges are given in Table 1, as long as the identifier for each parameter. A comprehensive overview of parameters related to remote health monitoring is available in Tomasic, Tomasic, Trobec, Krpan, and Kelava (2018).
Table 1.
Normal range values of health vital signs.
| ID | Health vital sign | Normal range |
|---|---|---|
| 1 | BODY TEMPERATURE | 97–99 Fahrenheit (F) |
| 2 | SYSTOLIC PRESSURE | 90–120 millimeter of mercury (mmHg) |
| 3 | DIASTOLIC PRESSURE | 60–80 millimeter of mercury (mmHg) |
| 4 | OXYGEN SATURATION | 95–100 percentage (%) |
| 5 | HEART RATE | 60–100 beats per min (bpm) |
| 6 | RESPIRATORY RATE | 12–20 breaths per min (bpm) |
3.2. Air quality
Another fundamental parameter, which is monitored in the system, is the air quality index measurement. Its importance is also emphasized in Tomasic, Tomasic et al. (2018). The identifier and the normal range is given in Table 2.
Table 2.
Normal range value of air quality index.
| ID | Parameter | Normal Range |
|---|---|---|
| 7 | AIR QUALITY | 0–50 air quality index (AQI) |
3.3. Location
The final parameters monitored in the system regard the GPS coordinates of the patient inside the quarantine area. It consists of the latitude and longitude values. A logical perimeter is set up around the building where the patient stays to check the status of the same (Table 3) Such a parameter will be indicated, in the following, as geofence.
Table 3.
Status of location coordinates.
| ID | Parameter | Normal Range |
|---|---|---|
| 8 | LATITUDE | Depend on the patient’s home location |
| 9 | LONGITUDE | Depend on the patient’s home location |
Fig. 2 summarizes, in a UML class diagram, the entities involved in an generic Home Quarantine Room, which is associated to a patient’s ID. Note that three kinds of alert devices are also included, namely: Health Alert, Air Quality Alert, and GPS Alert.
Fig. 2.
Class diagram of the remote health monitoring system.
3.4. Rules
The main rules set up in the system are the following:
-
1.If Body Temperature is not between 97°F and 99°F, then
-
1.1Health Alert inside quarantine room goes ON
-
1.2Audio alert gets activated at the monitoring device
-
1.3Popup notification emerges at the monitoring device
-
1.4SMS message with abnormal value will be send to provided users
-
1.1
-
2.If Systolic Pressure is not between 90 mmHg and 120 mmHg, then
-
2.1Health Alert inside quarantine room goes ON
-
2.2Audio alert gets activated at the monitoring device
-
2.3Popup notification emerges at the monitoring device
-
2.4SMS message with abnormal value will be send to provided users
-
2.1
-
3.If Diastolic Pressure is not between 60 mmHg and 80 mmHg, then
-
3.1Health Alert inside quarantine room goes ON
-
3.2Audio alert gets activated at the monitoring device
-
3.3Popup notification emerges at the monitoring device
-
3.4SMS message with abnormal value will be send to provided users
-
3.1
-
4.If Oxygen Saturation is not between 95% and 100%, then
-
4.1Health Alert inside quarantine room goes ON
-
4.2Audio alert gets activated at the monitoring device
-
4.3Popup notification emerges at the monitoring device
-
4.4SMS message with abnormal value will be send to provided users
-
4.1
-
5.If Heart Rate is not between 60 bpm and 100 bpm, then
-
5.1Health Alert inside quarantine room goes ON
-
5.2Audio alert gets activated at the monitoring device
-
5.3Popup notification emerges at the monitoring device
-
5.4SMS message with abnormal value will be send to provided users
-
5.1
-
6.If Respiratory Rate is not between 97°F and 99°F, then
-
6.1Health Alert inside quarantine room goes ON
-
6.2Audio alert gets activated at the monitoring device
-
6.3Popup notification emerges at the monitoring device
-
6.4SMS message with abnormal value will be send to provided users
-
6.1
-
7.If Air Quality Index is not between 0 AQI and 50 AQI, then
-
7.1Air Quality Alert inside quarantine room goes ON
-
7.2Audio alert gets activated at the monitoring device
-
7.3Popup notification emerges at the monitoring device
-
7.4SMS message with abnormal value will be send to provided users
-
7.1
-
8.If Latitude is not inside the geofence, then
-
8.1Location Alert inside quarantine room goes ON
-
8.2Audio alert gets activated at the monitoring device
-
8.3Popup notification emerges at the monitoring device
-
8.4SMS message with abnormal value will be send to provided users
-
8.1
-
9.If Longitude is not inside the geofence, then
-
9.1Location Alert inside quarantine room goes ON
-
9.2Audio alert gets activated at the monitoring device
-
9.3Popup notification emerges at the monitoring device
-
9.4SMS message with abnormal value will be send to provided users
-
9.1
Fig. 3 shows the UML sequence diagram related to the e-health system’s behavior accordingly to the monitoring of the Body Temperature parameter and the corresponding rule. Such a sequence diagram for other health sensors like systolic pressure, diastolic pressure, oxygen saturation, heart rate and respiratory rate is same of Fig. 3, except for the topic (please refer to Section 4 for further details).
Fig. 3.
Sequence diagram of Body Temperature reading.
Fig. 4 shows the UML sequence diagram related to the e-health system’s behavior accordingly to the monitoring of the Air Quality parameter and the corresponding rule.
Fig. 4.
Sequence diagram of Air Quality reading.
Fig. 5 shows the UML sequence diagram related to the e-health system’s behavior accordingly to the monitoring of the Location parameter and the corresponding rule.
Fig. 5.
Sequence diagram of Location reading.
Note that, whenever a sensor reading is received, the first check done is the comparison with the previous reading of same sensor type of same patient. If the current reading and previous reading does not match, then the reading is written to the database collection of the corresponding patient. Else if it matches, then the reading is not written to database. Such a check prevents the database redundancy.
4. Rules and processes development
This section will clearly explain which tools and technologies have been used for the development of the e-health monitoring rules and processes, defined in Section 3. Moreover, the behavior as well as the visualization function tailored to the processed information will be also detailed.
4.1. Adopted tools and technologies
4.1.1. Node-RED tool
Node-RED 2 has been chosen for the development of the control application. It is a web-based and event-driven tool, which is implemented in JavaScript, using the Node.js framework 3 . It provides a browser-based flow editor, where data flow programs, consisting of nodes, can be connected by wires, on the basis of the required behavior of the designed application. Node-RED makes available a large set of nodes and flows, mainly developed by the open source community. New flows and sub-flows may be defined by the developers. Moreover, Node-RED can also be deployed on a physical smart device; in fact, the lightweight nature of Node.js and the simplicity of the Node-RED execution engine allows Node-RED flows to be executed with good performance on devices, such as the Raspberry Pi or Arduino. Node-RED was originally developed as an open source project at IBM in late 2013, to satisfy their need to quickly connect hardware and devices to web services and other software applications, as demonstrated by the work in Lekic and Gardasevic (2018), which presents the implementation of an IoT application that performs the temperature and humidity sensing using DHT11 sensor on Raspberry Pi, and data transfer to the Cloud of the IBM Bluemix, with Node-RED as an intermediary. Another work Tomasic, Khosraviani et al. (2018) uses Node-RED to design a functional web interface for the sensors data in a remote health monitoring scenario; more in detail, it exploits OpenMotes, which are IoT devices featuring IEEE 802.15.4 protocol, with Contiki-NG and OpenWSN (i.e., two of the most popular IoT operating systems) for obtaining data from the OpenMote’s sensors. Hence, Node-RED reveals to be a kind of glue for the IoT. For such a reason it is quickly evolved to be a general purpose IoT programming tool.
Note that the location coordinates and all the health vitals mentioned in Section 3 can be collected with the help of smart wearables like fitness tracker or smart watch. For example, manufacturers like Fitbit and Garmin (Zhou & Piramuthu, 2014) produces devices of similar kind. Regarding the air quality measurement, devices similar to uHoo 4 and UpSens 5 company products can be used to actively measure and report the same. Such devices could be potentially tested by connecting them to the Node-RED framework.
It is worth to remark that all the information transmitted within the described system are encrypted, by means of proper functions, made available by Node-RED CryptoJS component. It supports many encryption/decryption functions, such as AES, DES, RC4, digest such as MD5, SHA-1, SHA-3, and hash-based message authentication codes (HMAC). Further details on security and privacy mechanisms are provided in Section 5.
4.1.2. MongoDB
A NoSQL database, named MongoDB 6 has been selected as the repository for the information handled by the e-health system. MongoDB is a document-oriented database and is currently the foremost popular NoSQL database on the market. Almost like how relational databases are supported on tables, document-oriented databases like MongoDB are supported on collection of documents, with each of those documents consisting of key/value attributes. As MongoDB allows for dynamic schema changes, it is easy to form agile changes without having to transform the prevailing database so as to support the new fields, with its own unique set of attributes. Additionally, the hierarchy of documents maps easily to object hierarchies within application code, simplifying create, read, update, and delete operations. MongoDB not only provides these capabilities, but it does so without impacting performance, high availability or scalability. MongoDB outruns many traditional RDBMS with great mirroring and auto-scaling features, making it to grow as needs and data change periodically (Parker, Poe, & Vrbsky, 2013).
At least two collections are defined within the database of the system proposed in Section 3. Those are the PatientAccess collection and the Alert collection. The PatientAccess collection consists of the record of the patient ID which a user wants to live monitor on the dashboard. The Alert collection consists of all the records of alerts triggered when the sensor readings goes abnormal. Other than these collections, a collection is created whenever a record is received from a new patient. The collection will be auto named with prefix ’Patient’ and followed by the patient ID. Each particular patient collection would accept all the readings from a sensor. A record in a patient collection would contain six fields other than the unique , which are: PatientID, Sensor, Reading, Date, Time and Status.
4.1.3. MQTT and mosquitto
MQTT stands for Message Queuing Telemetry Transport 7 . It is a light-weight publish and subscribe protocol, adopted, as introduced in Section 3 for regulating the communications within the e-health system. MQTT is a simple messaging protocol, developed to work with constrained devices of low-bandwidth. Hence, it represents the right solution for IoT applications. MQTT allows you to send commands to regulate outputs, read and publish data from sensor nodes and far more. Therefore, it makes it very easy to establish a communication among multiple devices.
When adopting a publish and subscribe protocol, a device can publish a message on a topic, and/or it is subscribed to a specific topic to receive messages. Messages are the data that you simply want to communicate between your devices. Topics are the way you register interest for incoming messages or how you specify where you would like to publish the message. Topics are represented with strings separated by a forward slash. Each forward slash indicates a subject level. The broker is mainly liable for accepting all messages, checking the messages, verifying who is subscribed them and then publishing them to all or any subscribed clients.
In this paper, Mosquitto has been selected as a non-proprietary message broker that implements the MQTT protocol. Mosquitto is lightweight and is suitable to be used on all devices from low power single board computers to full servers. The Mosquitto project also provides a C library for implementing MQTT clients, and therefore the very popular and instruction MQTT clients 8 . Note that the broker can run together with the IoT platform or can be also located on a different server or network infrastructure.
In the following, the topics’ structure adopted in the paper is presented.
MQTT Publish Topics:
-
•
patient id/ HomeQ/ HealthStat/ BodyTemperature
-
•
patient id/ HomeQ/ HealthStat/ SystolicPressure
-
•
patient id/ HomeQ/ HealthStat/ DiastolicPressure
-
•
patient id/ HomeQ/ HealthStat/ OxygenSaturation
-
•
patient id/ HomeQ/ HealthStat/ HeartRate
-
•
patient id/ HomeQ /HealthStat/ RespiartoryRate
-
•
patient id/ HomeQ/ RoomStat/ AirQual
-
•
patient id/ HomeQ/ Location/ LatLon
MQTT Subscribe Topics:
-
•
+/ HomeQ/HealthStat/ +
-
•
+/ HomeQ/RoomStat/ +
-
•
+/ HomeQ/Location/ +
All the sensor readings are encrypted just before being published via the MQTT broker. One can choose the appropriate encryption algorithm and a good secret key to configure the encryption node. Obviously, all the sensor readings are decrypted when arrive after being subscribed via the MQTT broker. One should choose both the same algorithm and secret key that has been used for the encryption.
4.2. Devices’ simulation
The scenario at the patient side (i.e., including the sensors presented in Section 3) is executed using a simulator, which is written in Java programming language. The simulator window consists of three main modules. They are: monitoring devices, alert devices and ID number, as shown in Fig. 6.
Fig. 6.
Simulator used with trial values.
The monitoring module consists of the sensor input panels. It consists of total nine sensors which are, as introduced in Section 3: body temperature, systolic pressure, diastolic pressure, oxygen saturation, heart rate, respiratory rate, air quality index, latitude and longitude coordinates.
The alert module in the simulator is meant for the reception by the patient itself. The Health Alert will turn ON whenever the values of health sensors goes beyond or fall below the normal healthy ranges of the vital signs, as depicted in Fig. 7. The alert will turn OFF once all the health sensor values comes in between the normal ranges.
Fig. 7.
Simulator when the body temperature goes abnormal.
Seamlessly, the AQI alert will turn ON whenever the value of air quality sensor goes beyond the normal healthy range, as sketched in Fig. 8. The alert will turn OFF once all the air quality value comes in between the normal range.
Fig. 8.
Simulator when the air quality goes abnormal.
Finally, the Location Alert will turn ON whenever the values of latitude and longitude goes outside the geographical fence logically created, as shown in Fig. 9. The alert will turn OFF once the GPS coordinates comes inside the mentioned area.
Fig. 9.
Simulator when the patient goes outside quarantine area.
The patient ID input module is simulated only for the one-time input. It is meant to be set up by the authorized staff at the initial stage. The patient could never alter the value thereafter. The collections in the database are created according to this unique patient ID, as previously explained. Summarizing, the devices and their corresponding data types, used in the simulator, are provided in Table 4.
Table 4.
Devices and data types.
| ID | Data type | Description |
|---|---|---|
| 1 | FLOAT | BODY TEMPERATURE |
| 2 | FLOAT | SYSTOLIC PRESSURE |
| 3 | FLOAT | DIASTOLIC PRESSURE |
| 4 | FLOAT | OXYGEN SATURATION |
| 5 | FLOAT | HEART RATE |
| 6 | FLOAT | RESPIRATORY RATE |
| 7 | FLOAT | AIR QUALITY |
| 8 | FLOAT | LATITUDE |
| 9 | FLOAT | LONGITUDE |
| 10 | BOOLEAN | HEALTH ALERT |
| 11 | BOOLEAN | AIR QUALITY ALERT |
| 12 | BOOLEAN | LOCATION ALERT |
4.3. Running flows
There are six main flows in the system, which reflect the rules presented in Section 3. The flow in Fig. 10, Fig. 11 is used to retrieve the values from health sensors in the Java simulator. Such a flow consists of the following Node-RED nodes: inject node, function nodes, template nodes, encryption nodes, switch nodes, MQTT out nodes and join node. It also consists of two sub flows, named GetValueFromSensor and SetValueIntoSensor, respectively. The flow reads the patient ID from the simulator in the beginning. The flow is then divided into six sections according to the sensor types. Each section initially sets the topic according to the sensor type it needs to collect the reading from. This topic value is also used to set up the MQTT out node. Then, the corresponding sensor ID is provided, which is same as that of the simulator (i.e., which simulate the behavior of the real hardware). Once the reading from the sensor is received, it is again divided into two sub sections. The first sub section will then convert the payload reading into plain text which is then encrypted. The encrypted message payload is then published via the MQTT out node. The second sub section processes the reading to check whether it lies in between the normal ranges. If it is outside the normal range, then the alert value will be set true. Else the alert value will be set false.
Fig. 10.
Beginning fragment of HealthSensors flow.
Fig. 11.
Final fragment of HealthSensors flow.
The flow, which is split as shown in Fig. 10, Fig. 11, is implemented in a similar way for the other five sections which corresponds five different health sensors. In the end, all these six sections are merged using the join node. Then, the alert value of each sensor message payload is checked. If the value of any payload is true, then the message alert will be set ON. This message is then sent to simulator to reflect the change in the health alert, as previously shown in Fig. 7.
The flow in Fig. 13 is used to retrieve the values of air quality sensor from the Java simulator. The flow will read the patient ID from the simulator in the beginning. Then, the topic is set according to the sensor type, which is air quality here. This topic value is also used to set up the MQTT out node. Then, the corresponding sensor ID is provided, which is always the same as that of the simulator. Once the reading from the sensor is received, it is divided into two sections. The first section will then convert the payload reading into plain text which is then encrypted. The encrypted message payload is then published via the MQTT out node. The second section processes the reading to check whether it lies in between the normal ranges. If it is outside the normal range, then the alert value will be set true. Else the alert value will be set false. This message is then sent to simulator to reflect the change in air quality alert, as previously shown in Fig. 8.
Fig. 13.
AirQualitySensor flow.
The flow in Fig. 14 is used to retrieve the values of GPS coordinates such as latitude and longitude from the Java simulator. Such a flow consists of the following Node-RED nodes: inject node, function nodes, template node, encryption node, switch node, MQTT out node, join node and geofence node. It also consists of a new sub flow, named GetGPSCoordinates. The flow will read the patient ID from the simulator in the beginning and is appended to the message. Then, the sub flow GetGPSCoordinates will read both the latitude and longitude values in the simulator. After receiving the values, those are saved as msg.lat and msg.lon for the processing in geofence node. Both values are then joined together as a single object. From there the flow is divided into two sections. The first section will set the topic according to the sensor type, which is GPS here. Then, the latitude and longitude readings are concatenated and converted into plain text which is then encrypted. The encrypted message payload is then published via the MQTT out node. The second section processes the reading to check whether it lies inside the quarantine perimeter or outside the same. If it is outside the region, then the alert value will be set true. Else the alert value will be set false. This message is then sent to simulator to reflect the change in location alert, as previously shown in Fig. 9.
Fig. 14.
GPSSensor flow.
Note that the geofence node (which is sketched in Fig. 12) accepts input as msg.lat and msg.lon for the values of latitude and longitude, respectively. One can set up the quarantine perimeter or a logical fence by searching and assigning the location in the configuration panel of the node. The node will set output msg.location.inarea as true if the GPS coordinates received are inside the perimeter previously set up. Else it will be set as false.
Fig. 12.
Configuration view of geofence node on GPSSensor flow.
The flow, which is split in Fig. 15, Fig. 16, is used to retrieve the values of all the sensors that has been published by the MQTT broker. Such a flow consists of the following Node-RED nodes: MQTT input nodes, decryption nodes, function nodes, switch nodes, mongodb input nodes, mongodb output nodes, template nodes, ui_audio modes, ui_toast nodes and twilio out nodes. The flow also includes three MQTT input nodes, which subscribes three unique topics. The first MQTT input node subscribes the various health sensor values. Once a message is received, it is then decrypted using same algorithm and secret key used for encryption. The flow will then extract and assign the patient ID, the sensor type and the reading from the message received. Then, the current timestamp is appended to the message for future references. The message flow is then passed through a switch node which checks the health sensor type. The switch node will then divide the flow further to six sections, according to the health sensor types. Each of such section is further divided into two sub sections by using a switch node. In detail, the switch node checks whether the reading of particular sensor type lies in between the normal ranges of the corresponding health vital sign. If it is outside the normal range, then the status message will be set as abnormal. Else the status message will be set as normal. The complete message is then backed up using a different name. This is used for further comparison. Then, a function node is used to set up the collection name for the database. The collection name is set up using the patient ID, as previously explained.
Fig. 15.
Beginning fragment of AlertListeners flow (health sensor).
Fig. 16.
Final fragment of AlertListeners flow (health sensor).
Again, a function node is used for assigning the query to get the last document written to the collection of the same patient which matches the same health sensor type. A mongodb input node is used for retrieving the document from the database. It is here then the previously backed up message is compared with the new message received from the database. Such a check prevents the database redundancy. From here the flow will continue only if current sensor reading is not equal to previous sensor reading. The previously backed up message is set as message payload then. A switch node then compares the reading status of the message. If the status is abnormal, then the alert nodes are triggered. If the status is normal, then the message payload will be simple written to the collection of the corresponding patient using the mongodb output node. The alert section consists of three simultaneous paths. The first one set up a health alert text and is then played as audio in the dashboard using a ui_audio node. The second one too set up a health alert text. It is then sent as a SMS message to a particular user and is shown as a popup in the dashboard using a ui_toast node. The third one set up a message that is then written to the Alert collection of the database.
The second MQTT input node subscribes the air quality sensor value. Once a message is received, it is then decrypted using same algorithm and secret key used for encryption. The flow will then extract and assign the patient ID, the sensor type and the reading from the message received. Then, the current timestamp is appended to the message for future references. The message flow is then passed through a switch node which checks whether the reading of particular sensor type lies in between the normal ranges of the air quality index, as happened for the health sensors. If it is outside the normal range, then the status message will be set as abnormal. Else the status message will be set as normal.
The complete message is then backed up as before. Again, a function node is used for assigning the query to get the last document written to the collection of the same patient which matches the air quality sensor. If the status is abnormal, then the alert nodes are triggered. If the status is normal, then the message payload will be simple written to the collection of the corresponding patient. The alert section consists of three simultaneous paths, as before (Fig. 17, Fig. 18).
Fig. 17.
Air Quality fragment of AlertListeners flow.
Fig. 18.
Location fragment of AlertListeners flow.
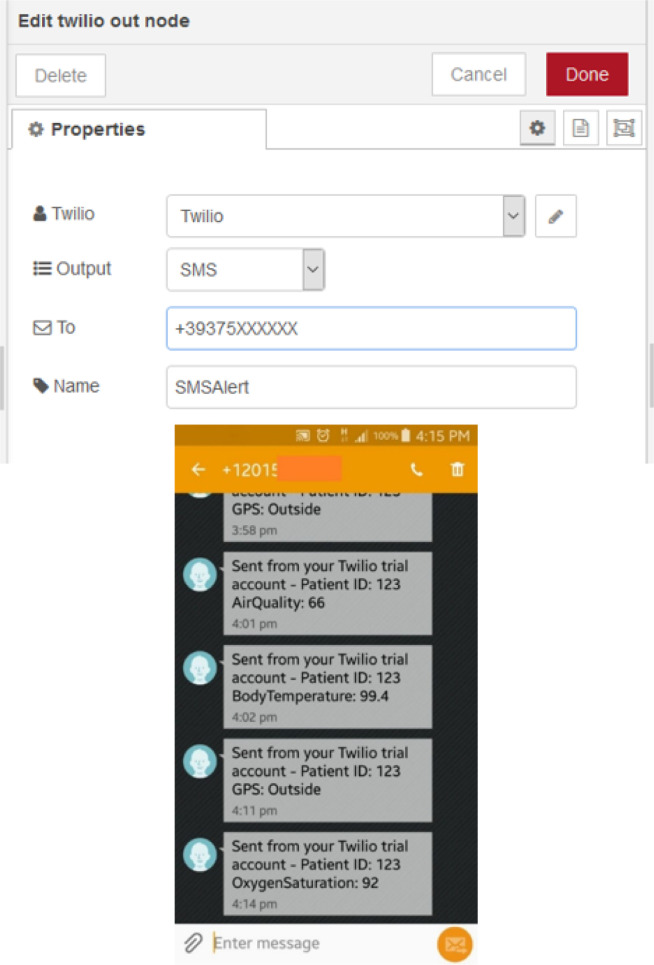
The third MQTT input node subscribes the location sensor values. Once a message is received, it is then decrypted using same algorithm and secret key used for encryption. The flow will then extract and assign the latitude and longitude values from the message payload, followed by the patient ID. Then, the coordinates are processed in geofence node to check whether the patients’ location is inside the perimeter of quarantine area. If the coordinates are outside of the region, then the output will be false while the same will be true, if the coordinates are inside the region. The flow will then extract and assign the sensor type and the reading from the message received. As usually, the current timestamp is appended to the message. The message flow is then passed through a switch node which checks whether the geofence output is true or false. If the output is false, then the status message will be set as outside. Else the status message will be set as inside. Again, a function node is used for assigning the query to get the last document written to the collection of the same patient which matches the GPS sensor. The comparison with the previous value is separately for both the latitude and longitude. If any one of them is not equal, then the value of a previously declared change message will be set as true. From here the flow will continue only if value of change message is true. A switch node then compares the status of the message. If the status is outside, then the alert nodes are triggered. If the status is inside, then the message payload will be simple written to the collection of the corresponding patient. The alert section again consists of three simultaneous paths, as before. Fig. 19 shows some examples of the functionality provided by the SMS messages.
Fig. 19.
Twilio (SMS alert) node configuration and examples of received messages.
4.4. Data visualization
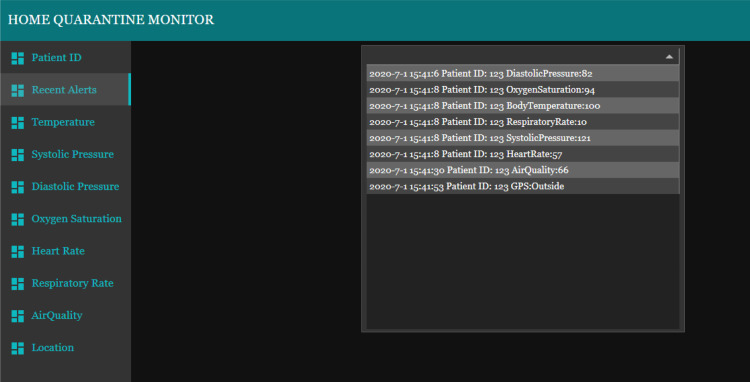
The dashboard, which enables the visualization of the current and historical patients’ situation, consists of ten tabs. The first tab contains the Patient ID and it is used for collecting the ID number of the patient the user wants to monitor. The value of the ID will determine the live values being collected for other tabs. The patient ID will be stored on a unique collection in the database, as just explained. The second tab on the monitoring dashboard consists of the table showing the recent alerts collected from the e-health system (Fig. 20). This table essentially contains all the abnormal values being collected from the sensors. The provided data comprises of timestamp, patient ID, sensor type and its abnormal reading.
Fig. 20.
Recent alerts tab of monitoring dashboard.
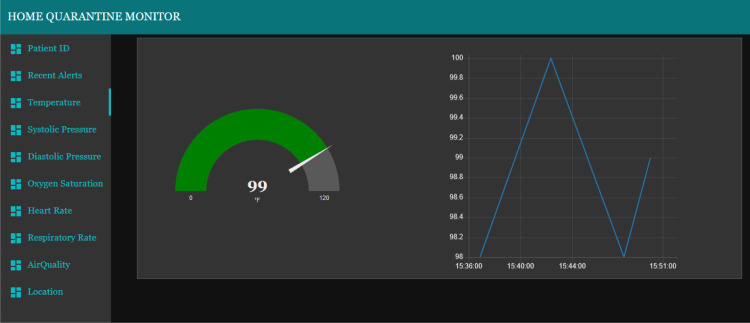
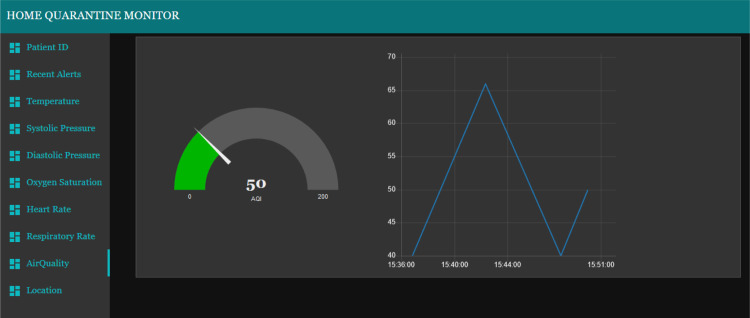
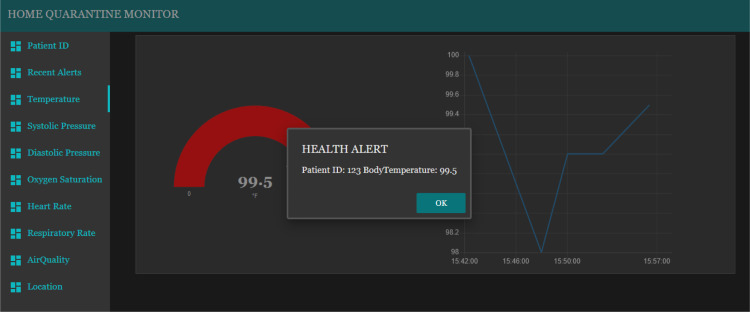
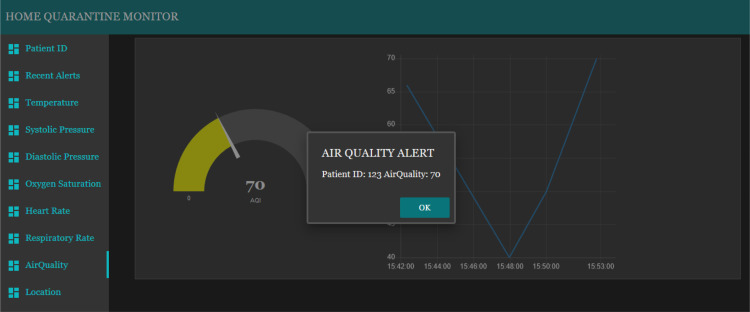
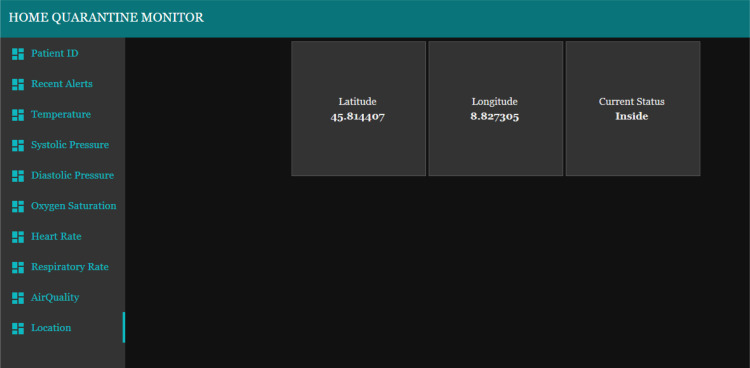
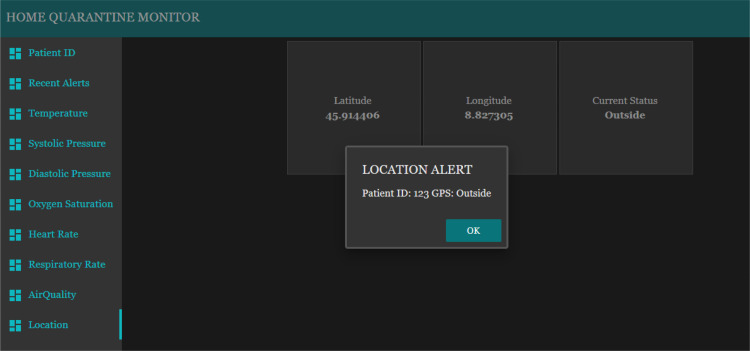
The tabs from third position to eighth position on the monitoring dashboard consist of the gauges and charts which show the live reading of each sensor type (two example are shown in Fig. 21, Fig. 23). The patient being monitored will be based on the patient ID that has been entered on the first tab. Each gauge is uniquely setup according to the unit of the value being monitored and the gauge colors change according to the value ranges. The popup alert and the audio alert would be played on the dashboard itself whenever the value of a sensor exceed or fall behind the normal ranges, as presented in Fig. 22, Fig. 24. The location tab shows three sub layouts. The first and second layouts show the latitude and longitude values, respectively. Instead, the third layout shows the current location status of the patient, which can be inside (Fig. 25) or outside (Fig. 26).
Fig. 21.
Body temperature (normal) tab of monitoring dashboard.
Fig. 23.
Air Quality (normal) tab of monitoring dashboard.
Fig. 22.
Health alert popup of monitoring dashboard.
Fig. 24.
Air Quality alert popup of monitoring dashboard.
Fig. 25.
Location (inside) tab of monitoring dashboard.
Fig. 26.
Location (outside) alert popup of monitoring dashboard.
In this way, the health-care structure and, in general, the authorized people are aware in real time of the patients’ conditions. Moreover, alarm notifications are received as soon as an abnormal value is detected.
The presented e-health system is ready to be tested connecting hardware devices, and can also be integrated with further access control systems, in order to improve the security and privacy of the whole IoT network (Sicari, Rizzardi, Grieco, Piro, & Coen-Porisini, 2017). More details on security and privacy issues are discussed in the next section.
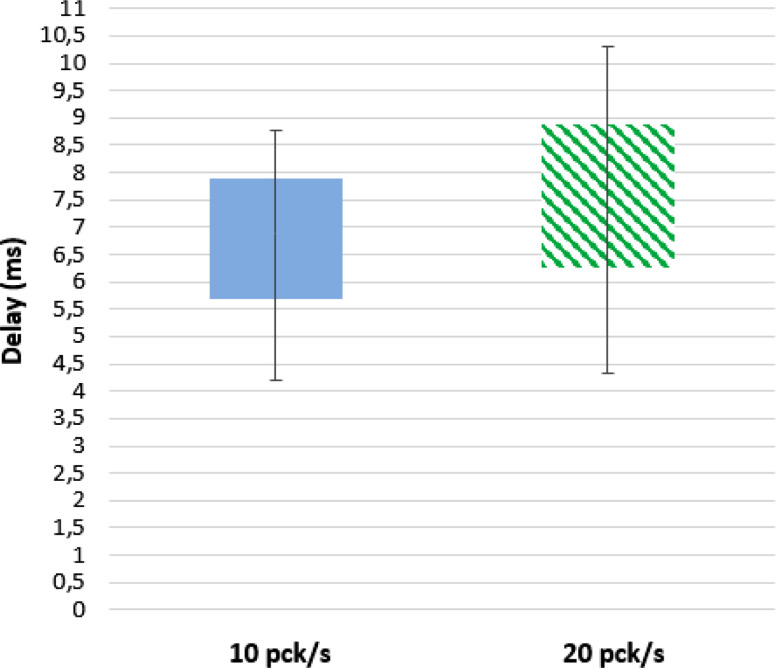
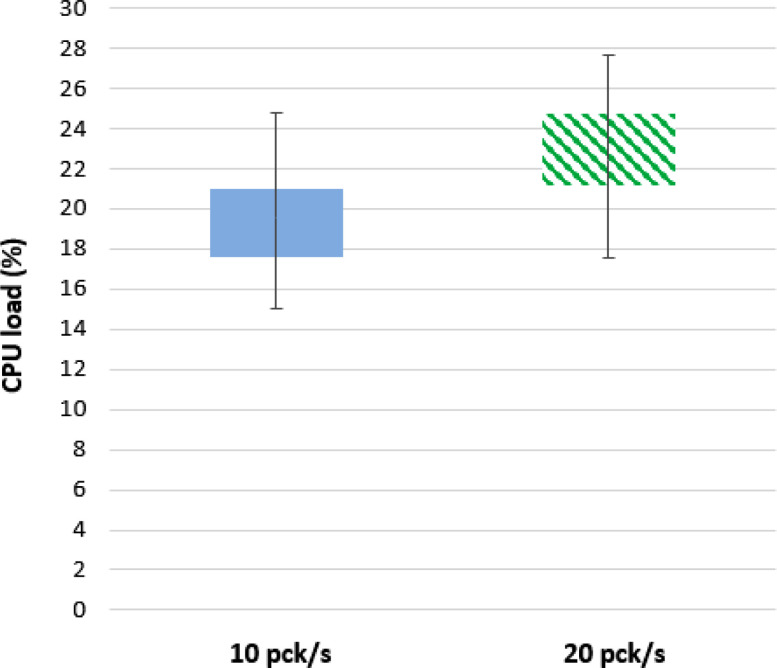
A preliminary performance assessment of the envisioned system has been conducted, by installing the Node-RED application on a Raspberry Pi 3 B equipped with 1 GB di RAM. A laptop is used to emulate the behavior of the set of nodes, which represent the monitoring devices presented in Section 4.2. Such simulated devices basically generate random data and send them to the Node-RED application as if they came from different nodes (and different patients). Laptop and Raspberry Pi communicate via a WiFi network. The duration of the simulation is set to 24 h and the packet rate is set to 10 and 20 packets per second. Fig. 27 shows the end-to-end latency of data from their generation to their availability on the visualization dashboard. Instead, Fig. 28 represents the CPU load on the Raspberry Pi. Obtained results are acceptable, but obviously the whole network infrastructure must be further assessed in a large-scale environment.
Fig. 27.
Latency: whiskers-box diagram.
Fig. 28.
CPU load: whiskers-box diagram.
5. Security discussion
In general, e-health applications manage sensitive information related to the patients’ status. Such data must be protected against tampering and violation, mainly in presence of IoT devices, which usually communicate by means of a wireless channel with the reference platform and, then, towards the health-care structure. The wireless nature of data transmissions naturally increases the risk of malicious attacks, such as identity spoofing or packets’ sniffing. In addition, the patient himself/herself must not be able to manipulate his/her data, in order to prevent, for example, the breach of the quarantine period or dangerous changing in his/her health status or in the status of people around. To cope with such emerged issues, many solutions can be integrated in system, presented in Section 4:
-
•
A clever key distribution system, along with a key replacement mechanism, are essentials for assuring the robustness of an IoT system (Sicari, Rizzardi, Miorandi, & Coen-Porisini, 2016), which should directly deal with key distribution and replacement. In this way, the credentials for the access to the resources are regulated by the IoT platform itself, which can promptly react in case of violation, by revoking one or more keys. A revoked key is no longer allowed to disclose the encrypted information.
-
•
A policy enforcement framework could be responsible for managing the interaction among the entities involved in the e-health system under well-defined policies (Sicari et al., 2017). Such policies establish the rules to be put in act for regulating the access to the resources, which are represented by the patients’ information. As an example, a patient could be authorized to visualize his/her related data, but he/she cannot modify them; otherwise, only his/her family doctor can freely access to the information related to his/her patients, while the authorization is extended to specialized structures in case of emergency (e.g., one or more alarms are set on, as explained in Section 4). Note that a policy enforcement framework runs in a parallel manner with respect to the IoT platform, and it is perfectly integrated within the IoT system, in order to intercept all the data requests and ensure the correct application of the defined rules (Sicari, Rizzardi, Miorandi, Cappiello et al., 2016). Such a kind of framework represents a step beyond the “simple” encryption of the handled information, since it adds roles and actions which can be regulated among the involved entities.
-
•
As detailed in Section 3, MQTT protocol is adopted for data sharing within the IoT system proposed herein. MQTT natively provides a limited security support; hence, it must be extended with security related functionalities, in order to be reliable. To this end, a solution is proposed in Rizzardi, Sicari, Miorandi, and Coen-Porisini (2016), where a Keys Topics Manager is responsible for ciphering the data under certain topics, following specific access control rules.
-
•
Finally, proper mechanisms for privacy protection could play a fundamental role in the widespread adoption of remote medical information systems, in general. In fact, nowadays people are very afraid of the leakage of their privacy. In this sense, besides data protection during transmission throughout the network, it is important to guarantee the reliability of access to resources also when information are persistently stored in a database/cloud. To this end, many anonymization approaches are available in literature Aggarwal et al., 2005, Braghin et al., 2008 and Salas and Domingo-Ferrer (2018), and their scope is reducing the correlation among the data and the individuals, in order to make their retrieval hard.
6. Conclusion
The Home Quarantine Patient Monitoring approach, presented in this paper, is built upon considering the scenario where the nations are struggling to assist all the COVID-19 patients in the hospital wards. Most of deaths occurred due to COVID-19 were because of the lack of proper medical care at the right time. Often the patients with mild symptoms are sent away or neglected as serious patients are occupying the limited hospital areas. The negligence could be prevented by monitoring them from their homes itself. Only hurdle is to get the live readings of their vital signs, surrounding atmosphere and their location.
The proposed e-health system helps to actively monitor the live statistics of the remote patient by any medical staff or authorized people. Apart from live readings, certain alerts are also triggered whenever the readings go high or low of certain normal ranges. All readings are simultaneously written to the database too, except when the current reading matches the previous reading. Database collections are automatically created whenever a new patient record is fetched. Such a system can surely help in lowering the heavy dependence on medical infrastructures and could deliver more efficiency in management of patients.
Towards its practical realization, proper hardware technologies (i.e., sensors) must be connected to the platform where the Node-RED application will run (e.g., a cloud or a distributed network infrastructure). The envisioned system can be further enhanced for monitoring and managing a larger scale of remote patients. Also, the dashboard can be upgraded by integrating more intuitive alerts. The facility to see the average statistics of a patient on a periodic basis would be beneficial. Average statistics of patients based on a certain locality would also increase the productivity of the whole system. Also, it is important to plan how to distinguish between missing data and repeated measurements when the real system will run.
Declaration of Competing Interest
The authors declare that they have no known competing financial interests or personal relationships that could have appeared to influence the work reported in this paper.
Footnotes
Flow-based programming for the Internet of Things”, https://nodered.org/.
Flow-based programming for the Internet of Things”, https://nodered.org/.
Node.js, http://nodejs.org/.
uHoo, Most Advanced Indoor Air Sensor, https://uhooair.com/.
UpSens, Indoor Air Sensor, https://www.upsens.com/.
MongoDB, http://www.mongodb.org/.
Mqtt v3.1 protocol specification, http://public.dhe.ibm.com/software/dw/webservices/ws-mqtt/mqtt-v3r1.html.
Mosquitto, an open source mqtt v3.1/v3.1.1 broker, http://mosquitto.org.
References
- Aggarwal G., Feder T., Kenthapadi K., Motwani R., Panigrahy R., Thomas D., et al. International conference on database theory. Springer; 2005. Anonymizing tables; pp. 246–258. [Google Scholar]
- Al-Fuqaha A., Guizani M., Mohammadi M., Aledhari M., Ayyash M. Internet of things: A survey on enabling technologies, protocols, and applications. IEEE Communications Surveys & Tutorials. 2015;17(4):2347–2376. [Google Scholar]
- Blackstock M., Lea R. Proceedings of the 5th international workshop on Web of Things. ACM; 2014. Toward a distributed data flow platform for the web of things (distributed node-red) pp. 34–39. [Google Scholar]
- Boric-Lubecke O., Gao X., Yavari E., Baboli M., Singh A., Lubecke V.M. 2014 IEEE MTT-S international microwave symposium (IMS2014) IEEE; 2014. E-healthcare: Remote monitoring, privacy, and security; pp. 1–3. [Google Scholar]
- Braghin, S., Coen-Porisini, A., Colombo, P., Sicari, S., & Trombetta, A. (2008). Introducing privacy in a hospital information system. In Proceedings of the fourth international workshop on software engineering for secure systems (pp. 9–16).
- Castellani A.P., Bui N., Casari P., Rossi M., Shelby Z., Zorzi M. Pervasive computing and communications workshops (PERCOM workshops), 2010 8th IEEE international conference on. IEEE; 2010. Architecture and protocols for the internet of things: A case study; pp. 678–683. [Google Scholar]
- Christaki E. New technologies in predicting, preventing and controlling emerging infectious diseases. Virulence. 2015;6(6):558–565. doi: 10.1080/21505594.2015.1040975. [DOI] [PMC free article] [PubMed] [Google Scholar]
- Hamzah F.B., Lau C., Nazri H., Ligot D., Lee G., Tan C., et al. CoronaTracker: Worldwide COVID-19 outbreak data analysis and prediction. Bull World Health Organ. 2020;1:32. [Google Scholar]
- Hollander J.E., Carr B.G. Virtually perfect? Telemedicine for COVID-19. New England Journal of Medicine. 2020;382(18):1679–1681. doi: 10.1056/NEJMp2003539. [DOI] [PubMed] [Google Scholar]
- Lekic M., Gardasevic G. 2018 17th international symposium INFOTEH-JAHORINA (INFOTEH) 2018. Iot sensor integration to node-RED platform; pp. 1–5. [DOI] [Google Scholar]
- Luo J., Chen Y., Tang K., Luo J. 2009 international conference on future biomedical information engineering (FBIE) IEEE; 2009. Remote monitoring information system and its applications based on the internet of things; pp. 482–485. [Google Scholar]
- Maghdid H.S., Ghafoor K.Z., Sadiq A.S., Curran K., Rabie K. 2020. A novel ai-enabled framework to diagnose coronavirus covid 19 using smartphone embedded sensors: Design study. arXiv preprint arXiv:2003.07434. [Google Scholar]
- Moazzami B., Razavi-Khorasani N., Moghadam A.D., Farokhi E., Rezaei N. Covid-19 and telemedicine: Immediate action required for maintaining healthcare providers well-being. Journal of Clinical Virology. 2020 doi: 10.1016/j.jcv.2020.104345. [DOI] [PMC free article] [PubMed] [Google Scholar]
- Nasajpour M., Pouriyeh S., Parizi R.M., Dorodchi M., Valero M., Arabnia H.R. 2020. Internet of Things for current COVID-19 and future pandemics: An exploratory study. arXiv preprint arXiv:2007.11147. [DOI] [PMC free article] [PubMed] [Google Scholar]
- Nguyen T.T. 2020. Artificial intelligence in the battle against coronavirus (COVID-19): a survey and future research directions. Preprint, DOI, 10. [Google Scholar]
- Nussbaumer-Streit B., Mayr V., Dobrescu A.I., Chapman A., Persad E., Klerings I., et al. Quarantine alone or in combination with other public health measures to control COVID-19: a rapid review. Cochrane Database of Systematic Reviews. 2020;(4) doi: 10.1002/14651858.CD013574. [DOI] [PMC free article] [PubMed] [Google Scholar]
- Ohannessian R., Duong T.A., Odone A. Global telemedicine implementation and integration within health systems to fight the COVID-19 pandemic: a call to action. JMIR Public Health and Surveillance. 2020;6(2) doi: 10.2196/18810. [DOI] [PMC free article] [PubMed] [Google Scholar]
- Parker, Z., Poe, S., & Vrbsky, S. V. (2013). Comparing nosql mongodb to an sql db. In Proceedings of the 51st ACM Southeast conference (pp. 1–6).
- Portnoy J., Waller M., Elliott T. Telemedicine in the era of COVID-19. The Journal of Allergy and Clinical Immunology: In Practice. 2020;8(5):1489–1491. doi: 10.1016/j.jaip.2020.03.008. [DOI] [PMC free article] [PubMed] [Google Scholar]
- Rahman M.S., Peeri N.C., Shrestha N., Zaki R., Haque U., Ab Hamid S.H. Defending against the Novel Coronavirus (COVID-19) Outbreak: How Can the Internet of Things (IoT) help to save the World? Health Policy and Technology. 2020 doi: 10.1016/j.hlpt.2020.04.005. [DOI] [PMC free article] [PubMed] [Google Scholar]
- Rizzardi A., Sicari S., Miorandi D., Coen-Porisini A. AUPS: An open source authenticated publish/subscribe system for the internet of things. Information Systems. 2016;62:29–41. [Google Scholar]
- Salas J., Domingo-Ferrer J. Some basics on privacy techniques, anonymization and their big data challenges. Mathematics in Computer Science. 2018;12(3):263–274. [Google Scholar]
- Sicari S., Rizzardi A., Coen-Porisini A. How to evaluate an internet of things system: Models, case studies, and real developments. Software - Practice and Experience. 2019;49(11):1663–1685. [Google Scholar]
- Sicari S., Rizzardi A., Grieco L., Piro G., Coen-Porisini A. A policy enforcement framework for Internet of Things applications in the smart health. Smart Health. 2017;3:39–74. [Google Scholar]
- Sicari S., Rizzardi A., Miorandi D., Cappiello C., Coen-Porisini A. Security policy enforcement for networked smart objects. Computer Networks. 2016;108:133–147. [Google Scholar]
- Sicari, S., Rizzardi, A., Miorandi, D., & Coen-Porisini, A. (2016). Internet of Things: Security in the keys. In Proceedings of the 12th ACM symposium on qos and security for wireless and mobile networks (pp. 129–133).
- Singh R.P., Javaid M., Haleem A., Suman R. Internet of things (IoT) applications to fight against COVID-19 pandemic. Diabetes & Metabolic Syndrome: Clinical Research & Reviews. 2020 doi: 10.1016/j.dsx.2020.04.041. [DOI] [PMC free article] [PubMed] [Google Scholar]
- Ting D.S.W., Carin L., Dzau V., Wong T.Y. Digital technology and COVID-19. Nature Medicine. 2020;26(4):459–461. doi: 10.1038/s41591-020-0824-5. [DOI] [PMC free article] [PubMed] [Google Scholar]
- Tomasic I., Khosraviani K., Rosengren P., Jornten-Karlsson M., Linden M. 2018 41st international convention on information and communication technology, electronics and microelectronics (MIPRO) 2018. Enabling IoT based monitoring of patients’ environmental parameters: Experiences from using OpenMote with OpenWSN and Contiki-NG; pp. 0330–0334. [DOI] [Google Scholar]
- Tomasic I., Tomasic N., Trobec R., Krpan M., Kelava T. Continuous remote monitoring of COPD patients-justification and explanation of the requirements and a survey of the available technologies. Medical & Biological Engineering & Computing. 2018;56(4):547–569. doi: 10.1007/s11517-018-1798-z. [DOI] [PMC free article] [PubMed] [Google Scholar]
- Wosik J., Fudim M., Cameron B., Gellad Z.F., Cho A., Phinney D., et al. Telehealth transformation: COVID-19 and the rise of virtual care. Journal of the American Medical Informatics Association. 2020;27(6):957–962. doi: 10.1093/jamia/ocaa067. [DOI] [PMC free article] [PubMed] [Google Scholar]
- Zhou W., Piramuthu S. 2014 9th Iberian conference on information systems and technologies (CISTI) IEEE; 2014. Security/privacy of wearable fitness tracking IoT devices; pp. 1–5. [Google Scholar]


