Abstract
Background
Lung adenocarcinoma (LUAD) is the leading cause of cancer‐related deaths worldwide. Therefore, the identification of a novel prediction signature for predicting the prognosis risk and survival outcomes is urgently demanded.
Methods
We integrated a machine‐learning frame by combing the Cox regression and Least Absolute Shrinkage and Selection Operator (LASSO) regression model to identify the LUAD‐related long non‐coding RNA (lncRNA) survival biomarkers. Subsequently, the Spearman correlation test was employed to interrogate the relationships between lncRNA signature and tumor immunity and constructed the competing endogenous RNA (ceRNA) network.
Results
Herein, we identified an eight‐lncRNA signature (PR‐lncRNA signature, NPSR1‐AS1, SATB2‐AS1, LINC01090, FGF12‐AS2, AC005256.1, MAFA‐AS1, BFSP2‐AS1, and CPC5‐AS1), which contributes to predicting LUAD patient's prognosis risk and survival outcomes. The PR‐lncRNA signature has also been confirmed as the robust signature in independent datasets. Further parsing of the LUAD tumor immune infiltration showed the PR‐lncRNAs were closely associated with the abundance of multiple immune cells infiltration and the expression of MHC molecules. Furthermore, by constructing the PR‐lncRNA–related ceRNA network, we interrogated more potential anti‐cancer therapy targets.
Conclusion
lncRNAs, as emerging cancer biomarkers, play an important role in a variety of cancer processes. Identification of PR‐lncRNA signatures allows us to better predict patient's survival outcomes and disease risk. Finally, the PR‐lncRNA signatures could help us to develop novel LUAD anti‐cancer therapeutic strategies.
Keywords: long non‐coding RNA, lung adenocarcinoma, machine learning, prognosis, tumor immunoactivity
The PR‐lncRNA signature (NPSR1‐AS1, SATB2‐AS1, LINC01090, FGF12‐AS2, AC005256.1, MAFA‐AS1, BFSP2‐AS1, and CPC5‐AS1) could contribute to predicting LUAD patient prognosis risk and survival outcomes and be closely associated with the abundance of multiple immune cell infiltration and the expression of MHC molecules in LUAD.
1. INTRODUCTION
Lung cancer is the most common cause of cancer‐related death worldwide, with a 5‐year survival rate of about 16.6%, in which lung adenocarcinoma (LUAD) is one of the most common types of lung cancers. 1 , 2 For LUAD patients, early surgical resection is currently the standard treatment. After surgical intervention, additional chemotherapy will contribute to further improve patient's survival rate. 3 However, nearly half of all LUAD patients experience a relapse and will die as a result of the disease recurrence. 4 Therefore, identification of a novel prediction signature for predicting the prognosis and high‐risk group of LUAD patients is urgently demanded.
Currently, histopathology images serve as the golden standard for the diagnosis of lung cancer primarily evaluated by pathologists or doctors. Since, this process is time‐consuming and is influenced by the subjective judgment of the observer, identifying new biomarkers will facilitate the detection of lung cancer with improved patient's survival outcomes. 5 Non‐coding RNAs (ncRNAs) are a class of RNA molecules without protein‐coding potential. Long non‐coding RNA (lncRNA) is defined as an ncRNA of at least 200 nucleotides (nt) in length that molecularly resemble mRNA. 6 , 7 Accumulating evidence indicates that lncRNAs exert important regulatory functions on gene expression at the transcriptional, post‐transcriptional, and epigenetic levels. 8 , 9 , 10 Recently, lncRNAs as emerging cancer biomarkers have been used in the diagnosis and prediction of survival in multiple cancer types. 11 , 12 Fox example, lncRNA LNBC3 facilitates non‐small cell lung cancer progression by stabilizing BCL6; 13 overexpressed lncRNA LINC00691 was a poor prognosis biomarkers in lung cancer. 14 Hence, in this study, we developed a set of lncRNA signature to improve the patient's survival outcomes of LUAD.
Herein, we integrated the Cox regression and Least Absolute Shrinkage and Selection Operator (LASSO) regression model discovering an eight‐lncRNA signature (NPSR1‐AS1, SATB2‐AS1, LINC01090, FGF12‐AS2, AC005256.1, MAFA‐AS1, BFSP2‐AS1, and CPC5‐AS1) for improving prognosis prediction for LUAD patient. Next, the lncRNA signature has been confirmed as the robust prognosis‐related lncRNAs in independent datasets. Notably, we also found the lncRNA signature was associated with the abundance of multiple immune‐cell infiltration. Finally, we also constructed the lncRNA signature‐related competing endogenous RNA (ceRNA) network for identifying more potential therapy targets for LUAD.
2. MATERIALS AND METHODS
2.1. Data acquisition and pre‐processing
The Cancer Genome Atlas (TCGA) level 3 gene/lncRNA/miRNA expression data (n = 585, 526 cancer samples, 59 normal samples), and clinical data (527 patients) of LUAD were obtained from the Genomic Data Commons (GDC, available at https://www.cancer.gov/tcga). The GSE31210 independent LUAD datasets were obtained from publicly available Gene Expression Omnibus (GEO, available at https://www.ncbi.nlm.nih.gov/geo/)(15). For the gene/lncRNA/miRNA expression data, we removed the genes/lncRNAs that were not expressed over 70% of the samples.
2.2. Differential expression analysis of lncRNAs
We calculated the fold change (FC) of each lncRNA between cancer and normal samples, that is, , where and represent the mean expression of an lncRNA in cancer or normal samples, respectively. Then, we employed the Mann–Whitney U test to test whether the lncRNA expression was differentially expressed in cancer (H0 : there was no difference between cancer and normal samples). The lncRNAs with P‐value <0.05 and |FC| >1.5 were considered as the differentially expressed lncRNAs.
2.3. Identification of prognosis‐related lncRNA signature
We first randomly sub‐grouped the TCGA LUAD cancer samples into the training set and test set (70% and 30% of cancer samples, respectively). The univariate Cox regression that was operated in the R package Survival (v3.1–12) was employed on the training set to evaluate the correlation between the lncRNA expression levels and the patient's overall survival (OS). 16 Then, we constructed the Least Absolute Shrinkage and Selection Operator (LASSO) regression model by R package glmnet (v4.0–2) to further screen the prognosis‐related lncRNA signature (PR‐lncRNA). 17 , 18 The features selected by the LASSO model were used to fit for a multivariate Cox risk regression model, where OS is the dependent variable and other clinical information is the covariate. Finally, the lncRNA with P‐value <0.01 as the PR‐lncRNA signature, which is significantly contributed to the LUAD patient's survival outcomes. The whole pipeline above was also performed in the test set and an independent dataset (GSE31210 15 ) to confirm the PR‐lncRNA signature was robust.
2.4. Functional enrichment analysis
Pearson correlation analysis was used to evaluate the co‐expression relationship between lncRNA signature and mRNAs. The significant co‐related mRNAs were used to annotate the biological functions of lncRNAs (p‐value <0.05). The functional enrichment analysis was performed by the R package clusterProfiler (3.16.1). 19
2.5. Survival analysis
Kaplan‐Meier survival curve 20 that was operated in the R package survminer (v0.4.8) was used to prove the difference of overall survival (OS) between the high‐risk group and low‐risk group, and the bilateral logarithmic rank test was used to evaluate whether it was statistically significant. 21 The risk score for each patient was calculated according to the linear combination of expression values weighted by the coefficient from the multivariate (univariate) Cox regression analysis:
where n denotes the number of the PR‐lncRNA signature (n = 8), represents the coefficient of univariate Cox regression analysis when n = 1, was the coefficient of multivariate Cox regression analysis when n > 1, was the expression level of kth PR‐lncRNA expression of patient i. The median risk score was used as the cut‐off to divide patients into high‐ and low‐risk groups.
2.6. Tumor immunoactivity analysis
We first characterized the immune‐cell infiltration abundance using the TIMER. 22 Next, we calculated Spearman's correlation between the immune‐cell abundance and the expression levels of PR‐lncRNA used R package stats (v4.0.2). The immune‐cell pathway enrichment was performed by the Immlnc (http://bio‐bigdata.hrbmu.edu.cn/ImmLnc/).
2.7. Construction of competing endogenous RNA regulatory network
We first identified the differentially expressed miRNAs and mRNAs in LUAD using the Mann–Whitney U test (p < 0.05). Next, we calculated the coupled Spearman's correlation coefficient (rho) among the expression levels of miRNAs, PR‐lncRNAs, and mRNAs. The raw P‐values () were adjusted by multiple hypotheses using a permutation method. For each lncRNA, the expression value was held consistent, and 10,000 random miRNAs and mRNAs were used to perform the same Spearman's correlation test, generating sets of 10,000 permutation P‐values (). Then, the empirical P‐value () was corrected, that is,
which introduces a pseudo‐count of 1. The significantly positively correlated lncRNA‐mRNA pairs ( and ), and negatively correlated miRNA‐lncRNA and miRNA‐mRNA pairs ( and ) were integrated as the miRNA‐lncRNA‐mRNA regulatory axes. 23 The ceRNA network was visualized using the Cytoscape. 24
2.8. Statistical analysis
All analyses were conducted using R (v3.6.3) software.
3. RESULTS
3.1. An eight‐lncRNA signature shows association with the prognosis of LUAD
Long non‐coding RNA (lncRNA) is an emerging biomarker, which played an important role in cancer development. 25 To explore the role of lncRNA in LUAD patient survival, we first identified the differentially expressed lncRNAs between LUAD cancer and normal samples (See the Methods section). A total of 309 up‐regulated and 119 down‐regulated lncRNAs were recognized (Figure 1A). Next, we developed a computational model by combing the LASSO regression and Cox regression models to identify the prognosis‐related lncRNA (PR‐lncRNA) signature (Figure 1B‐C, see the ‘Methods’ section). The PR‐lncRNA signature consisting of eight lncRNAs (NPSR1‐AS1, SATB2‐AS1, LINC01090, FGF12‐AS2, AC005256.1, MAFA‐AS1, BFSP2‐AS1, and CPC5‐AS1), contributed to the LUAD patient survival outcomes. Of them, NPSR1‐AS1, SATB2‐AS1, FGF12‐AS2, and AC005256.1 could be acted as the poor prognosis markers, while LINC01090, MAFA‐AS1, BFSP2‐AS1, and CPC5‐AS1 were treated as the protective factors for survival in LUAD patients. In the previous studies, NPSR1‐AS1 had been reported as the poor prognosis markers for LUAD 26 ; SATB2‐AS1 could be broadly involved in multiple cancer development 27 , 28 , 29 ; FGF12‐AS2 may be served as a potential target for the treatment of non‐small‐cell lung carcinoma. 30 The evidence further highlighted the PR‐lncRNA signature might exert an essential contribution for LUAD processes and have the potential clinical utility.
FIGURE 1.
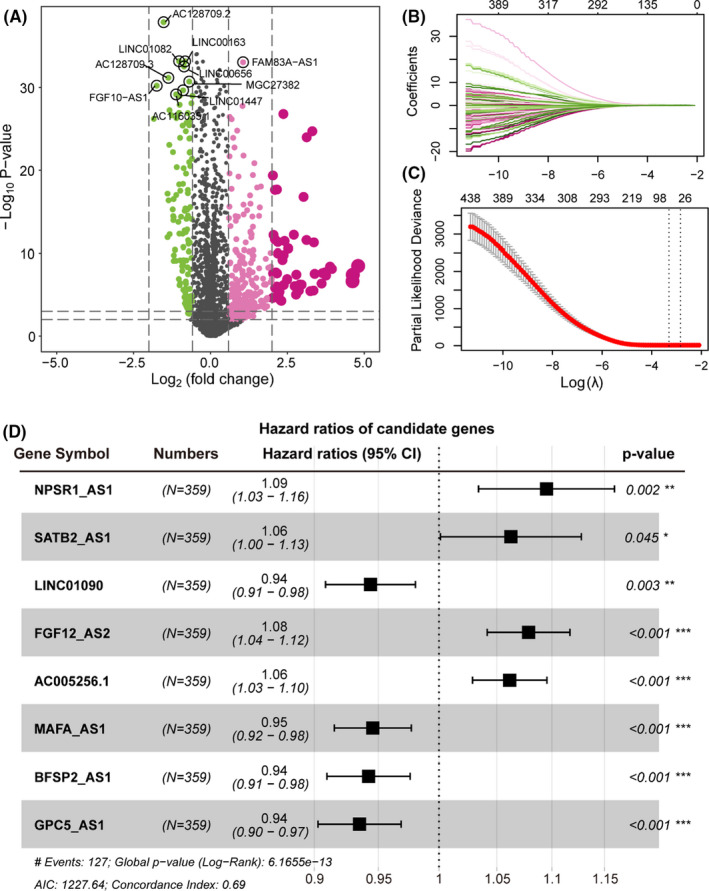
The PR‐lncRNAs contributes to patient survival outcomes in LUAD. (A) Volcano plot showing the differentially expressed lncRNAs in LUAD. x‐axis represents the log2(Fold Change). Y‐axis shows the log10(p‐value). (B‐C) Lasso regression model screened characteristic lncRNA. Variation curve of regression coefficient and β value. (D) Forest plot of multivariate Cox regression results, which include p‐value and confidence interval of hazard ratios
3.2. The PR‐lncRNA signature contributes to the patient survival outcome prediction
We next used the nomogram method to build a more intuitive prediction model of one‐ and three‐year survival time probability based on the PR‐lncRNA expression. Under the same gene expression fluctuations, the scores of the PR‐lncRNAs that are more important to the patient's survival will rise (Figure 2A). The calibration curve also showed that there was a good prediction capability for the one‐ and three‐year survival time probability (Figure 2B). Besides, the Receiver Operating Characteristic (ROC) curve reflected that the sensitivity and specificity of the PR‐lncRNA predictive model. We observed the promising potential for predicting patient's survival outcomes (Figure 2C). These results suggested that the PR‐lncRNA signature was a reliable biomarker contributing to the LUAD patient's survival outcomes.
FIGURE 2.
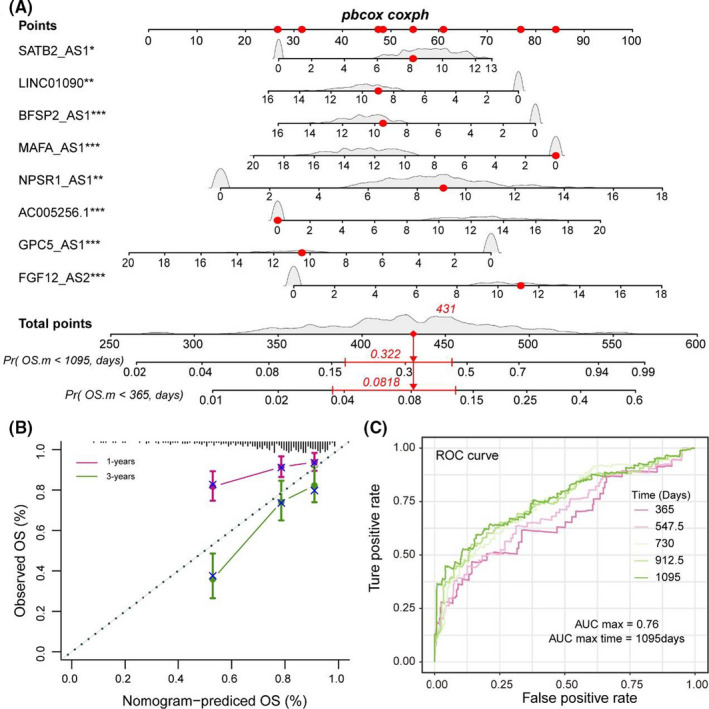
PR‐lncRNA signature could act as the promising survival biomarker of LUAD patient. (A) Nomogram showing the prediction model of survival probability. (B) Calibration curve of nomogram. (C) ROC curve reflecting the performance of the Cox regression model in predicting the probability of survival of patients at different time nodes
3.3. PR‐lncRNA signature prompts LUAD patients' risk score
We next constructed the risk scoring model based on the multivariate Cox regression analysis and patient's overall survival (OS) time (see the ‘Methods’ section). 31 , 32 The risk scoring model could be expressed as Risk score = (0.070 * NPSR1‐AS1 + 0.067 * SATB2‐AS1‐0.057 * LINC01090 + 0.076 * FGF12‐AS2 + 0.498 * AC005256.1 – 0.040 * MAFA‐AS1 ‐ 0.044 * BFSP2‐AS1 ‐ 0.040 * GPC5‐AS1). Based on the model above, we calculated the risk score for each patient in the TCGA training set. The samples were subsequently divided into the high‐risk group (n = 179) and low‐risk group (n = 180) by considering the median values of all patients' risk scores as the cut‐off point. We found there was an obvious survival difference between the high‐ and low‐risk group (Figure 3A) and the risk score was also a poor prognosis marker in LUAD (p < 0.0001) (Figure 3B). The same results were also repeated in the TCGA test set, implying the PR‐lncRNA signature was a robust survival‐related biomarker (Figure 3CandD).
FIGURE 3.
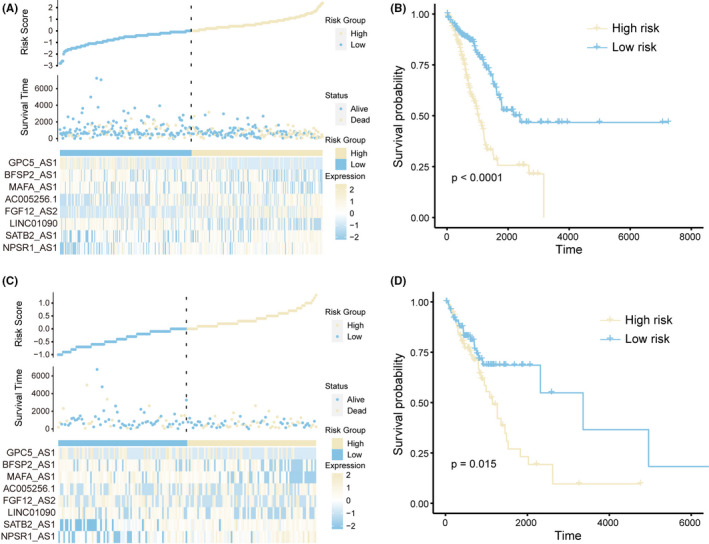
PR‐lncRNA signature is associated with the patient risk score in LUAD. A‐B. Risk scores, survival status, the expression of PR‐lncRNA signature (A), and Kaplan‐Meier curves (B) for two groups in the training set. C‐D. Risk scores, survival status, the expression of PR‐lncRNA signature (C), and Kaplan‐Meier curves (D) for two groups in the test set
3.4. Evaluation of the PR‐lncRNA signature robustness for LUAD patient survival risk
To further confirm the PR‐lncRNA signature is a robust biomarker in LUAD, we employed the risk scoring model in an independent LUAD dataset (GSE31210, 15 n = 246). Consistent with the results in the TCGA cohort, the risk score was also identified as a poor prognosis marker (p = 0.027) (Figure 4A‐B). Moreover, the overexpressed PR‐lncRNAs NPSR1‐AS1 (p = 0.0084) and STB2‐AS1 (p = 0.0015) were also closely associated with the shorter survival times (Figure 4C‐D). Furthermore, by exploring the relationships between the disease stages and patient's risk score, we found the more advanced disease stages usually presented the higher the PR‐lncRNA risk score (Figure 4E). These results further supported that the PR‐lncRNA signature was a robust prognosis indicator in LUAD.
FIGURE 4.
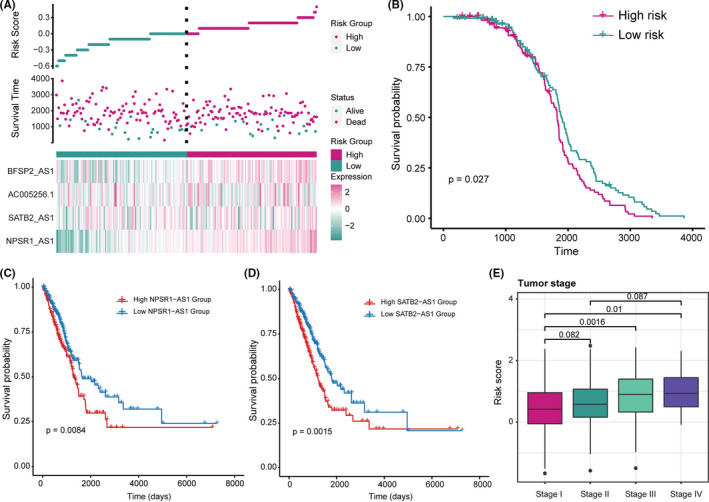
PR‐lncRNA signature is a robust prognosis indicator in LUAD. A‐B. Risk scores, survival status, the expression of PR‐lncRNA signature (A), and Kaplan‐Meier curves (B) for two groups in the GSE31210. C‐D. The Kaplan‐Meier curves of the high‐/low‐ expression group of NPSR1‐AS1 (C) and STB2‐AS1 (D) in the GSE31210 cohort. Patients were divided by the median expression value of lncRNA. E. Boxplot showing the relationship between LUAD disease stages and patients’ PR‐lncRNA risk score. The p‐values were calculated by the Mann–Whitney U test
3.5. PR‐lncRNA signature shows crosstalk with the tumor immunoactivity
To investigate the role of PR‐lncRNA signature in the tumor immune microenvironment, we systemically analyze the correlation between PR‐lncRNA expression and immune‐cell infiltration abundance. Notably, the PR‐lncRNAs generally showed significant correlations with multiple immune‐cell infiltration abundance. Of them, PR‐lncRNA BFSP2‐AS1 exhibited significant associations with multiple immune cells, that is, B cell, CD4+ T cell, CD8+ T cell, Dendritic, Macrophage, and Neutrophil, implying BFSP2‐AS1 may be an immune‐related lncRNA in LUAD (Figure 4A). Besides, we also performed the immune pathway enrichment analysis using the Immlnc 33 and constructed the PR‐lncRNAs and immune pathway network (Figure 5B). In the network, we observed the PR‐lncRNAs AC005256.1 and SATB2‐AS1 were engaged in the greatest number of immune pathways. Both of them could be involved in the Antimicrobials, Cytokines, and Antigen Processing and Presentation pathways. Additionally, AC005256.1 was involved in the Cytokine Receptors pathway, SATB2‐AS1 was specifically enriched in the Chemokines pathways (Figure 5B). The previous study has been demonstrated that SATB2‐AS1 could inhibit tumor metastasis and affects the tumor immune‐cell microenvironment in colorectal cancer by regulating SATB2 expression. 34 Furthermore, the PR‐lncRNAs showed correlations with the expression levels of Major Histocompatibility Complex (MHC). MHC class Ⅰ and MHC class Ⅱ are mainly responsible for the antigen presentation required for tumor cell recognition and subsequent T cell‐mediated killing. 35 We found the PR‐lncRNA signature was also closely associated with the expression levels of MHC class Ⅰ (Figure 5C) and MHC class Ⅱ (Figure 5D), implying the PR‐lncRNAs may be involved in the tumor immunoactivity alterations. In summary, these results indicated that PR‐lncRNAs were immune‐related lncRNAs and showed crosstalk with the LUAD tumor immunoactivity.
FIGURE 5.
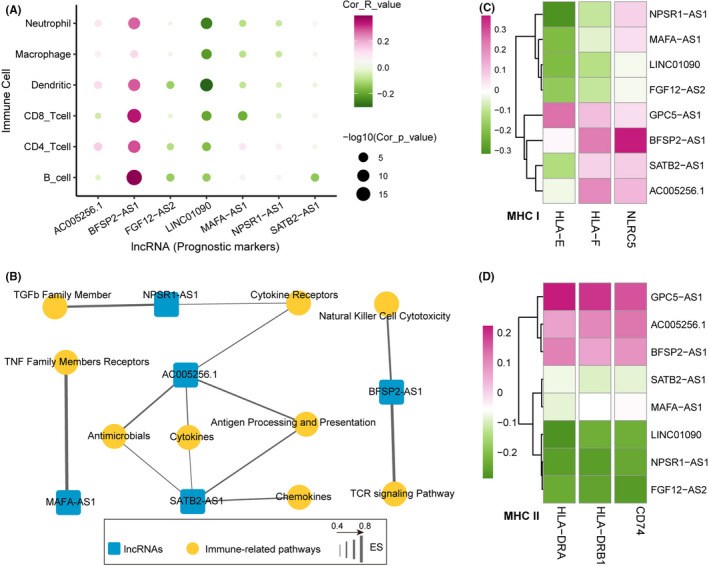
PR‐lncRNAs are LUAD tumor immunoactivity‐related lncRNAs. A. Bubble plot showing the correlation between tumor immune‐cell abundance and the expression of PR‐lncRNA. B. Network diagram showing the immune‐related pathway and PR‐lncRNA associations. C‐D. Heatmaps showing the correlation between the expression levels of MHC and PR‐lncRNAs. (C) MHC‐I, (D) MHC‐II. The p‐values were calculated by Spearman's correlation test
3.6. PR‐lncRNA related competing endogenous RNA identifies potential therapy targets
To better understand the biological functions of PR‐lncRNAs, we explored the PR‐lncRNA‐related competing endogenous RNA (ceRNA) regulatory pattern. We identified the miRNA‐lncRNA‐mRNA regulatory axis to constructed the PR‐lncRNA‐related ceRNA network (Figure 6A, see the ‘Methods’ section). The network contented two miRNAs, one lncRNA, and eight mRNAs comprising 14 ceRNA axes. Notably, only PR‐lncRNA NPSR1‐AS1 was recognized as the partner of the ceRNA axis, implying its importance for understanding the LUAD development at molecular levels. Subsequently, we systemically annotated the biological pathways involved in the mRNAs in the ceRNA network (Figure 6B). Remarkably, mRNA KRAS was engaged in multiple KEGG pathways, such as the mTOR signaling pathway, PI3K‐Akt pathway, VEGF signaling pathway, Longevity regulating pathway, etc. Previous studies have also demonstrated KRAS was an oncogene in various cancer types. 36 , 37 Therefore, we next focused on the KRAS‐related ceRNA axis (has‐miR‐365a‐3p ‐ NPSR1‐AS1 ‐ KRAS). The KRAS expression was significantly up‐regulated in LUAD (Figure 6C) and positively correlated with the NPSR1‐AS1 expression that was also significantly up‐regulated in LUAD (Figure 6D and E), indicating they were co‐expressed in LUAD. Besides, the has‐miR‐365a‐3p expression was negatively associated with the expression levels of NPSR1‐AS1 (Figure 6F) and KRAS (Figure 6G), which also significantly elevated (Figure 6H). All these implying that there was a potential competing relationship between NPSR1‐AS1 and KRAS for has‐miR‐365a‐3p. Finally, overexpressed KRAS was also identified as a poor prognosis biomarker in the TCGA LUAD cohort and GSE50081 cohort (Figure 6I and J). These results highlighted PR‐lncRNA related ceRNA axis was a promising potential therapy target for LUAD treatment.
FIGURE 6.
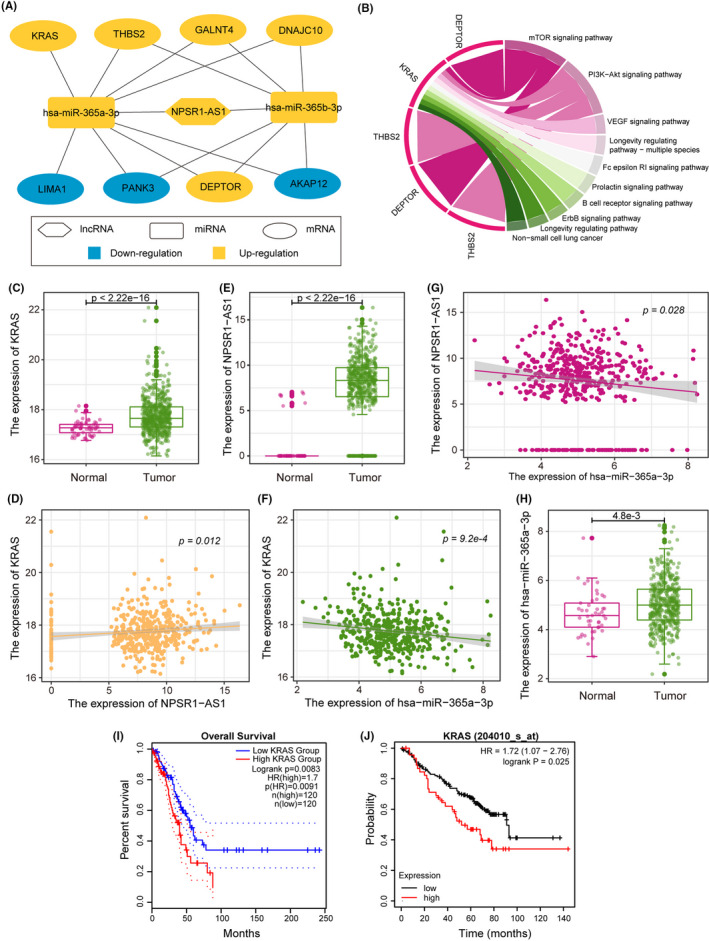
Integrative PR‐lncRNA related ceRNA analysis. A. ceRNA network showing the competing endogenous RNA relationships among PR‐lncRNAs, microRNAs, and mRNAs. B. Circos plot showing the key mRNA‐associated KEGG pathways. C‐H. The hsa‐miR‐365a‐3p‐NPSR1‐AS1‐KRAS axis in LUAD. The p‐values were calculated by the Mann–Whitney U test (C), (E), and (H) and Spearman's correlation test (D), (F), and (G). I‐J. The KM curve showing the patient survival outcome of high‐/low‐ expression of KRAS in TCGA LUAD (I) and GSE50081 (J)
4. DISCUSSION
Accumulating evidence suggested that the lncRNAs were promising biomarkers for predicting patients’ survival outcomes in multiple cancers. 38 , 39 Identification of novel lncRNA signatures would lead to facilitate improving the tumor detection and prognosis treatment. LUAD, a common poor prognosis type of lung cancer, has a patient 5‐year survival rate of only 16.6%. Herein, we integrated Cox regression and LASSO regression models discovering an eight‐lncRNA signature (PR‐lncRNA signature) that was closely related to patient's prognosis outcomes. The PR‐lncRNA signature as a robust prognostic marker for LUAD demonstrated a favorable ability to predict patient's survival outcome and prognostic risk.
Previous studies have demonstrated tumor immune‐cell infiltration plays an important role in the development and progression of cancer. 40 , 41 The survival outcome of LUAD patients is closely related to the level of tumor immune‐cell infiltration. 42 Notably, we also found the PR‐lncRNAs showed crosstalk with multiple immune‐cell infiltration abundances, such as B cell, CD4+ T cell, CD8+ T cell, Dendritic, Macrophage, and Neutrophil. Further parsing of immune pathway enrichment analysis suggested that PR‐lncRNAs could be involved in various immune‐related pathways. Finally, we also observed the expression levels of PR‐lncRNAs were associated with the Major Histocompatibility Complex (MHC), implying they might participate in antigen presentation required for tumor cell recognition and subsequent T cell‐mediated killing. 35
LncRNAs have sophisticated functions through various pathways, and the ceRNA hypothesis complicates the relationship between miRNAs, lncRNAs, and mRNAs. 43 In this study, we also constructed a ceRNA network for the PR‐lncRNA signature. The analysis highlighted the PR‐lncRNA NPSR1‐AS1 was an essential ceRNA biomarker for LUAD survival outcomes. We found NPSR1‐AS1‐related ceRNA regulatory axis (has‐miR‐365a‐3p ‐ NPSR1‐AS1 ‐ KRAS) could be involved in multiple cancer‐related pathways. And the oncogene KRAS was also identified in various cancer types. 36 , 37 These results indicated that the PR‐lncRNA related ceRNA network will be contributed to finding more anticancer therapy targets.
In summary, our study identified a set of eight‐lncRNA signature, which contributes to predicting the LUAD patients' prognosis risk and survival outcomes. The lncRNA signature has been characterized to be closely associated with the abundance of multiple immune cells infiltration and the expression of MHC molecules. Finally, by constructing a ceRNA network, we found more PR‐lncRNA‐related anti‐cancer therapy targets.
CONFLICTS OF INTEREST
The authors declared no potential conflicts of interest in terms of the research, authorship, and/or publication of this article.
AUTHOR CONTRIBUTIONS
Y.C. and X.Z. performed analysis. J.L. collected the dataset. M.Z. designed the study. All authors read and approved the final manuscript.
CONSENT FOR PUBLICATION
Not applicable.
ACKNOWLEDGMENTS
The authors gratefully thank the TCGA and GEO for providing data for this work.
Chen Y, Zhang X, Li J, Zhou M. Immune‐related eight‐lncRNA signature for improving prognosis prediction of lung adenocarcinoma. J Clin Lab Anal. 2021;35:e24018. 10.1002/jcla.24018
DATA AVAILABILITY STATEMENT
All the data used in the manuscript can be available in TCGA and GEO.
REFERENCES
- 1. Ettinger DS, Akerley W, Bepler G, et al. Non‐small cell lung cancer. J Natl Compr Canc Netw. 2010;8(7):740‐801. [DOI] [PubMed] [Google Scholar]
- 2. Siegel R, Ma J, Zou Z, Jemal A. Cancer statistics, 2014. CA Cancer J Clin. 2014;64(1):9‐29. [DOI] [PubMed] [Google Scholar]
- 3. Liang Y, Wakelee HA. Adjuvant chemotherapy of completely resected early stage non‐small cell lung cancer (NSCLC). Transl Lung Cancer Res. 2013;2(5):403‐410. [DOI] [PMC free article] [PubMed] [Google Scholar]
- 4. Crinò L, Weder W, van Meerbeeck J, Felip E. Early stage and locally advanced (non‐metastatic) non‐small‐cell lung cancer: ESMO Clinical Practice Guidelines for diagnosis, treatment and follow‐up. Ann Oncol. 2010;21:v103‐v115. [DOI] [PubMed] [Google Scholar]
- 5. Cui L, Li H, Hui W, et al. A deep learning‐based framework for lung cancer survival analysis with biomarker interpretation. BMC Bioinformatics. 2020;21(1):112. [DOI] [PMC free article] [PubMed] [Google Scholar]
- 6. Wilusz JE, Sunwoo H, Spector DL. Long noncoding RNAs: functional surprises from the RNA world. Genes Dev. 2009;23(13):1494‐1504. [DOI] [PMC free article] [PubMed] [Google Scholar]
- 7. Ulitsky I. Evolution to the rescue: using comparative genomics to understand long non‐coding RNAs. Nat Rev Genet. 2016;17(10):601‐614. [DOI] [PubMed] [Google Scholar]
- 8. Mercer TR, Dinger ME, Mattick JS. Long non‐coding RNAs: insights into functions. Nat Rev Genet. 2009;10(3):155‐159. [DOI] [PubMed] [Google Scholar]
- 9. Mercer TR, Mattick JS. Structure and function of long noncoding RNAs in epigenetic regulation. Nat Struct Mol Biol. 2013;20(3):300‐307. [DOI] [PubMed] [Google Scholar]
- 10. Bhan A, Mandal SS. Long noncoding RNAs: emerging stars in gene regulation, epigenetics and human disease. ChemMedChem. 2014;9(9):1932‐1956. [DOI] [PubMed] [Google Scholar]
- 11. Jiang C, Li X, Zhao H, Liu H. Long non‐coding RNAs: potential new biomarkers for predicting tumor invasion and metastasis. Mol Cancer. 2016;15(1):62. [DOI] [PMC free article] [PubMed] [Google Scholar]
- 12. Chandra Gupta S, Nandan TY. Potential of long non‐coding RNAs in cancer patients: from biomarkers to therapeutic targets. Int J Cancer. 2017;140(9):1955‐1967. [DOI] [PubMed] [Google Scholar]
- 13. Shen J, Ma J, Li J, Wang X, Wang Y, Ma J. A long non‐coding RNA LNBC3 facilitates non‐small cell lung cancer progression by stabilizing BCL6. J Clin Lab Anal. 2020;34(4):e23122. [DOI] [PMC free article] [PubMed] [Google Scholar]
- 14. Xie Y, Hu X. Increased levels of long noncoding RNA LINC00691 correlate with poor prognosis in non‐small‐cell lung cancer patients. J Clin Lab Anal. 2020;34(8):e23357. [DOI] [PMC free article] [PubMed] [Google Scholar]
- 15. Okayama H, Kohno T, Ishii Y, et al. Identification of genes upregulated in ALK‐positive and EGFR/KRAS/ALK‐negative lung adenocarcinomas. Cancer Res. 2012;72(1):100‐111. [DOI] [PubMed] [Google Scholar]
- 16. Guo Q, He Y, Sun L, et al. Identification of potential prognostic TF‐associated lncRNAs for predicting survival in ovarian cancer. J Cell Mol Med. 2019;23(3):1840‐1851. [DOI] [PMC free article] [PubMed] [Google Scholar]
- 17. McEligot AJ, Poynor V, Sharma R, Panangadan A. Logistic LASSO regression for dietary intakes and breast cancer. Nutrients. 2020;12(9):2652. [DOI] [PMC free article] [PubMed] [Google Scholar]
- 18. Xu C, Fang J, Shen H, Wang YP, Deng HW. EPS‐LASSO: test for high‐dimensional regression under extreme phenotype sampling of continuous traits. Bioinformatics. 2018;34(12):1996‐2003. [DOI] [PMC free article] [PubMed] [Google Scholar]
- 19. Yu G, Wang LG, Han Y, He QY. clusterProfiler: an R package for comparing biological themes among gene clusters. OMICS. 2012;16(5):284‐287. [DOI] [PMC free article] [PubMed] [Google Scholar]
- 20. Ranstam J, Cook JA. Kaplan‐Meier curve. Br J Surg. 2017;104(4):442. [DOI] [PubMed] [Google Scholar]
- 21. Guyot P, Ades AE, Ouwens MJ, Welton NJ. Enhanced secondary analysis of survival data: reconstructing the data from published Kaplan‐Meier survival curves. BMC Med Res Methodol. 2012;12:9. [DOI] [PMC free article] [PubMed] [Google Scholar]
- 22. Li T, Fan J, Wang B, et al. TIMER: a web server for comprehensive analysis of tumor‐infiltrating immune cells. Cancer Res. 2017;77(21):e108‐e110. [DOI] [PMC free article] [PubMed] [Google Scholar]
- 23. Wang P, Ning S, Zhang Y, et al. Identification of lncRNA‐associated competing triplets reveals global patterns and prognostic markers for cancer. Nucleic Acids Res. 2015;43(7):3478‐3489. [DOI] [PMC free article] [PubMed] [Google Scholar]
- 24. Shannon P, Markiel A, Ozier O, et al. Cytoscape: a software environment for integrated models of biomolecular interaction networks. Genome Res. 2003;13(11):2498‐2504. [DOI] [PMC free article] [PubMed] [Google Scholar]
- 25. Bolha L, Ravnik‐Glavač M, Glavač D. Long noncoding RNAs as biomarkers in cancer. Dis Markers. 2017;2017:7243968. [DOI] [PMC free article] [PubMed] [Google Scholar]
- 26. Zeng L, Wang W, Chen Y, et al. A five‐long non‐coding RNA signature with the ability to predict overall survival of patients with lung adenocarcinoma. Experimental and Therapeutic Medicine. 2019;18(6):4852‐4864. [DOI] [PMC free article] [PubMed] [Google Scholar]
- 27. Xu M, Xu X, Pan B, et al. LncRNA SATB2‐AS1 inhibits tumor metastasis and affects the tumor immune cell microenvironment in colorectal cancer by regulating SATB2. Mol Cancer. 2019;18(1):1‐16. [DOI] [PMC free article] [PubMed] [Google Scholar]
- 28. Liu S‐H, Zhu J‐W, Xu H‐H, et al. A novel antisense long non‐coding RNA SATB2‐AS1 overexpresses in osteosarcoma and increases cell proliferation and growth. Molecul Cell Biochem. 2017;430(1–2):47‐56. [DOI] [PubMed] [Google Scholar]
- 29. Cheng S, Xia B, Li H, et al. Long non‐coding RNA SATB2‐AS1 inhibits microRNA‐155‐3p to suppress breast cancer cell growth by promoting breast cancer metastasis suppressor 1‐like. Cancer Cell Int. 2020;20(1):1‐14. [DOI] [PMC free article] [PubMed] [Google Scholar] [Retracted]
- 30. Zhou L, Xing C, Zhou D, Yang R, Cai M. Downregulation of lncRNA FGF12‐AS2 suppresses the tumorigenesis of NSCLC via sponging miR‐188‐3p. Open Med (Warsaw, Poland). 2020;15(1):986‐996. [DOI] [PMC free article] [PubMed] [Google Scholar]
- 31. Guo Q, Wang J, Gao Y, et al. Dynamic TF‐lncRNA regulatory networks revealed prognostic signatures in the development of ovarian cancer. Front Bioeng Biotechnol. 2020;8:460. [DOI] [PMC free article] [PubMed] [Google Scholar]
- 32. Wang F, Li X, Zhao X, Xue Y. Detection of a 5‐circRNA signature to improve prognostic prediction in gastric cancer. J Investig Med. 2020;68:762–769. [DOI] [PubMed] [Google Scholar]
- 33. Li Y, Jiang T, Zhou W, et al. Pan‐cancer characterization of immune‐related lncRNAs identifies potential oncogenic biomarkers. Nat Commun. 2020;11(1):1000. [DOI] [PMC free article] [PubMed] [Google Scholar]
- 34. Xu M, Xu X, Pan B, et al. LncRNA SATB2‐AS1 inhibits tumor metastasis and affects the tumor immune cell microenvironment in colorectal cancer by regulating SATB2. Mol Cancer. 2019;18(1):135. [DOI] [PMC free article] [PubMed] [Google Scholar]
- 35. Lauss M, Donia M, Harbst K, et al. Mutational and putative neoantigen load predict clinical benefit of adoptive T cell therapy in melanoma. Nat Commun. 2017;8(1):1738. [DOI] [PMC free article] [PubMed] [Google Scholar]
- 36. Pao W, Wang TY, Riely GJ, et al. KRAS mutations and primary resistance of lung adenocarcinomas to Gefitinib or Erlotinib. PLoS Med. 2005;2(1):e17. [DOI] [PMC free article] [PubMed] [Google Scholar]
- 37. Ihle NT, Byers LA, Kim ES, et al. Effect of KRAS oncogene substitutions on protein behavior: implications for signaling and clinical outcome. J Natl Cancer Inst. 2012;104(3):228‐239. [DOI] [PMC free article] [PubMed] [Google Scholar]
- 38. Zhou M, Zhang Z, Zhao H, Bao S, Sun J. A novel lncRNA‐focus expression signature for survival prediction in endometrial carcinoma. BMC Cancer. 2018;18(1):39. [DOI] [PMC free article] [PubMed] [Google Scholar]
- 39. Shang S, Li X, Gao Y, et al. MeImmS: predict clinical benefit of Anti‐PD‐1/PD‐L1 treatments based on DNA methylation in non‐small cell lung cancer. Front Genet. 2021;12:676449. [DOI] [PMC free article] [PubMed] [Google Scholar]
- 40. Ferris RL. Immunology and Immunotherapy of Head and Neck Cancer. J Clin Oncol. 2015;33(29):3293‐3304. [DOI] [PMC free article] [PubMed] [Google Scholar]
- 41. Wörmann SM, Diakopoulos KN, Lesina M, Algül H. The immune network in pancreatic cancer development and progression. Oncogene. 2014;33(23):2956‐2967. [DOI] [PubMed] [Google Scholar]
- 42. Zhang L, Chen J, Cheng T, Yang H, Li H, Pan C. Identification of the key genes and characterizations of Tumor Immune Microenvironment in Lung Adenocarcinoma (LUAD) and Lung Squamous Cell Carcinoma (LUSC). Journal of Cancer. 2020;11(17):4965‐4979. [DOI] [PMC free article] [PubMed] [Google Scholar]
- 43. Salmena L, Poliseno L, Tay Y, Kats L, Pandolfi PP. A ceRNA hypothesis: the Rosetta Stone of a hidden RNA language? Cell. 2011;146(3):353‐358. [DOI] [PMC free article] [PubMed] [Google Scholar]
Associated Data
This section collects any data citations, data availability statements, or supplementary materials included in this article.
Data Availability Statement
All the data used in the manuscript can be available in TCGA and GEO.


