

SUMMARY
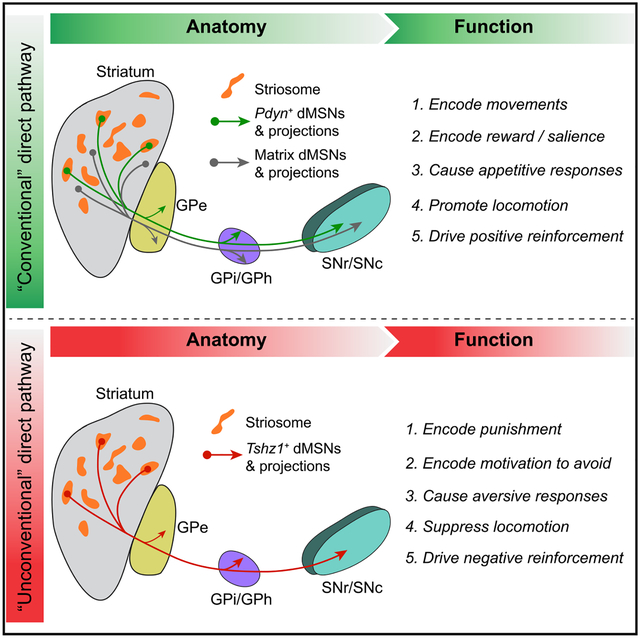
The striosome compartment within the dorsal striatum has been implicated in reinforcement learning and regulation of motivation, but how striosomal neurons contribute to these functions remains elusive. Here, we show that a genetically identified striosomal population, which expresses the Teashirt family zinc finger 1 (Tshz1) and belongs to the direct pathway, drives negative reinforcement and is essential for aversive learning in mice. Contrasting a “conventional” striosomal direct pathway, the Tshz1 neurons cause aversion, movement suppression, and negative reinforcement once activated, and they receive a distinct set of synaptic inputs. These neurons are predominantly excited by punishment rather than reward and represent the anticipation of punishment or the motivation for avoidance. Furthermore, inhibiting these neurons impairs punishment-based learning without affecting reward learning or movement. These results establish a major role of striosomal neurons in behaviors reinforced by punishment and moreover uncover functions of the direct pathway unaccounted for in classic models.
Graphical Abstract
In Brief
Xiao et al. define an unconventional component of the direct pathway for motivated behaviors crucial for aversive learning that is enriched in the striosome of the dorsal striatum and represents punishment to drive negative reinforcement in mice.
INTRODUCTION
The dorsal striatum (DS) serves various behavioral functions, including motor control, reinforcement learning, and motivational regulation (Dudman and Krakauer, 2016; Hikosaka et al., 2014; Ito and Doya, 2011; Jonkman et al., 2012; Nelson and Kreitzer, 2014; Pascoli et al., 2018). It is primarily composed of medium spiny neurons (MSNs) expressing either the D1- or D2-type dopamine receptors, which give rise to the so called “direct pathway” and “indirect pathway,” respectively (Gerfen et al., 1990). A prevailing model posits that the direct and indirect pathways have opposing functions, with the former facilitating movement and promoting reward or positive reinforcement, and the latter suppressing movement and promoting aversion or negative reinforcement (Dudman and Krakauer, 2016; Frank et al., 2004; Hikosaka et al., 2019; Kravitz et al., 2010, 2012; Kravitz and Kreitzer, 2012; Nonomura et al., 2018; Shin et al., 2018). However, recent studies reveal that the direct and indirect pathway neurons are coactivated during movements, rather than having antagonistic activities (Barbera et al., 2016; Cui et al., 2013; Isomura et al., 2013; Jin et al., 2014; Klaus et al., 2017; Markowitz et al., 2018; Parker et al., 2018; Tecuapetla et al., 2016). These findings have led to revised and more nuanced or detailed models for the two pathways in motor control (Dudman and Krakauer, 2016; Klaus et al., 2019). Nevertheless, the dichotomous view of these pathways in positive and negative reinforcement remains unchanged.
A major line of evidence supporting a role of the DS in reinforcement learning comes from in vivo recording studies, showing that DS neurons carry value information needed for outcome evaluation (Ito and Doya, 2009, 2011, 2015; Lau and Glimcher, 2008; Nonomura et al., 2018; Samejima et al., 2005; Shin et al., 2018; Yamada et al., 2011). In parallel, extensive experimental work (Amemori et al., 2011; Bloem et al., 2017; Friedman et al., 2015, 2017; Lawhorn et al., 2009; Stephenson-Jones et al., 2016; White and Hiroi, 1998; Yoshizawa et al., 2018) and computational modeling (Doya, 2002; Houk et al., 1995) suggest that the striosome, a neurochemically distinct compartment embedded within the surrounding matrix in the DS (Gerfen, 1992; Graybiel and Ragsdale, 1978), mediates the evaluative function and acts as a “critic” in reinforcement learning. In addition, the striosome is particularly affected in mood and motivational disorders (Crittenden and Graybiel, 2011, 2016; Crittenden et al., 2016; Friedman et al., 2015, 2017; Hurd and Herkenham, 1993), suggesting that this striatal compartment may also have an important role in regulating affective and motivational processes. Thus, these findings point to the possibility that the striosome mediates or subserves major functions of the DS.
However, despite intensive study, to date the functionality of neurons in the striosome has not been clearly defined. In particular, how striosomal neurons contribute to reinforcement learning or regulation of motivation is unclear. A major challenge to studying striosomal neurons lies in the fact that the striosome is labyrinthine in shape and has no clear anatomical boundaries, making it difficult for targeted in vivo recording or manipulation with currently available methods (Amemori et al., 2011; Hong et al., 2019). To address this issue, in this study we exploited mouse genetics for targeting specific populations of striosomal neurons. This strategy laid the foundation for us to discover an “unconventional” striatal direct pathway, one that originates from a subset of D1 neurons enriched in the striosome and has unexpected roles in motivated behaviors.
RESULTS
Genetic Targeting of Neurons in the Striosome
Recent studies based on single-cell RNA sequencing suggest that the Teashirt family zinc finger 1 (Tshz1) is a genetic marker for neurons in the striosome (Saunders et al., 2018; Zeisel et al., 2018). Indeed, Tshz1 has previously been shown to have a striosome-like expression pattern (Caubit et al., 2005). To investigate the function of Tshz1-expressing (Tshz1+) striosomal neurons, we generated a Tshz1-2A-FlpO knockin mouse driver line (see STAR Methods). To visualize Tshz1+ neurons, we bred mice harboring both the Tshz1-2A-FlpO and an Frt-Stop-Frt-tdTomato allele that expresses the red fluorescent protein tdTomato in a Flp-dependent manner (Figure 1A; Figure S1A). In these mice, the fluorescently labeled Tshz1+ (Tshz1tdTomato) neurons are distributed throughout the brain, with high densities in areas including the olfactory bulb, the piriform cortex, the dorsal and ventral striatum, and the thalamus (Figure 1A; Figure S1A), consistent with the known expression pattern of Tshz1 in the brain (Caubit et al., 2005).
Figure 1. Tshz1 and Pdyn Label Two Distinct Populations of dMSNs in the Striosome.
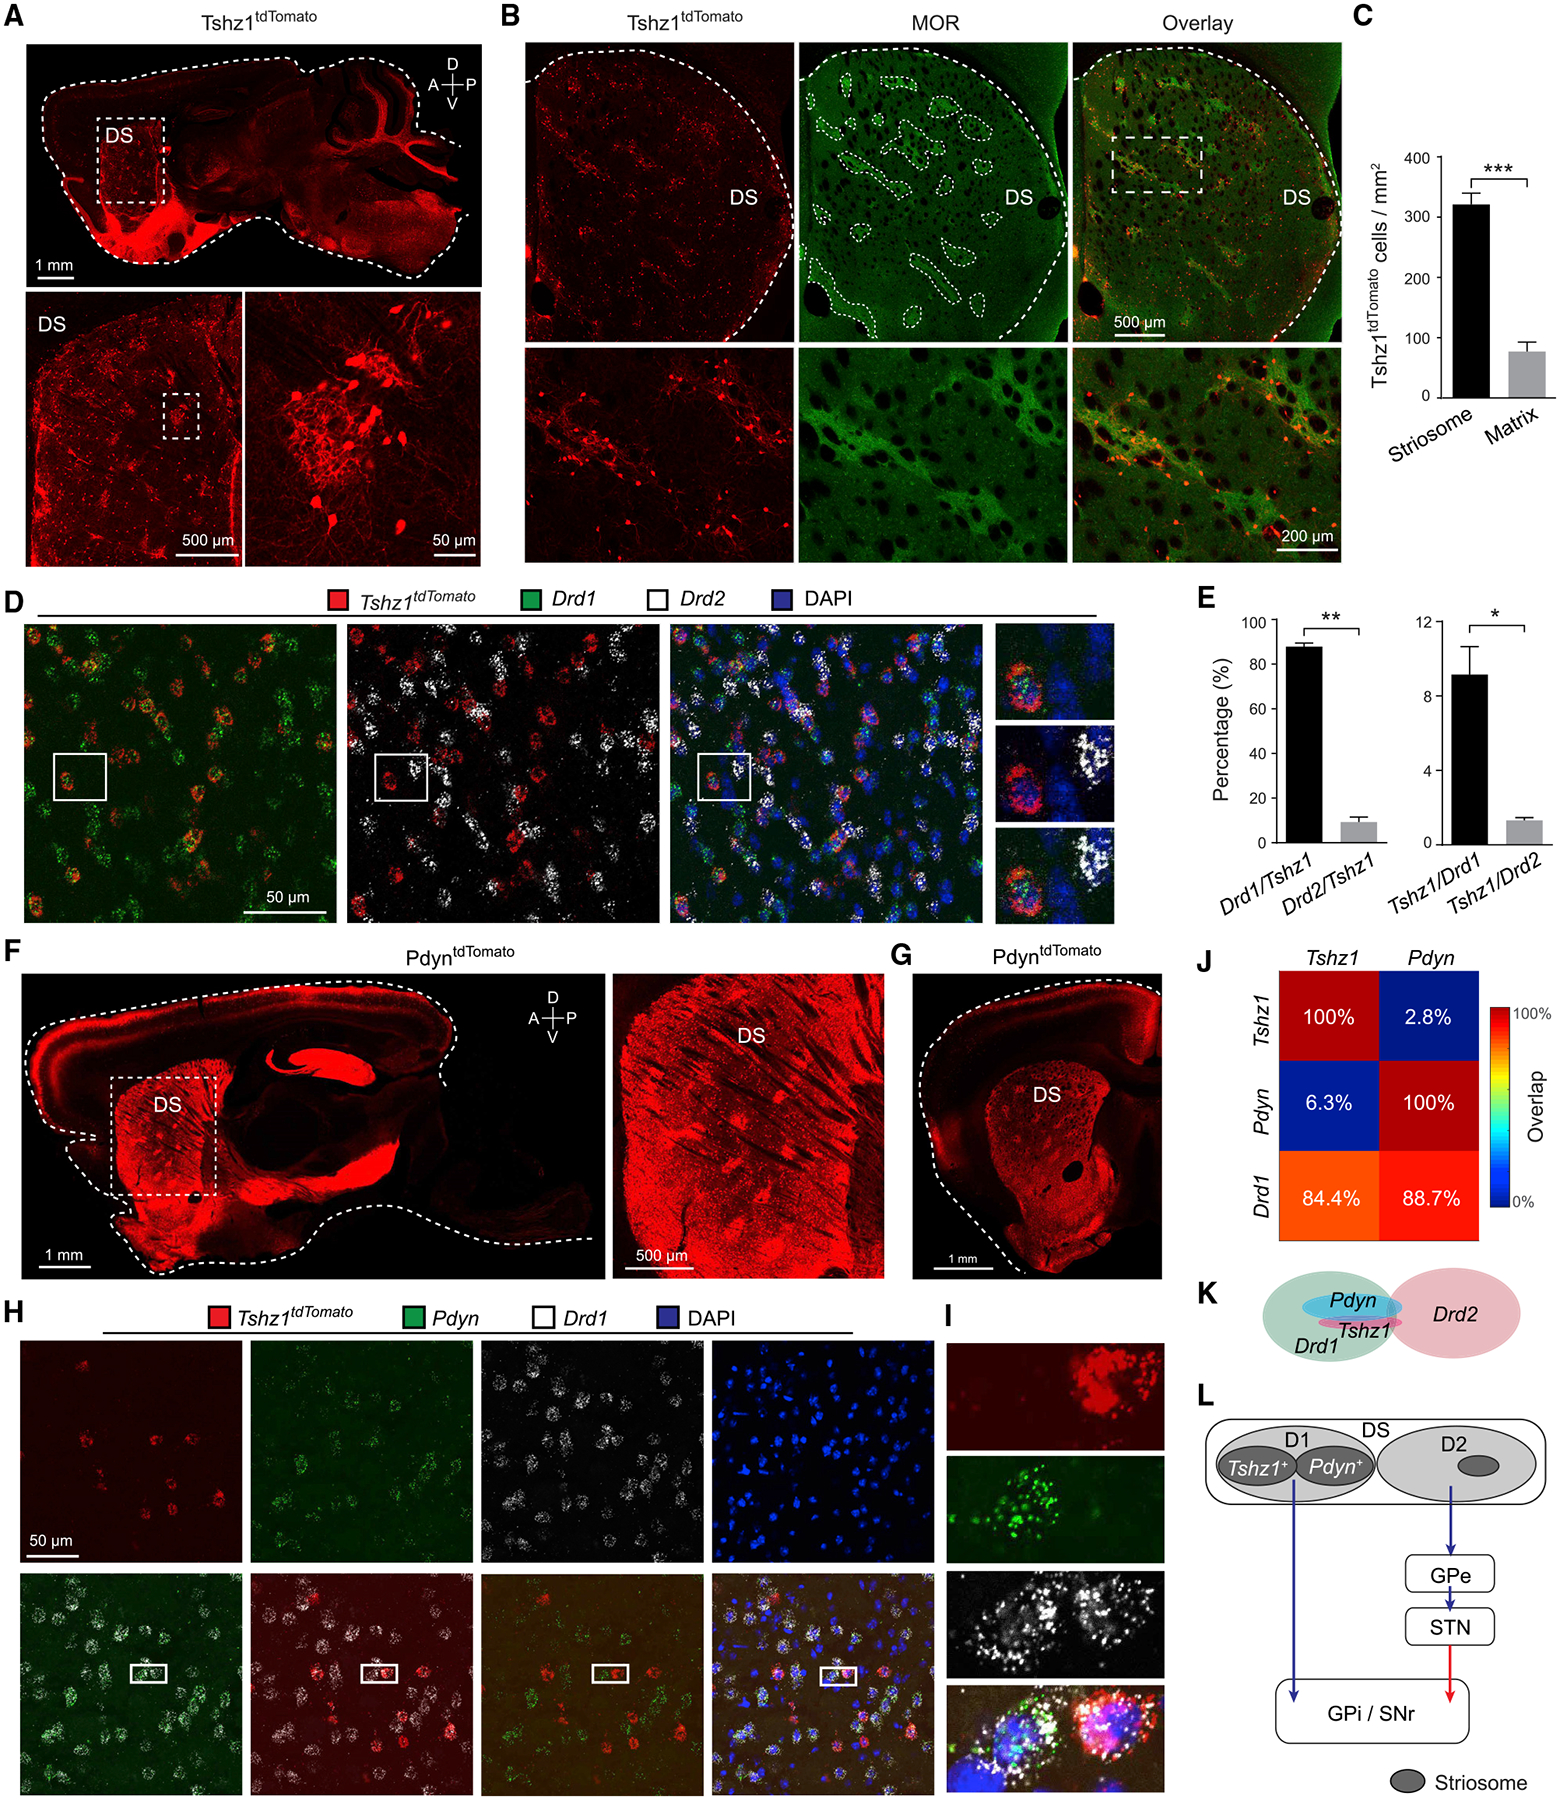
(A) Confocal images of a sagittal brain section from a Tshz1-2A-FlpO;Frt-Stop-Frt-tdTomato mouse, in which Tshz1+ neurons express tdTomato (Tshz1tdTomato) and thus are red fluorescent. Images at the bottom are high-magnification images of the boxed area in the DS (top) and the boxed area over a patch (bottom left).
(B) Confocal images of Tshz1tdTomato neurons in the DS (left) and striosomes identified by an antibody recognizing MOR (middle). In the bottom panel are images of the boxed area in the top panel (right), showing the localization of Tshz1tdTomato neurons in the striosomes.
(C) Quantification of Tshz1tdTomato cell density in the striosome and matrix (n = 3 mice; t(2) = 36.5, ***p < 0.001, paired t test).
(D) Confocal images of in situ hybridization for Tshz1tdTomato, Drd1, and Drd2 in the DS. Right, high-magnification images of the boxed area on the left.
(E) Quantification of the percentage of Drd1 or Drd2 cells in Tshz1tdTomato cells (left) (n = 3 mice; t(2) = 21.2, **p = 0.0022, paired t test) or vice versa (right) (t(2) = 9.7, *p = 0.0105, paired t test).
(F) Characterization of Pdyn+ neurons in the DS. Left: a confocal image of a sagittal brain section prepared from a Pdyn-Cre;Ai14 mouse, in which Pdyn+ neurons express tdTomato (PdyntdTomato). Right: a high-magnification view of the boxed area on the left, showing that PdyntdTomato neurons form patches in the DS.
(G) A confocal image of a coronal brain section prepared from a Pdyn-Cre;Ai14 mouse.
(H) Confocal images of in situ hybridization for Tshz1tdTomato, Pdyn, and Drd1 in the DS.
(I) High-magnification images of the boxed area in (H), showing that Tshz1 and Pdyn do not overlap, but both overlap with Drd1.
(J) Quantification of the fractions of Tshz1+ nuclei that were positive for Pdyn and Drd1, and the fractions of Pdyn+ nuclei that were positive for Tshz1 and Drd1 (n = 3 mice).
(K) A schematic showing the relationship between different populations in the DS.
(L) A schematic diagram showing the components of the direct and indirect pathways. The direct pathway includes the Tshz1+ and Pdyn+ MSNs in the striosome.
DS, dorsal striatum; GPe, globus pallidus externus; GPi, globus pallidus internus; SNr, substantia nigra pars reticulata; SNc, substantia nigra pars compacta; STN, subthalamic nucleus. Data in (C) and (E) are presented as mean ± SEM. See also Figure S1.
In the DS, Tshz1tdTomato neurons formed patches and were markedly enriched in the striosome—which can be recognized by high expression of the μ-opioid receptor (MOR) (Gerfen, 1992)—relative to the matrix (Figures 1A–1C). These neurons did not express markers for the major types of striatal interneurons (Figures S1B–S1G), suggesting that they are MSNs. Single-molecule in situ hybridization revealed that the vast majority of Tshz1tdTomato DS cells expressed the dopamine receptor gene Drd1 (Figures 1D and 1E), indicating that they are D1 neurons or direct-pathway MSNs (dMSNs). To verify this result, we labeled these neurons with the fluorescent protein eYFP (Tshz1eYFP) by injecting the DS of Tshz1-2A-FlpO mice with a Flp-dependent adeno-associated virus AAV-fDIO-eYFP (Figures S1H and S1I). We found that the Tshz1eYFP neurons sent projections to the globus pallidus internus (GPi), substantia nigra pars reticulata (SNr), and the globus pallidus externus (GPe) (Figure S1J), which are known targets of dMSNs (Gerfen et al., 1990; Jin et al., 2014). Furthermore, we simultaneously visualized both Tshz1+ neurons and the general population of dMSNs by taking advantage of the compound mice containing both the Tshz1-2A-FlpO knockin allele and the D1-Cre transgene. In these Tshz1-2A-FlpO;D1-Cre mice, the Tshz1+ neurons were labeled with eYFP (Tshz1eYFP) as above, and the dMSNs (i.e., the D1 neurons in the DS) were labeled with the fluorescent protein mCherry (D1mCherry) using a Cre-dependent virus AAV-DIO-mCherry (Figure S1K). This approach resulted in co-labeling of many DS neurons with eYFP and mCherry and moreover revealed that the projection patterns of the Tshz1eYFP neurons matched with those of the D1mcherry neurons (Figure S1L). These results together demonstrate that Tshz1+ neurons in the DS are enriched in the striosome and constitute a subpopulation of dMSNs.
It has recently been shown that the prodynorphin-expressing (Pdyn+) neurons in the DS are enriched in the striosome and belong to the direct pathway (Banghart et al., 2015). Indeed, we found that, in mice having both the Pdyn-Cre allele and an Ai14 allele expressing tdTomato in a Cre-dependent manner, the fluorescently labeled Pdyn+ (PdyntdTomato) neurons in the DS form patches (Figures 1F and 1G), consistent with them being enriched in the striosome (Banghart et al., 2015). Anterograde tracing also confirmed that DS Pdyn+ neurons are in the direct pathway (Figures S1M and S1N). As is the case with Tshz1+ neurons, the vast majority of Pdyn+ neurons expressed Drd1. Notably, however, Pdyn+ neurons and Tshz1+ neurons were largely non-overlapping in the DS (Figures 1H and 1K). In the nucleus accumbens, most Pdyn+ neurons and Tshz1+ neurons expressed Drd1, but these two populations had increased overlap compared with their counterparts in the DS (Figures S1O–S1Q). Our results indicate that, in the DS, Pdyn+ neurons and Tshz1+ neurons represent two distinct populations of dMSNs or D1 neurons enriched in the striosome (Figure 1L).
Tshz1+ dMSNs and Pdyn+ dMSNs Have Opposing Behavioral Functions
As a first step to understand the function of these genetically identified striosomal neurons, we tested the behavioral effects of activating them with optogenetics (Figures 2A–2P; Figure S2A–AA). To activate Tshz1+ dMSNs, we introduced the light-gated cation channel channelrhodopsin (ChR2) selectively into these neurons by bilaterally injecting the DS of Tshz1-2A-FlpO mice with an AAV-CreOFF/FlpON-ChR2-eYFP (Fenno et al., 2014), whose expression of ChR2 can be activated by Flp and suppressed by Cre (only if Cre is present; see below) (Figures S2A–S2C; Figures 2A and 2B). Optical fibers were implanted over the infected areas for light delivery (Figures 2A and 2B; Figures S2T and S2U). We subsequently tested these mice in a situation in which photo-activation of their Tshz1+ dMSNs was contingent on them entering one side of a chamber. To our surprise, these mice strongly avoided the side paired with the activation (Figures 2C and 2D). In addition, activation of Tshz1+ dMSNs caused a subsequent reduction in movement velocity and distance (Figures S2D–S2I; Figures S2T and S2U).
Figure 2. Optogenetic Activation of Tshz1+ or Pdyn+ dMSNs Has Opposite Behavioral Effects.
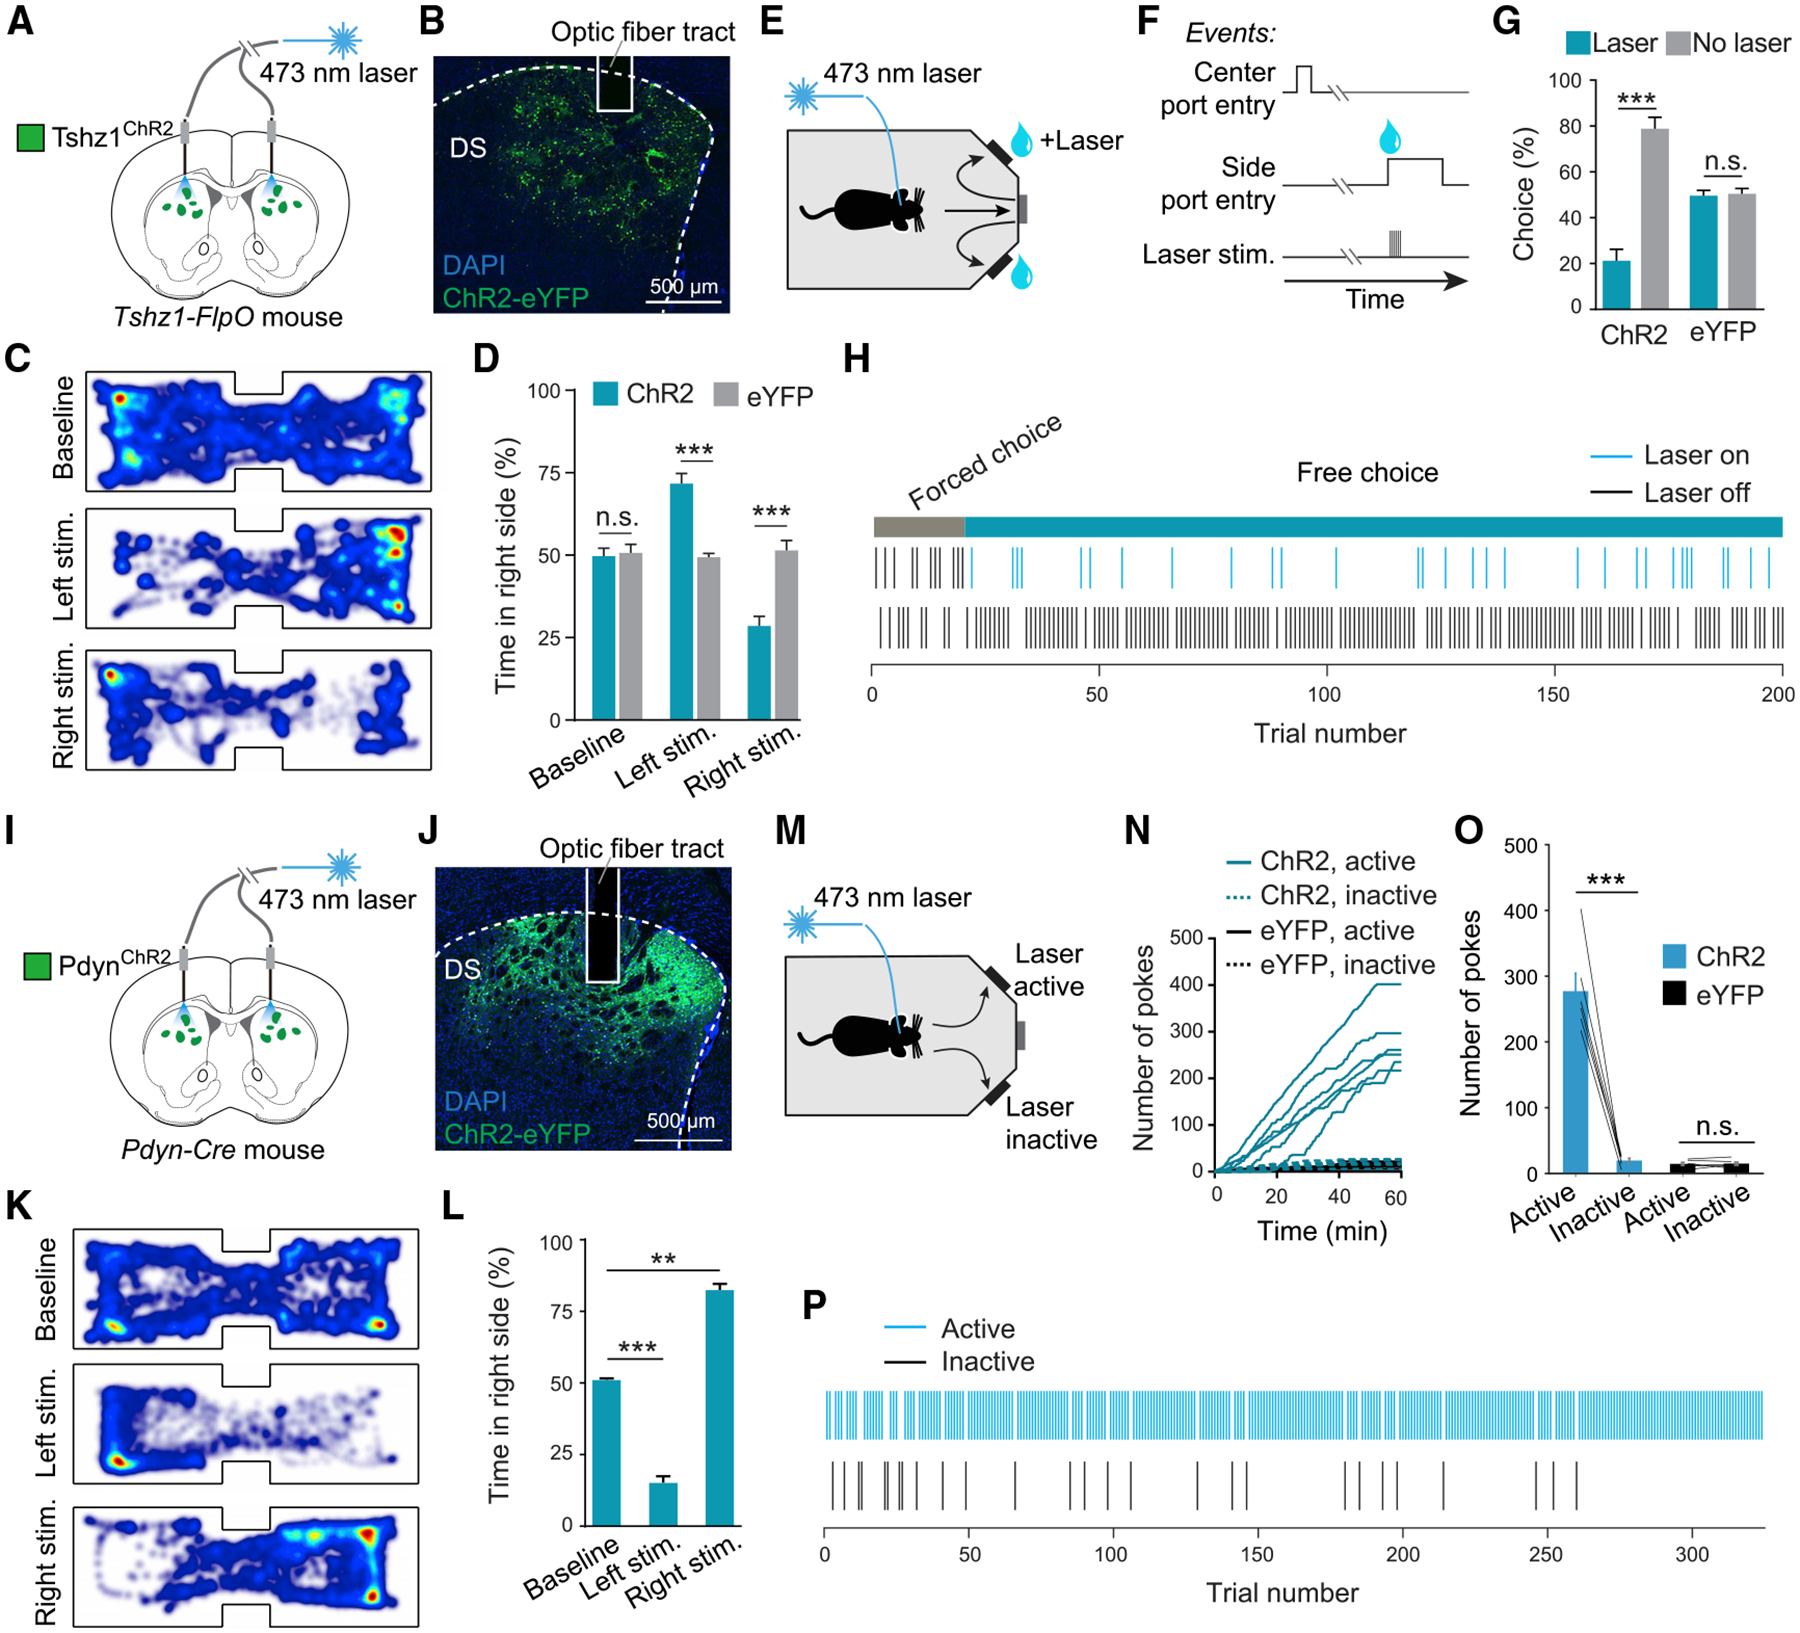
(A) A schematic of the approach.
(B) A confocal image of ChR2 expression in Tshz1+ dMSNs in a representative mouse.
(C) Heatmaps for the activity of a representative mouse at baseline (top), or in a situation whereby entering the left (middle) or right (bottom) side of the chamber triggered photo-stimulation in the DS.
(D) Quantification of the mouse activity as shown in C, for mice in which the Tshz1+ dMSNs expressed ChR2 (n = 6) or eYFP (n = 6). The ChR2 mice, but not the eYFP mice, avoided the side associated with the photo-stimulation (F(2,30) = 53.1, p < 0.001, ***p < 0.001, n.s. (non-significant), p > 0.05, two-way ANOVA followed by Tukey’s test).
(E and F) Schematics of the experimental setup (E) and design (F).
(G) Photo-stimulation in the DS of the ChR2 mice, but not the eYFP mice, caused a decrease in choice associated with the stimulation (F(1,20) = 52.6, p < 0.001, ***p < 0.001, n.s., p > 0.05, two-way ANOVA followed by Tukey’s test).
(H) An example session showing the choice bias of a ChR2 mouse against the photo-stimulation.
(I) A schematic of the approach.
(J) A confocal image of ChR2 expression in Pdyn+ dMSNs in a representative mouse.
(K) Heatmaps for the activity of a representative mouse at baseline (top) or in a situation whereby entering the left (middle) or right (bottom) side of the chamber triggered photo-stimulation in the DS.
(L) Quantification of the mouse activity as shown in (K). Photo-activation of Pdyn+ dMSNs (n = 6 mice) induced preference for the side associated with the photo-activation (F(2,15) = 41.95, p < 0.0001, **p = 0.0021, ***p = 0.0002, one-way ANOVA followed by Tukey’s test).
(M) A schematic of the experimental design.
(N) Cumulative curves for the poking responses at a port where poking triggered the photo-stimulation (active) and a port where poking did not trigger the photo-stimulation (inactive), in mice in which Pdyn+ dMSNs expressed ChR2 (n = 6), or Tshz1+ dMSNs expressed eYFP (as the control; n = 6).
(O) Quantification of the poking responses as shown in (N). The ChR2 mice, but not the eYFP mice, poked the port for photo-stimulation in the DS (F(1,20) = 86.64, p < 0.0001, ***p < 0.001, n.s., p > 0.05, two-way ANOVA followed by Tukey’s test).
(P) An example session of a ChR2 mouse, which poked viciously at the active port but not the inactive port, indicating robust self-stimulation.
Data in (D), (G), (L), and (O) are presented as mean ± SEM. See also Figures S2 and S3.
These effects are in stark contrast to those of activating dMSNs using the D1-Cre mice, which typically induces reward responses and promotes movements (Frank et al., 2004; Hikosaka et al., 2019; Kravitz et al., 2010, 2012; Kravitz and Kreitzer, 2012; Nonomura et al., 2018; Shin et al., 2018) but are reminiscent of some of the effects of activating Drd2-expressing MSNs in the DS, that is, the indirect-pathway MSNs (iMSNs), using the D2-Cre or A2A-Cre mice (Frank et al., 2004; Hikosaka et al., 2019; Kravitz et al., 2010, 2012; Kravitz and Kreitzer, 2012; Nonomura et al., 2018; Shin et al., 2018). Indeed, we found that photo-activation of iMSNs in A2A-Cre mice induced aversive responses and reduced movements (Figures S2J–S2M, S2V, and S2W).
Because a small fraction (9.2% ± 2.3%) of Tshz1+ MSNs expresses Drd2 (Figure 1E), it is possible that the effects of photo-stimulating these neurons we observed were mediated or dominated by the indirect pathway. We thus designed the following experiments to verify our results. First, we selectively targeted Tshz1+ MSNs that do not express Drd2 (Tshz1+/Drd2−) by injecting the DS of Tshz1-2A-FlpO;A2A-Cre mice, in which Tshz1+ MSNs and Drd2+ MSNs express Flp and Cre, respectively, with the AAV-CreOFF/FlpON-ChR2-eYFP (Figures S3A–S3D). Optical fibers were implanted over the infected areas in the DS for light delivery and thus photo-stimulation (Figures S2V, S2W, and S3A). Second, we introduced ChR2 into Tshz1+ MSNs in the DS as above but selectively photo-stimulated Tshz1+ axons in the direct pathway through an optical fiber implanted in the GPi (Figures S2X, S2Y, and S3E–S3H), which receives no inputs from iMSNs (e.g., see Figure S2J). In both experiments, which only targeted the Tshz1+ MSNs in the direct pathway, the photo-stimulation induced aversive responses and reduced movements (Figures S3A–S3H). For comparison, we selectively targeted those dMSNs that express no Tshz1 (Drd1+/Tshz1−) by injecting the DS of Tshz1-2A-FlpO;D1-Cre mice, in which Tshz1+ MSNs and Drd1+ MSNs express Flp and Cre, respectively, with an AAV-CreON/FlpOFF-ChR2-eYFP (Figures S2V, S2W, and S3I–S3L). Optogenetically activating Drd1+/Tshz1− MSNs induced potent reward responses (Figures S3I–S3L). These results demonstrate that Tshz1+ MSNs give rise to an “unconventional” direct pathway, the activation of which is intrinsically aversive.
To test whether activating Tshz1+ dMSNs is sufficient to drive aversive learning, we trained mice in a choice task in which they learned to first poke into a center port and subsequently obtain water reward from a left or right port (Figure 2E; Figures S2N–S2P). We then tested the mice in a situation where the water was available at both of the side ports following center-port entry, but drinking at one of the ports was paired with photo-activation of Tshz1+ dMSNs (Figures 2E and 2F; Figures S2N–S2P). These mice developed a strong bias against choosing the port paired with the photo-activation (Figures 2G and 2H). As mice’s choice in this task was dependent on evaluating and learning the values of previously visited ports (Menegas et al., 2018), this result indicates that Tshz1+ dMSN activation causes a reduction in the value of the associated port and thus negative reinforcement, an effect that is opposite of that of activating “conventional” dMSNs.
To determine the behavioral effects of optogenetically activating Pdyn+ dMSNs, the other population enriched in the striosome, we introduced ChR2 into these neurons in the Pdyn-Cre mice with a Cre-dependent AAV, followed by optical fiber implantation (Figures 2I and 2J; Figure S2Z, AA). We found that photo-activation of Pdyn+ dMSNs (Figures 2K and 2L), or their projections to the GPi (Figures S2X, S2Y, and S3M–S3P), induced a potent reward response, and, notably, supported robust self-stimulation (Figures 2M–2P). Moreover, such manipulation also promoted movements (Figures S2Q–S2S). These effects are consistent with the known functions of “conventional” dMSNs. Together, these results suggest that Tshz1+ neurons and Pdyn+ neurons in the DS influence behavior in opposing manners, despite the fact that they both belong to the direct pathway.
Tshz1+ dMSNs Are Preferentially Excited by Aversive Stimuli
The optogenetic experiments uncovered that activities in Tshz1+ or Pdyn+ dMSNs are capable of driving learning through negative or positive reinforcement, respectively, but did not tell how these neurons naturally participate in learning. To address this question, we monitored the activities of these neurons during learning. For this purpose, we injected the DS of Tshz1-2A-FlpO or Pdyn-Cre mice with an AAV expressing the genetically encoded calcium indicator GCaMP6 (Chen et al., 2013) in a Flp- or Cre-dependent manner, respectively, followed by implanting an optical fiber into the same location (Figure 3A). This strategy allows recording bulk GCaMP6 signals, which are readouts of average neuronal activities, from the infected neurons with fiber photometry (Yu et al., 2016; Figures 3A–3G).
Figure 3. Tshz1+ but Not Pdyn+ dMSNs Are Preferentially Excited by Aversive Stimuli.
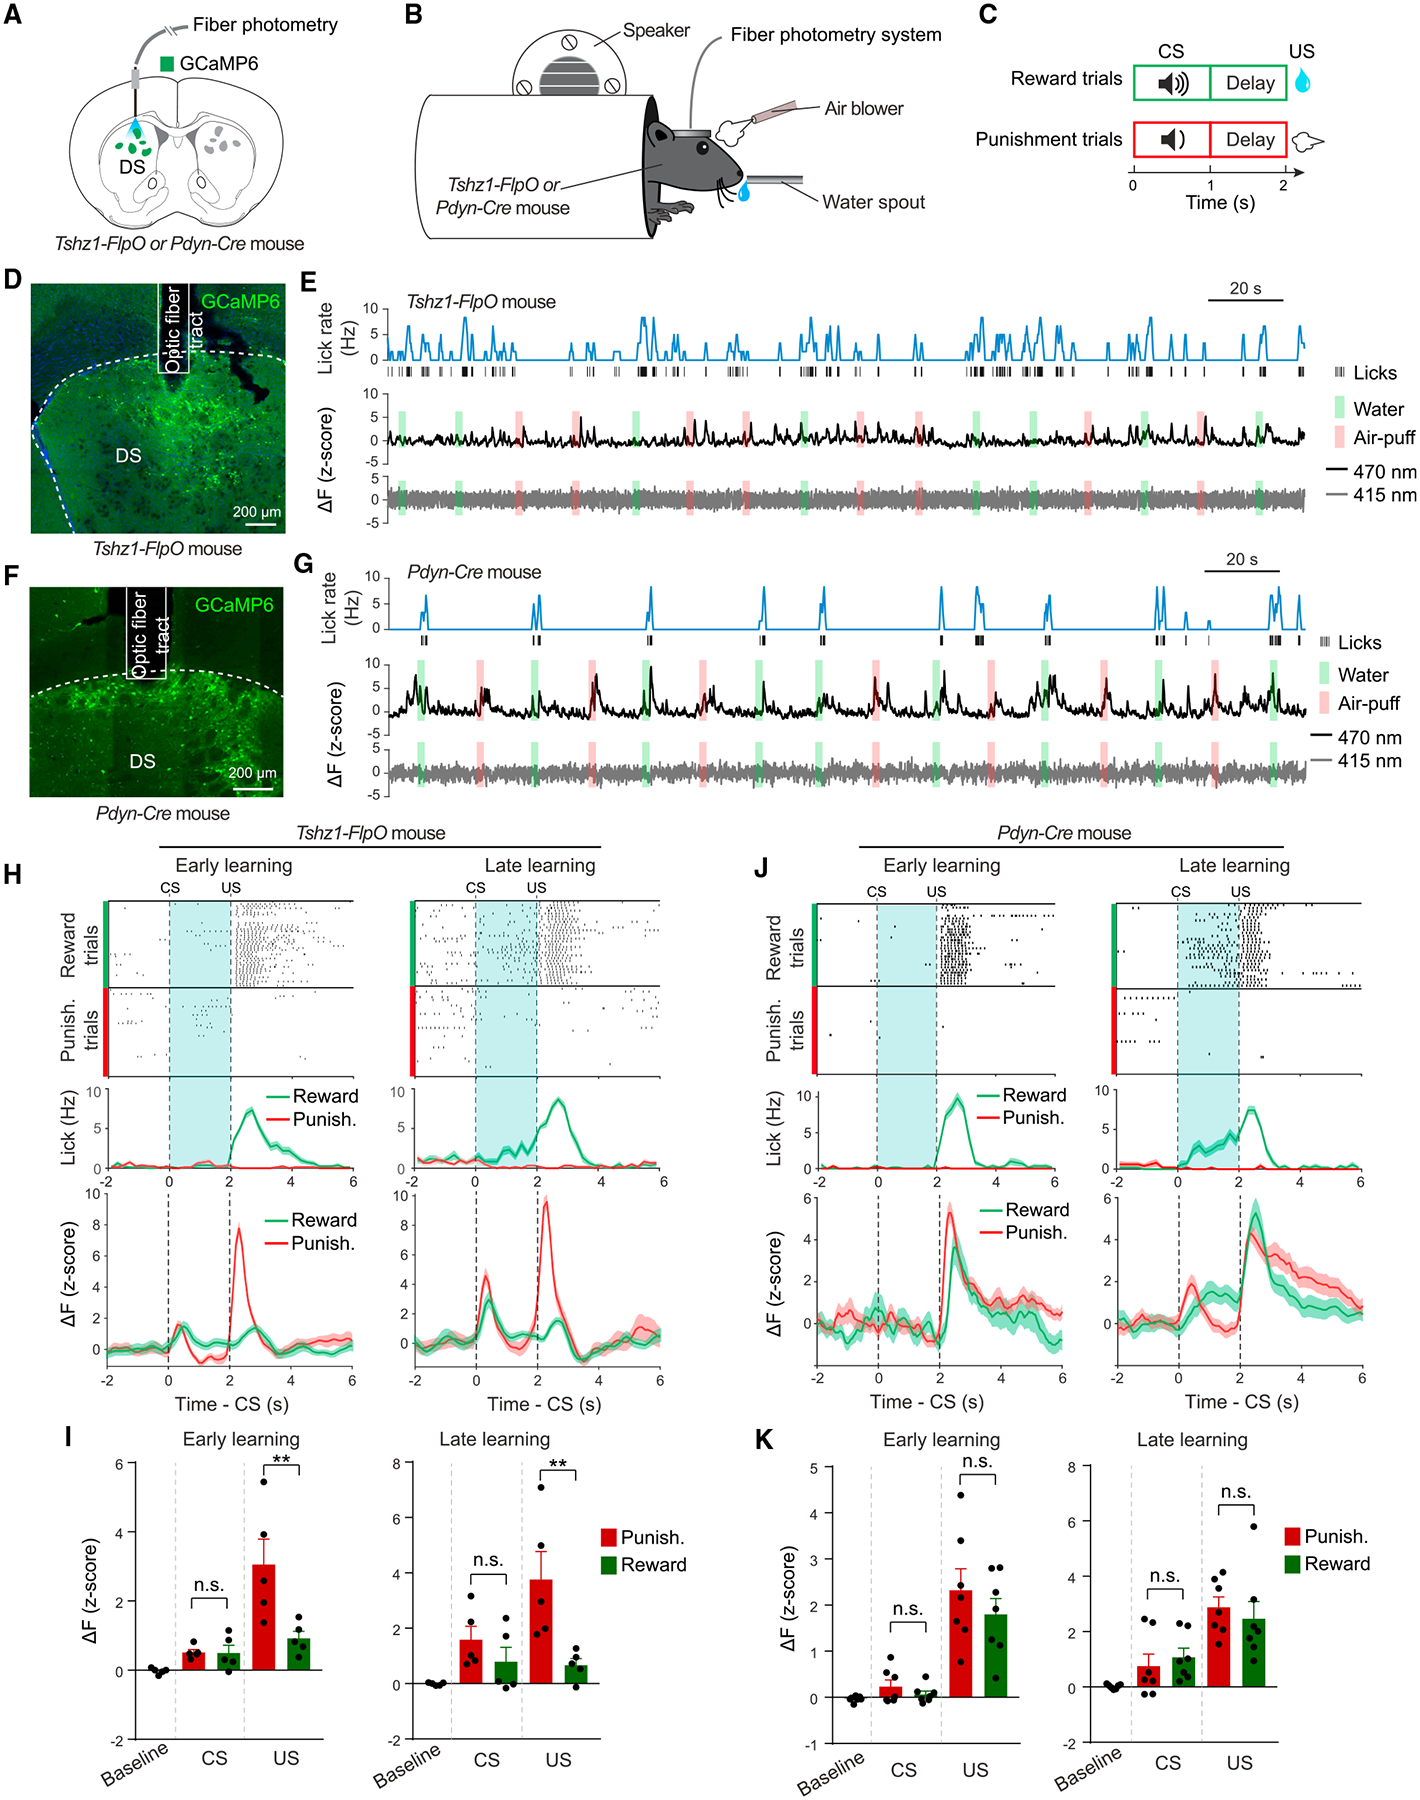
(A–C) Schematics of the approach (A), experimental setup (B), and design (C).
(D) A representative confocal image of GCaMP6 expression in Tshz1+ dMSNs.
(E) Example traces of simultaneously measured behavioral (top) and neural (middle) responses in a representative Tshz1-2A-FlpO mouse. The gray trace (bottom) represents the fluorescence signals acquired with the isosbestic wavelength (415 nm), which was used to monitor potential motion artifacts during recording with fiber photometry.
(F) Representative confocal images of GCaMP6 expression in Pdyn+ dMSNs.
(G) Example traces of simultaneously measured behavioral (top) and neural (middle) responses in a representative Pdyn-Cre mouse. The gray trace (bottom) represents the fluorescence signals acquired with the isosbestic wavelength (415 nm), which was used to monitor potential motion artifacts during recording with fiber photometry.
(H) Top: licking events, sorted according to trial types, for a representative Tshz1-2A-FlpO mouse in the early (left) and late (right) stages of training in the Pavlovian task. Middle: average licking rates of this mouse in different types of trials as indicated. Bottom: average GCaMP6 signals from this mouse, obtained from different types of trials. Dashed lines indicate the onset of CS and US, as indicated.
(I) Left: quantification of the responses of Tshz1+ dMSNs in all mice to different stimuli at the early stage of training (n = 5 mice; F(1,8) = 10.03, p = 0.013; CS response, p = 0.99 (n.s., nonsignificant); US response, **p = 0.0031; two-way ANOVA followed by Bonferroni’s test). Right: quantification of the responses of Tshz1+ dMSNs in all mice to different stimuli at the late stage of training (n = 5 mice; F(1,8) = 12.17, p = 0.0082; CS response, p = 0.61 (n.s.); US response, **p = 0.0060; two-way ANOVA followed by Bonferroni’s test).
(J) Top: licking events, sorted according to trial types, for a representative Pdyn-Cre mouse in the early (left) and late (right) stages of training in the Pavlovian task. Middle: average licking rates of this mouse in different types of trials as indicated. Bottom: average GCaMP6 signals from this mouse, obtained from different types of trials. Dashed lines indicate the onset of CS and US, as indicated.
(K) Left: quantification of the responses of Pdyn+ dMSNs in all mice to different stimuli at the early stage of training (n = 7 mice; F(1,12) = 0.29, p = 0.59; CS response, p = 0.90 (n.s.); US response, p = 0.41 (n.s.); two-way ANOVA followed by Bonferroni’s test). Right: quantification of the responses of Pdyn+ dMSNs in all mice to different stimuli at the late stage of training (n = 7 mice; F(1,12) = 1.23, p = 0.29; CS response, p = 0.85 (n.s.); US response, p = 0.78 (n.s.); two-way ANOVA followed by Bonferroni’s test).
Data are presented as mean ± SEM. Shaded areas represent SEM. See also Figures S4 and S5.
Four to 6 weeks after the surgery, we trained the mice in a Pavlovian task (see STAR Methods), in which one sound (the conditioned stimulus 1, or CS1) predicted the delivery of an air puff blowing to the face (the aversive unconditioned stimulus, or US1), and another sound (CS2) predicted the delivery of a water reward (the appetitive US, or US2) (Figures 3B and 3C). Recording was performed at different stages of training. Notably, we found that Tshz1+ dMSNs were strongly activated by air puff but showed little response to water during both the early and the late training stages (Figures 3H and 3I). By contrast, Pdyn+ dMSNs were excited by both stimuli during training (Figures 3J and 3K).
To verify that the responses of the recorded Tshz1+ neurons, which were targeted on the basis of Tshz1 expression in the DS, indeed reflect the properties of the direct pathway, we sought to record the activities of Tshz1+ DS neurons projecting to the GPi, which, by definition, only consist of dMSNs. To achieve this goal, we used an intersectional viral strategy whereby we injected the GPi of Tshz1-2A-FlpO mice with a retrograde AAV expressing Cre in a Flp-dependent manner and injected the ipsilateral DS of the same mice with an AAV expressing GCaMP6 in a Cre-dependent manner (Figure S4A). These mice were implanted with optical fibers in the DS and, after viral expression, were subjected to the same behavioral and photometry experiments as described above (Figures S4B and S4C). We found that these retrogradely labeled Tshz1+ neurons, representing bona fide dMSNs, were strongly activated by air puff but showed little response to water during both the early and the late stages of training (Figures S4D and S4E). These response properties mimic those of the general population of Tshz1+ DS neurons (Figures 3H and 3I). Furthermore, the responses of these Tshz1+ dMSNs were scaled with the durations of air puffs (Figures S4F and S4G), suggesting that these neurons encode the values of the stimuli. Together, these results indicate that Tshz1+ dMSNs preferentially represent aversive stimuli. By contrast, Pdyn+ dMSNs as a population do not discriminate between aversive and rewarding stimuli and thus may represent saliency.
Because Tshz1+ and Pdyn+ dMSNs are strikingly different in their responses to valenced stimuli, it is likely that these two populations receive different synaptic inputs. To test this possibility, we mapped brain-wide monosynaptic inputs onto each of these populations using a cell-specific tracing strategy (Schwarz et al., 2015) with an optimized rabies virus system (Reardon et al., 2016; Figures S5A–S5P; STAR Methods). This approach revealed marked differences between the inputs onto Tshz1+ dMSNs and those onto Pdyn+ dMSNs (Figure S5P). In particular, Tshz1+ dMSNs receive stronger inputs from orbital, motor, and somatosensory cortices (Figures S5D, S5H, S5J, and S5P), whereas Pdyn+ dMSNs receive more inputs from the infralimbic cortex, insular cortex, and amygdala nuclei (Figures S5N–S5P). These inputs as a whole partially overlap with those onto the striosomal neurons identified with a bacterial artificial chromo-some (BAC)-Cre transgenic mouse line (i.e., the Sepw1-NP67 line [Smith et al., 2016]). Thus, Tshz1+ dMSNs and Pdyn+ dMSNs receive inputs from distinct sets of sensory and limbic structures that may determine, at least in part, their different response properties.
Valence Representations and Valence-Specific Predictive Signals in Tshz1+ dMSNs
The observations from Tshz1+ dMSNs thus far were rather unexpected, given the known and hypothesized functions of dMSNs (Frank et al., 2004; Hikosaka et al., 2019; Kravitz et al., 2010, 2012; Kravitz and Kreitzer, 2012; Nonomura et al., 2018; Shin et al., 2018) or striosomal neurons (Bloem et al., 2017; Friedman et al., 2015; Graybiel, 2008; Lawhorn et al., 2009; White and Hiroi, 1998; Yoshizawa et al., 2018) in representing reward or promoting reward-seeking behaviors. We therefore decided to focus on Tshz1+ dMSNs in the rest of the study.
To better understand the encoding properties of Tshz1+ dMSNs, we next imaged the GCaMP6 signals in these neurons at single-cell resolution with a wide-field microscope, through an implanted gradient-index (GRIN) lens (Figure 4A; Figures S6A–S6E). Imaging was performed both before and after training the mice in the Pavlovian task described above (Figure 3C). We found that a major population of Tshz1+ dMSNs was activated by air puff but not water, whereas only a small population was activated by water but not air puff (Figures 4B and 4C; Figures S6F–S6I). We operationally named these two populations negative valence neurons and positive valence neurons, respectively.
Figure 4. Individual Tshz1+ dMSNs Are Predominantly Excited by and Encode the Value of the Aversive Stimulus.
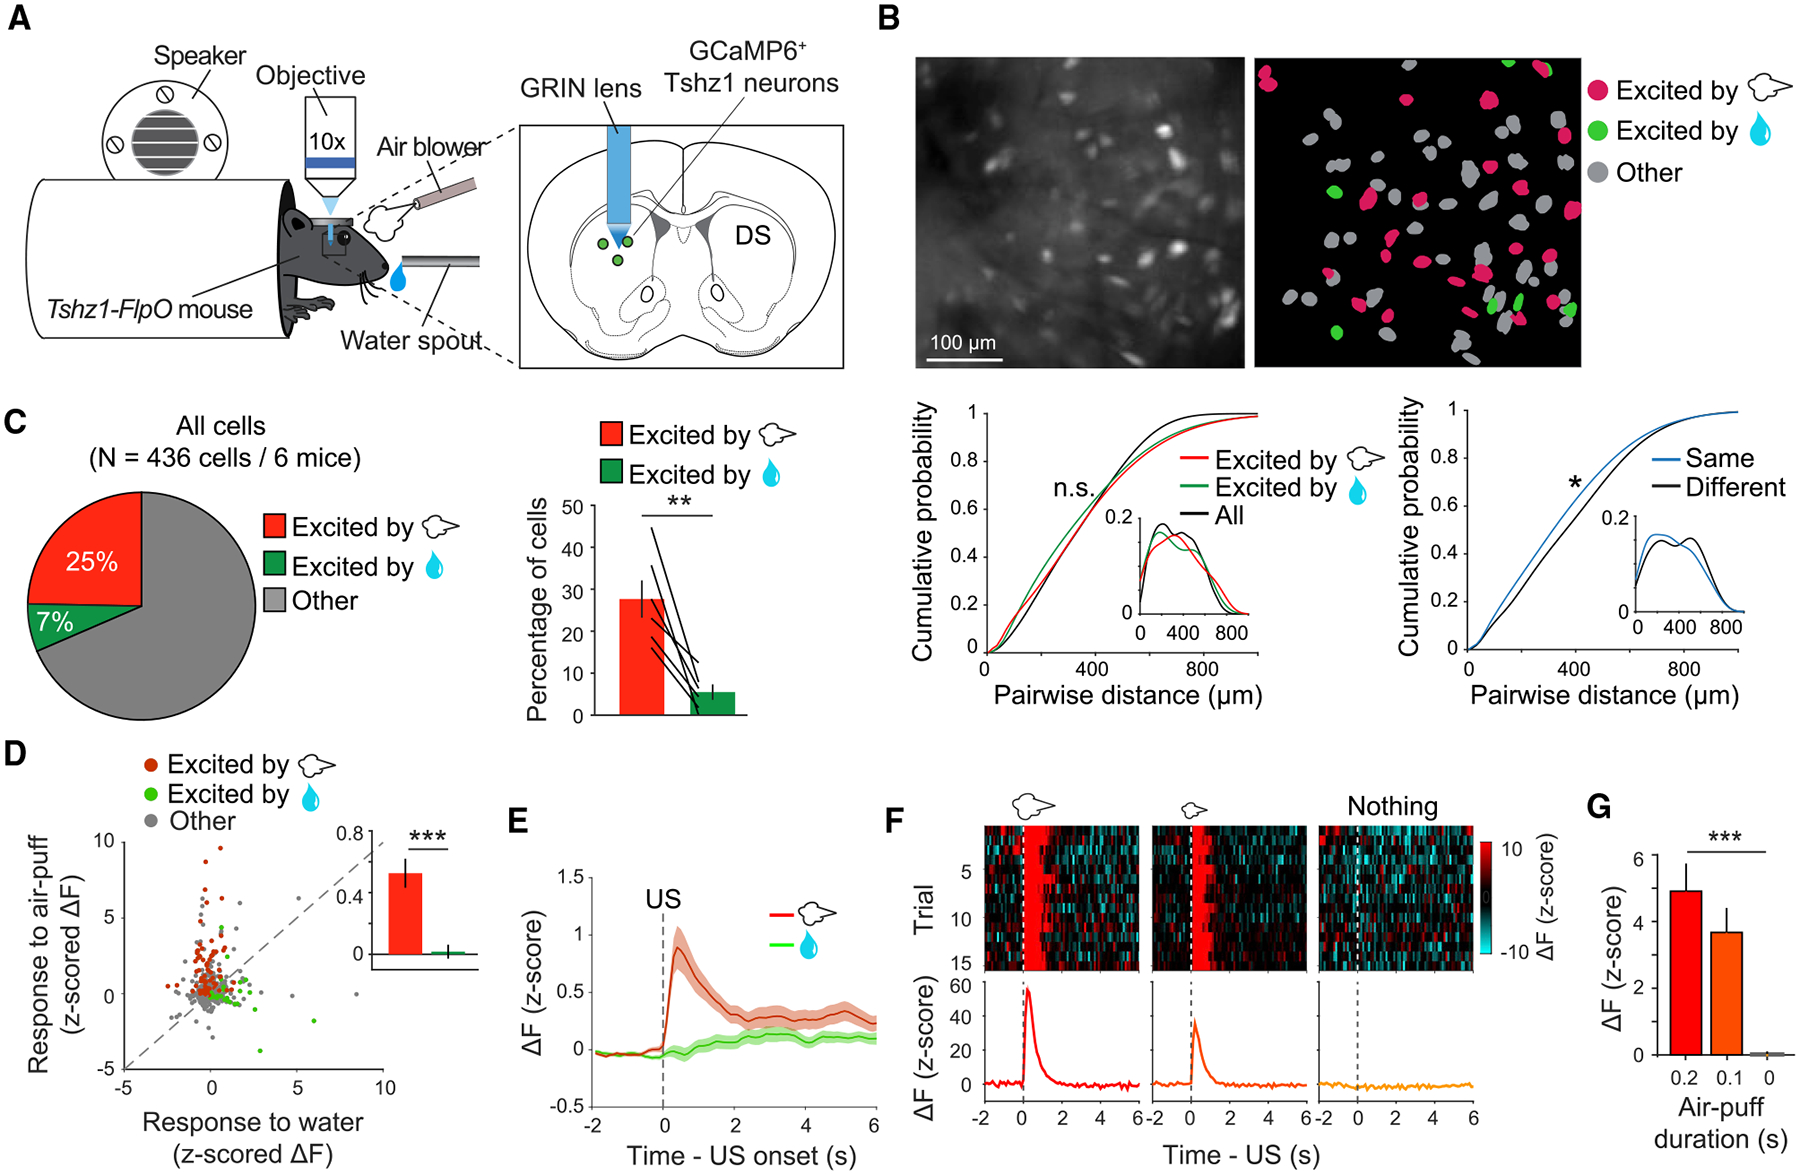
(A) A schematic of the experimental setup and the approach.
(B) Top left, the field of view (FOV) of raw GCaMP6m fluorescence signals from Tshz1+ dMSNs in a mouse before conditioning. Top right, the spatial locations of individual extracted neurons in the FOV shown on the left. Different classes of Tshz1+ dMSNs are color coded. Bottom left, quantification of the pairwise distances of different classes of neurons, as indicated, in the FOV. The distributions of the pairwise distances were not significantly different (n.s.) between groups (negative valence neurons [NVNs] versus positive valence neurons [PNVs], p = 0.35; NVNs versus all neurons (All), p = 0.14; PVNs versus All, p = 0.13; Kolmogorov-Smirnov test). Bottom right, quantification of the pairwise distances of neurons belonging to the same class (“Same,” i.e., the distances of NVN-NVN pairs and those of PNV-PNV pairs; data were combined), and those belonging to different classes (“Different,” i.e., the distances of NVN-PNV pairs). These two distributions were significantly different (*p = 0.02; Kolmogorov-Smirnov test). Data from each of the 6 mice were pooled together (n = 436 cells/6 mice).
(C) Left: pie chart of the percentage distributions of Tshz1+ dMSNs, showing those selectively excited by air puff (i.e., the NVNs), by water (i.e., the PVNs), or other types of neurons (other), before training in the Pavlovian conditioning task. Right: the fractions of NVNs and PVNs in individual mice (n = 6; t(5) = 4.73, **p = 0.005, paired t test).
(D) A scatterplot of individual Tshz1+ dMSNs’ responses to air puff and water. The NVNs, PVNs and all other neurons are color coded as indicated. Inset: a bar graph showing the average responses of all neurons to air puff (red) and water (green) (***p < 0.001, Wilcoxon signed-rank test).
(E) Average responses of all Tshz1+ dMSNs to punishment and reward.
(F) Trial-by-trial (top) and average (bottom) responses of an example NVN to air puffs of different durations.
(G) Average responses of NVNs to air puffs of different durations (n = 95; F(2,282) = 15.65, ***p < 0.001, one-way ANOVA followed by Tukey’s test).
Data are presented as mean ± SEM. Shaded areas in the activity traces represent SEM. See also Figure S6.
The valence-specific neurons were intermingled with other neurons (Figure 4B; and see Figures S6H and S6I for the composition of “other neurons”). Notably, however, neurons of the same valence stayed closer to each other than neurons of opposite valences (Figure 4B), suggesting spatial clustering of neurons with similar functional properties, a phenomenon similar to that descried for movement-related neurons in the DS (see Barbera et al., 2016; Klaus et al., 2017). Besides the observation that the negative valence neurons are the dominant population, their responses to air puff were also stronger than the responses of the positive valence neurons to water (Figure 4D). As a result, on average, Tshz1+ dMSNs showed robust response to air puff but little response to water (Figure 4E). The responses of negative valence neurons were scaled with the durations of air puffs (Figures 4F and 4G), suggesting that these neurons represent the value of punishment. These properties remained largely unchanged after the Pavlovian conditioning (Figures S6F–S6I), with a notable exception that the fractions of neurons showing response to both air puff and water were significantly reduced (excitation, p = 0.03, inhibition, p = 0.002, χ2 test) (Figure S6I), suggesting a learning-induced increase in response selectivity.
To examine whether Tshz1+ dMSNs respond to different aversive stimuli, we sequentially delivered air puffs and tail shocks to mice while recording their Tshz1+ dMSN activities (Figures S6J and S6K). The shock massively activated Tshz1+ dMSNs, a large fraction of which was also activated by the air puff (Figures S6J and S6K). Overall, these results indicate that a major population of Tshz1+ dMSNs is potently and selectively activated by aversive stimuli or punishment, consistent with and explaining the results from fiber photometry (Figures 3H and 3I; Figure S4).
The Pavlovian conditioning (Figure 5A) induced a significant increase in the fraction of CS-responsive Tshz1+ dMSNs (CS1, excitation, p = 3.0 × 10⁻⁵, inhibition, p = 9.7 × 10⁻⁵; CS2, excitation, p = 4.8 × 10⁻⁴, inhibition, p = 0.002; χ2 test) (Figure 5B) and the emergence of Tshz1+ dMSNs showing selective excitation to cues predicting either punishment or reward (Figures 5C–5F). As a result, robust and sustained predictive signals for punishment and reward could be revealed by projecting the population activities of Tshz1+ dMSNs along the coding direction (Allen et al., 2019; Li et al., 2016), which optimally separated the activities during anticipation of punishment from those during anticipation of reward (Figures 5G and 5H; STAR Methods). Consistent with this observation, the trajectories of Tshz1+ dMSN population in the activity space, which were plotted after dimensionality reduction (Cunningham and Yu, 2014; STAR Methods), during the CS period in punishment trials were markedly different from those in reward trials (Figures 5I and 5J). In addition, the population activities shortly after CS onset can be used to decode punishment and reward (Figure 5K), with decoding accuracy being dependent on learning (Figures 5L and 5M). These results suggest that learning induces valence-specific predictive responses in Tshz1+ dMSN population that can be used to guide behavior.
Figure 5. Learning Induces Predictive Signals in Tshz1+ dMSNs.
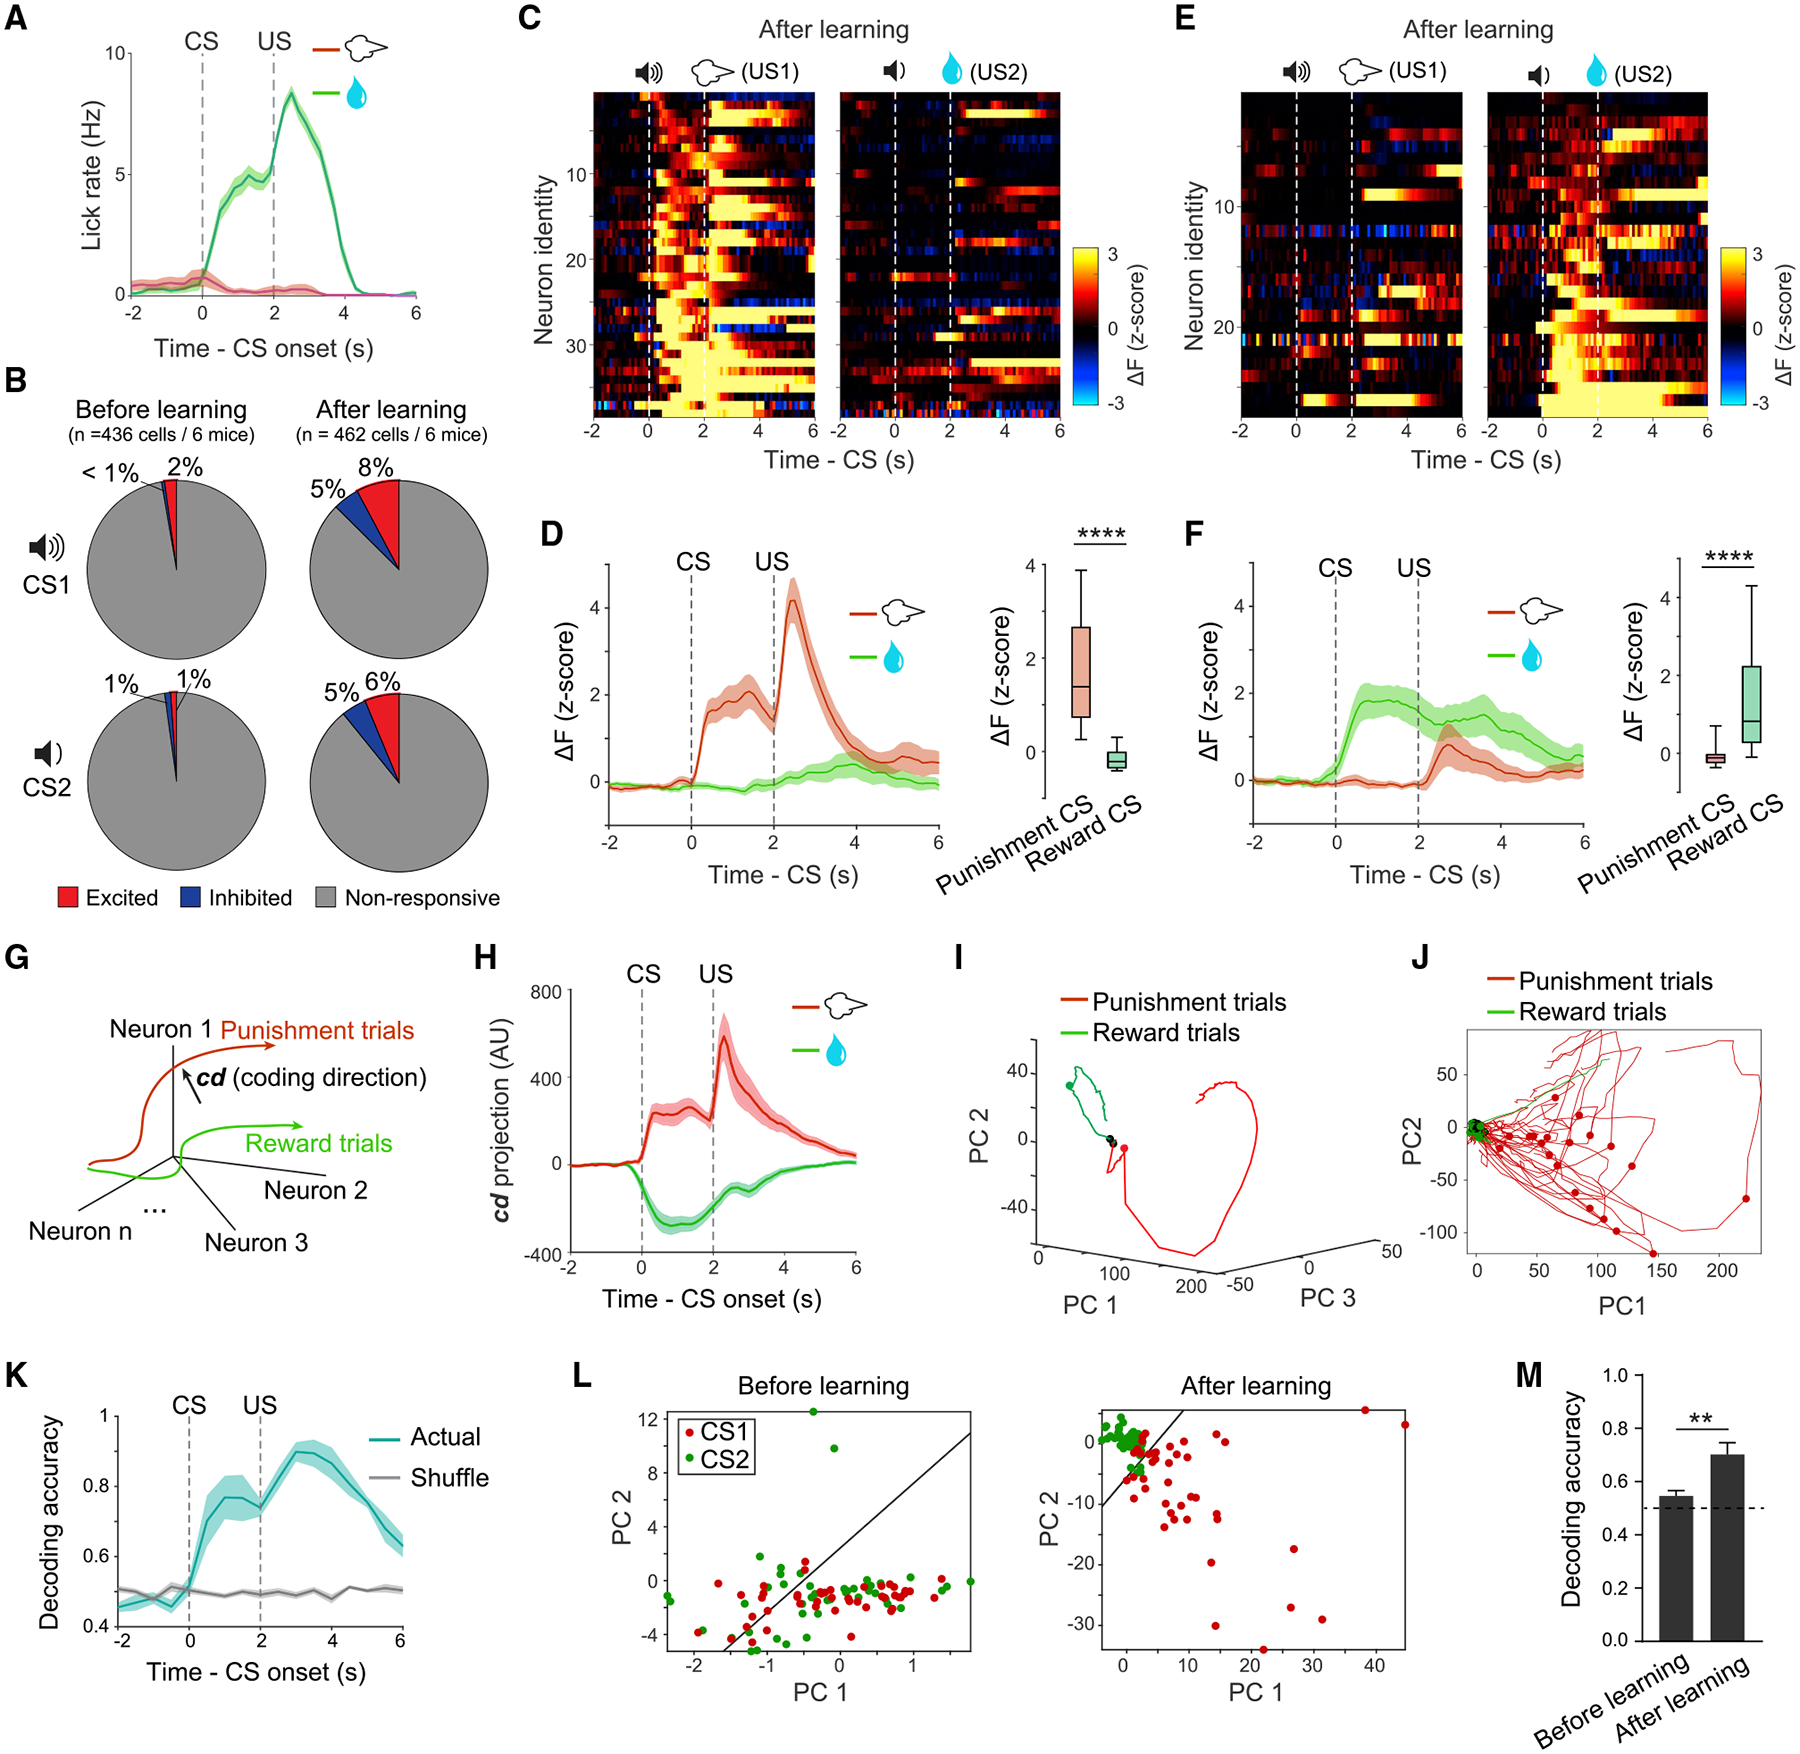
(A) Licking behavior in Pavlovian conditioning. Shown were data from a well-trained mouse in a representative session. Dashed lines indicate the timing of delivery of CS and US.
(B) Pie graphs showing the learning-induced changes in the fractions of Tshz1+ dMSNs responsive to CS1 (excitation, χ2 = 16.8, p = 4.1 × 10⁻⁵; inhibition, χ2 = 14.7, p = 1.2 × 10⁻⁴; χ2 test) or CS2 (excitation, χ2 = 12.1, p = 5.0 × 10⁻⁵; inhibition, χ2 = 9.5, p = 0.0021; χ2 test).
(C) Heatmaps of the responses of individual neurons excited by the punishment CS after training in the Pavlovian conditioning. Each row represents the responses of one neuron in punishment (left) and reward (right) trials. Neurons are sorted according to their responses to the CS predicting air puff.
(D) Left: average responses of all neurons in (C) in different trial types as indicated. Right: quantification of the CS responses of these neurons (****p = 7.7 × 10⁻⁸, Wilcoxon signed-rank test).
(E) Heatmaps of the responses of individual neurons excited by the reward CS after training in the Pavlovian conditioning. Each row represents the responses of one neuron in punishment (left) and reward (right) trials. Neurons are sorted according to their responses to the CS predicting water reward.
(F) Left: average responses of all neurons in (E) in different trial types as indicated. Right: quantification of the CS responses of these neurons (****p = 6.3 × 10⁻⁶, Wilcoxon signed-rank test).
(G) A schematic of the “coding direction” analysis (see STAR Methods), showing how neuronal activities are projected onto the coding direction (cd, a vector schematically denoted by the black arrow).
(H) Tshz1+ dMSN activities in punishment and reward trials projected onto the cd. Data were pooled from 6 mice after training in the conditioning. AU, arbitrary unit.
(I) The trajectories of trial-averaged Tshz1+ dMSN population activities after dimensionality reduction with principal component analysis (PCA). Data were from a representative mouse after training. Black dots indicate CS onset; red or green dots indicate US onset.
(J) The trajectories of trial-by-trial Tshz1+ dMSN population activities after dimensionality reduction with PCA. Data were from a representative mouse after training. Black dots indicate CS onset; red or green dots indicate US onset.
(K) Decoding accuracy across time in a trial, showing that the accuracy increased following CS onset. Actual, decoding analysis using the actual responses of neurons in punishment and reward trials; shuffle, decoding analysis using the responses of neurons that were shuffled across trial types. Responses after training were used for the analysis.
(L) An example of support vector machine (SVM) decoding using the principal components (PCs) of Tshz1+ dMSN population activities during CS period. The responses before (left) and after (right) training in the conditioning were used for the analysis.
(M) Learning improved the accuracy of Tshz1+ dMSN population CS response in decoding punishment versus reward trials (t(10) = 4.37, **p = 0.0014, t test).
Data are presented as mean ± SEM. Shaded areas represent SEM. See also Figure S6.
Tshz1+ dMSNs Represent Distinct Aspects of Avoidance Behavior
In the Pavlovian conditioning (Figures 3C, 4A, and 5A), mice did not engage in active actions in anticipation of, or when experiencing the aversive stimulus, making it difficult to assess how neuronal responses—either the CS or US responses—are related to behavior. To overcome this limitation, we trained additional mice to perform an active avoidance task, during which we imaged the activities of their Tshz1+ dMSNs (Figures 6A and 6B; Figures S6L and S6M; STAR Methods). This task consisted of two types of trials—punishment and neutral—that were randomly interleaved. In punishment trials, a sound (CSP) announced that an air puff would be delivered, but mice could avoid the air puff by running during a decision window following the CS. In neutral trials, another sound (CSN) indicated that nothing would happen (Figure 6B). After training, mice acquired the appropriate action, running during the decision window specifically in punishment trials to avoid the air puff (success trials; Figures 6B and 6C). However, they still made errors, failing to run during the decision window and hence receiving the air puff in some of the punishment trials (failure trials; Figures 6B and 6C; Figure S6M). Therefore, this task engaged with two types of actions: active running in response to CSP in the success trials and reactive running evoked by air puff in the failure trials (Figure 6C; Figure S6M).
Figure 6. Tshz1+ dMSNs Represent Specific Aspects of Active Avoidance.
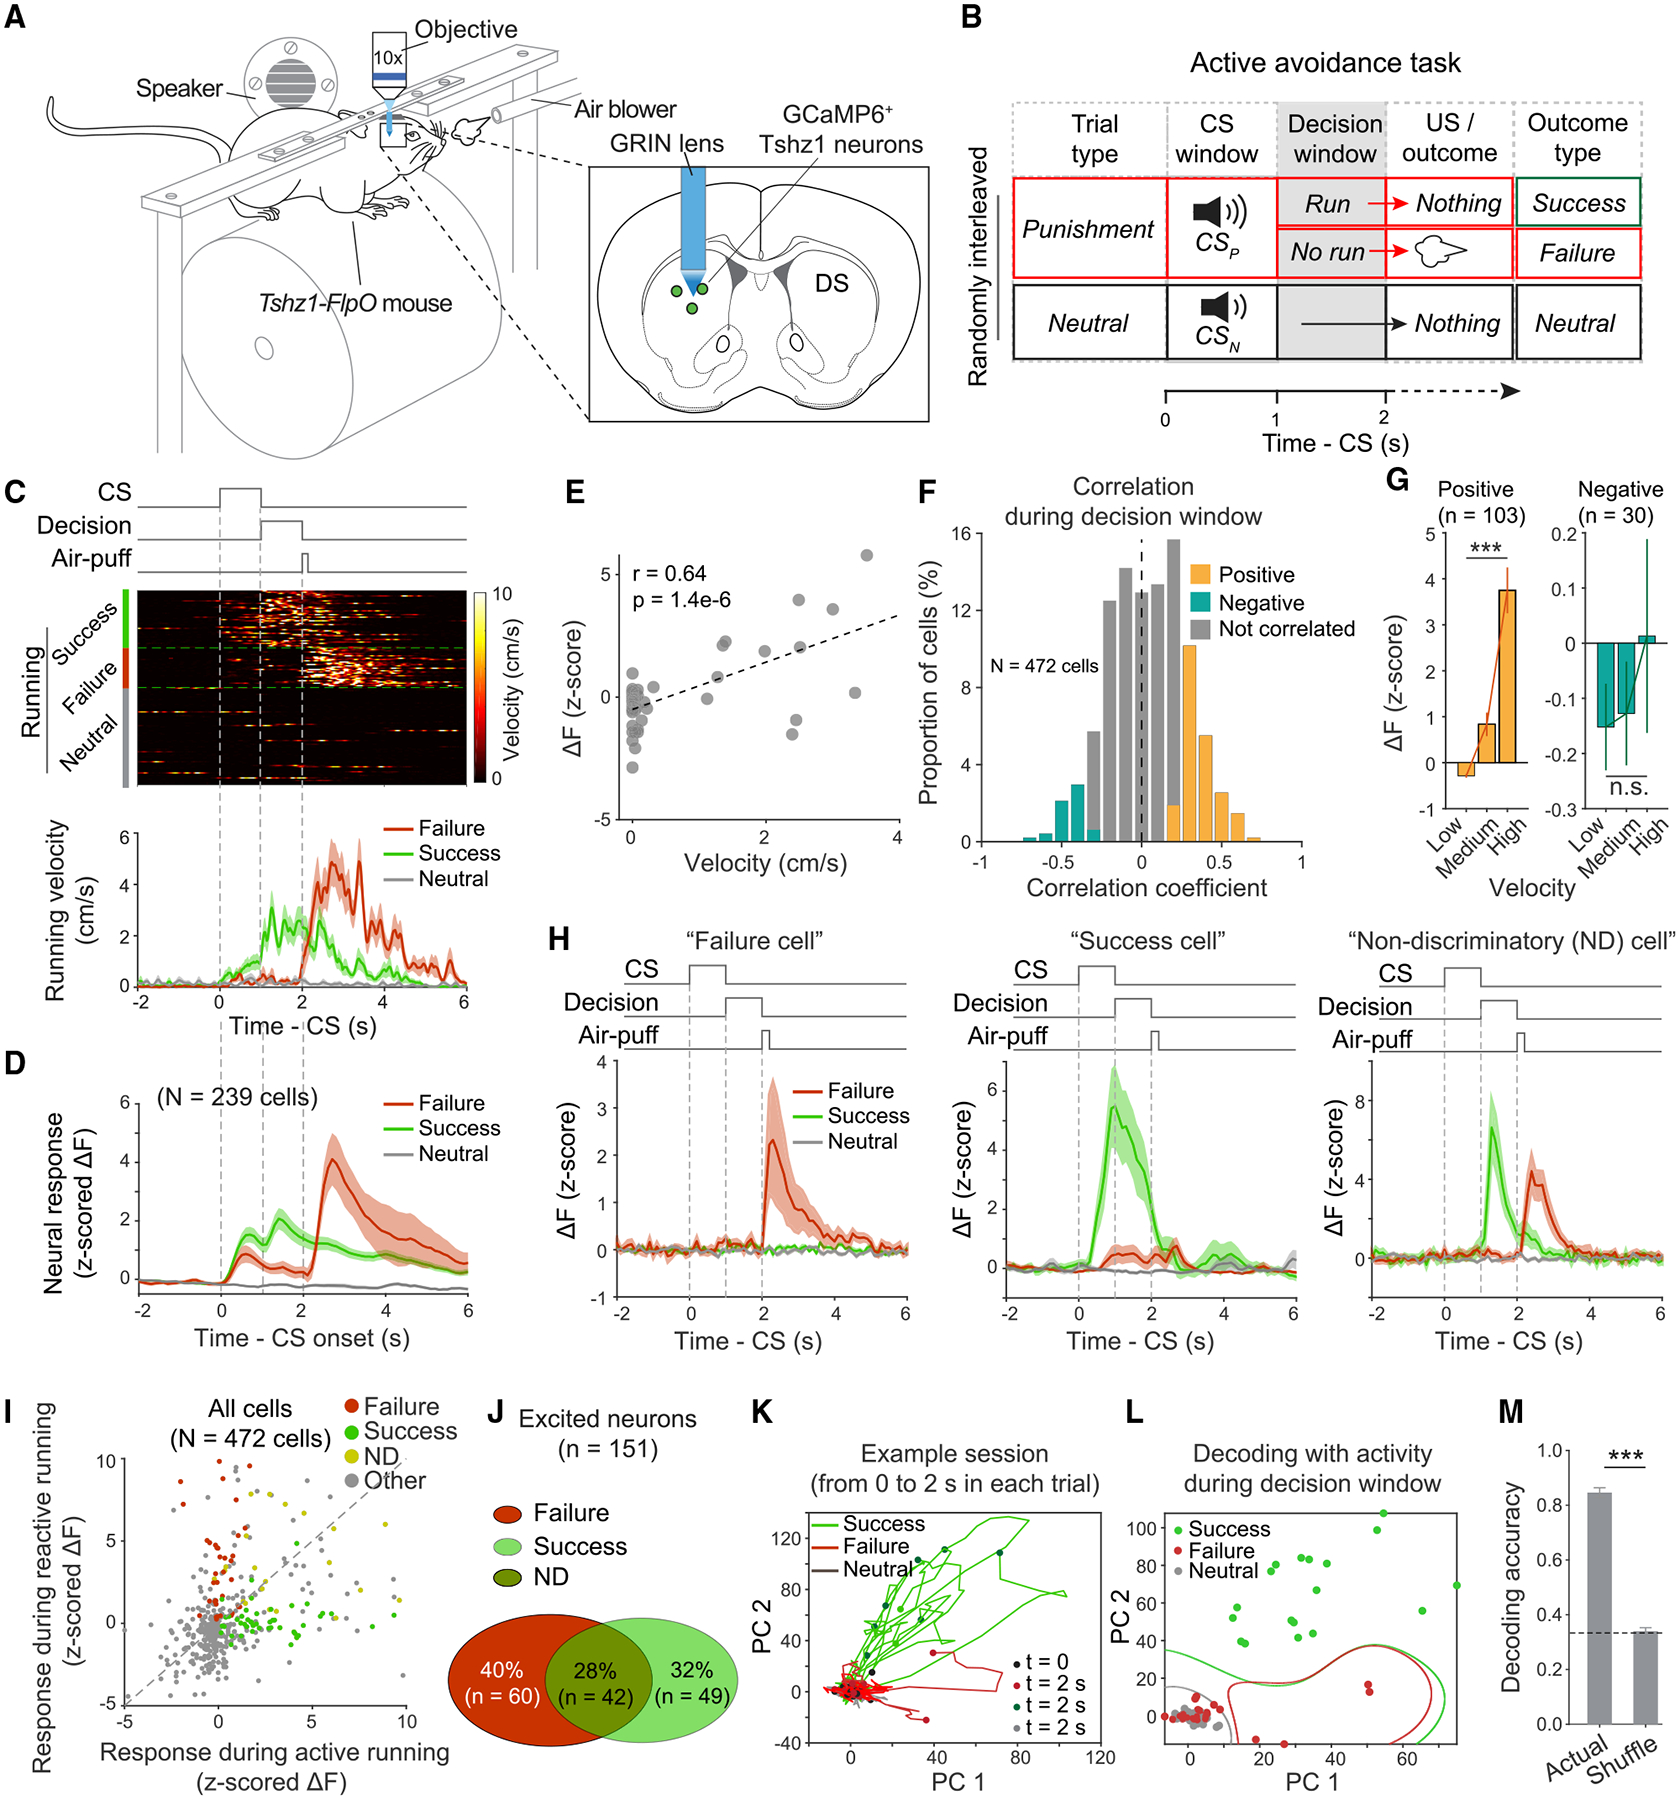
(A) Schematics of the experimental setup and approach.
(B) A schematic of the experimental design.
(C) Top: running events, sorted according to trial types, for a representative mouse in the active avoidance task. Bottom: average running velocity of this mouse in different types of trials as indicated.
(D) Average activity of all the Tshz1+ dMSNs imaged in the mouse in (C).
(E) Correlation between neural activity and running velocity during the decision window in a representative mouse.
(F) Histogram showing the distribution of neurons based on their correlation coefficients calculated as in (E). Yellow, green and gray bars represent neurons showing significant positive (p < 0.05; n = 102), significant negative (p < 0.05; n = 30) and no significant (p > 0.05) correlation, respectively.
(G) Average responses of the neurons showing significant positive and negative correlations in (F), in trials in which running velocities of mice during the decision window were classified as being low, medium, and high. Left, F(2,306) = 41.31, p < 0.0001; right, F(2,87) = 0.52, p = 0.60; one-way ANOVA.
(H) The responses of an example “failure cell,” “success cell,” and “non-discriminatory (ND) cell” in different types of trials in the active avoidance task, as indicated.
(I) A scatterplot of individual Tshz1+ dMSNs’ responses during active running (in success trials) and reactive running (in failure trials). The failure cells, success cells, ND cells, and all other cells are color coded as indicated.
(J) Percentage distribution of the neurons excited during reactive running (failure cells), active running (success cells), and both (ND cells). These cells correspond to the same cells classified in (I).
(K) The trajectories of trial-by-trial Tshz1+ dMSN population activities after dimensionality reduction with PCA. Time 0 indicates CS onset in each trial. Data were from one mouse in an example session.
(L) SVM decoding using the principal components (PCs) of Tshz1+ dMSN population activities during the decision window in an example session.
(M) Performance of the decoding as shown in (L), for failure and success trials (n = 4 sessions). Actual decoding analysis using the actual responses of neurons in failure, success, and neutral trials; shuffle, decoding analysis using the responses of neurons that were shuffled across these trial types.
Data are presented as mean ± SEM. Shaded areas represent SEM. See also Figure S6.
About one-third (151 out of 472) of all the imaged Tshz1+ dMSNs showed running-related excitatory responses, largely resulting in average responses that tracked both the active running in success trials, and the reactive running in failure trials (Figures 6C and 6D; Figures S6L and S6M). Indeed, the responses of many Tshz1+ dMSNs were correlated with running velocities of the mice (Figures 6E–6G). However, the activities of Tshz1+ dMSNs did not merely represent movements because, among the running-excited Tshz1+ dMSNs, a major population (40%) was excited only during the reactive but not active running, whereas another population (32%) was excited only during the active but not reactive running (Figures 6H–6J). As these two populations were selectively excited during either the failure or the success trials, we termed them “failure cells” and “success cells,” respectively. A third population (28%) of the running-excited Tshz1+ dMSNs was excited during both the reactive and the active running (Figures 6H–6J) and was therefore termed “non-discriminatory (ND) cells.” These different classes, which likely overlap with the “negative valence neurons” identified in the Pavlovian task, were related to distinct aspects of the avoidance behavior and may thus have different roles: the failure cells may represent the negative valence or value of air puff and participate in evaluating this negative outcome; the success cells may represent the motivation required to avoid the air puff and participate in invigorating the avoidance; and the ND cells may be involved in both processes.
We next examined how Tshz1+ dMSN population activities might represent the avoidance behavior. We found that the trajectories of the population activities during the decision window in failure trials were markedly different from those in success trials (Figure 6K). Notably, however, the trajectories in failure trials and neutral trials, in which animals were similarly inactive (i.e., not running), were largely indistinguishable (Figure 6K). Consistently, the population activities can be used to accurately decode failure and success trials but not failure and neutral trials (Figures 6L and 6M). These results further support the notion that Tshz1+ dMSNs participate in the generation of behavioral responses to aversive stimuli.
Tshz1+ dMSNs Are Required for Aversive Learning
Our results indicate that Tshz1+ dMSNs are preferentially recruited during behaviors driven by aversive stimuli over those driven by appetitive stimuli. To determine whether these neurons are also preferentially required for behaviors driven by aversive stimuli, we inhibited these neurons in a go/no-go task (Figures 7A–7D). Because the DS is large in volume and therefore only part of it may be accessible to light for effective optogenetic inhibition, we chose to use chemogenetics to achieve selective and reversible inhibition of Tshz1+ dMSNs. To this end, we introduced into these neurons an inhibitory DREADD (designer receptor exclusively activated by designer drug) by bilaterally injecting the DS of Tshz1-2A-FlpO mice (n = 6) with a mixture of two AAVs, one expressing Cre in a Flp-dependent manner and, the other, KORD (a DREADD derived from the kappa-opioid receptor) (Vardy et al., 2015) in a Cre-dependent manner (Figures 7A and 7B). Another group of Tshz1-2A-FlpO mice (n = 6) received bilateral DS injections of an AAV conditionally expressing eYFP and served as the control (Figures 7A–7D). These mice were subsequently trained in the go/no-go task, in which they had to lick during a response window after a “go tone” in order to receive a water reward, and withhold licking following a “no-go tone” in order to avoid an air puff blowing to the face (Figure 7D; STAR Methods).
Figure 7. Chemogenetic Inhibition of Tshz1+ dMSNs Impairs Aversive Learning.
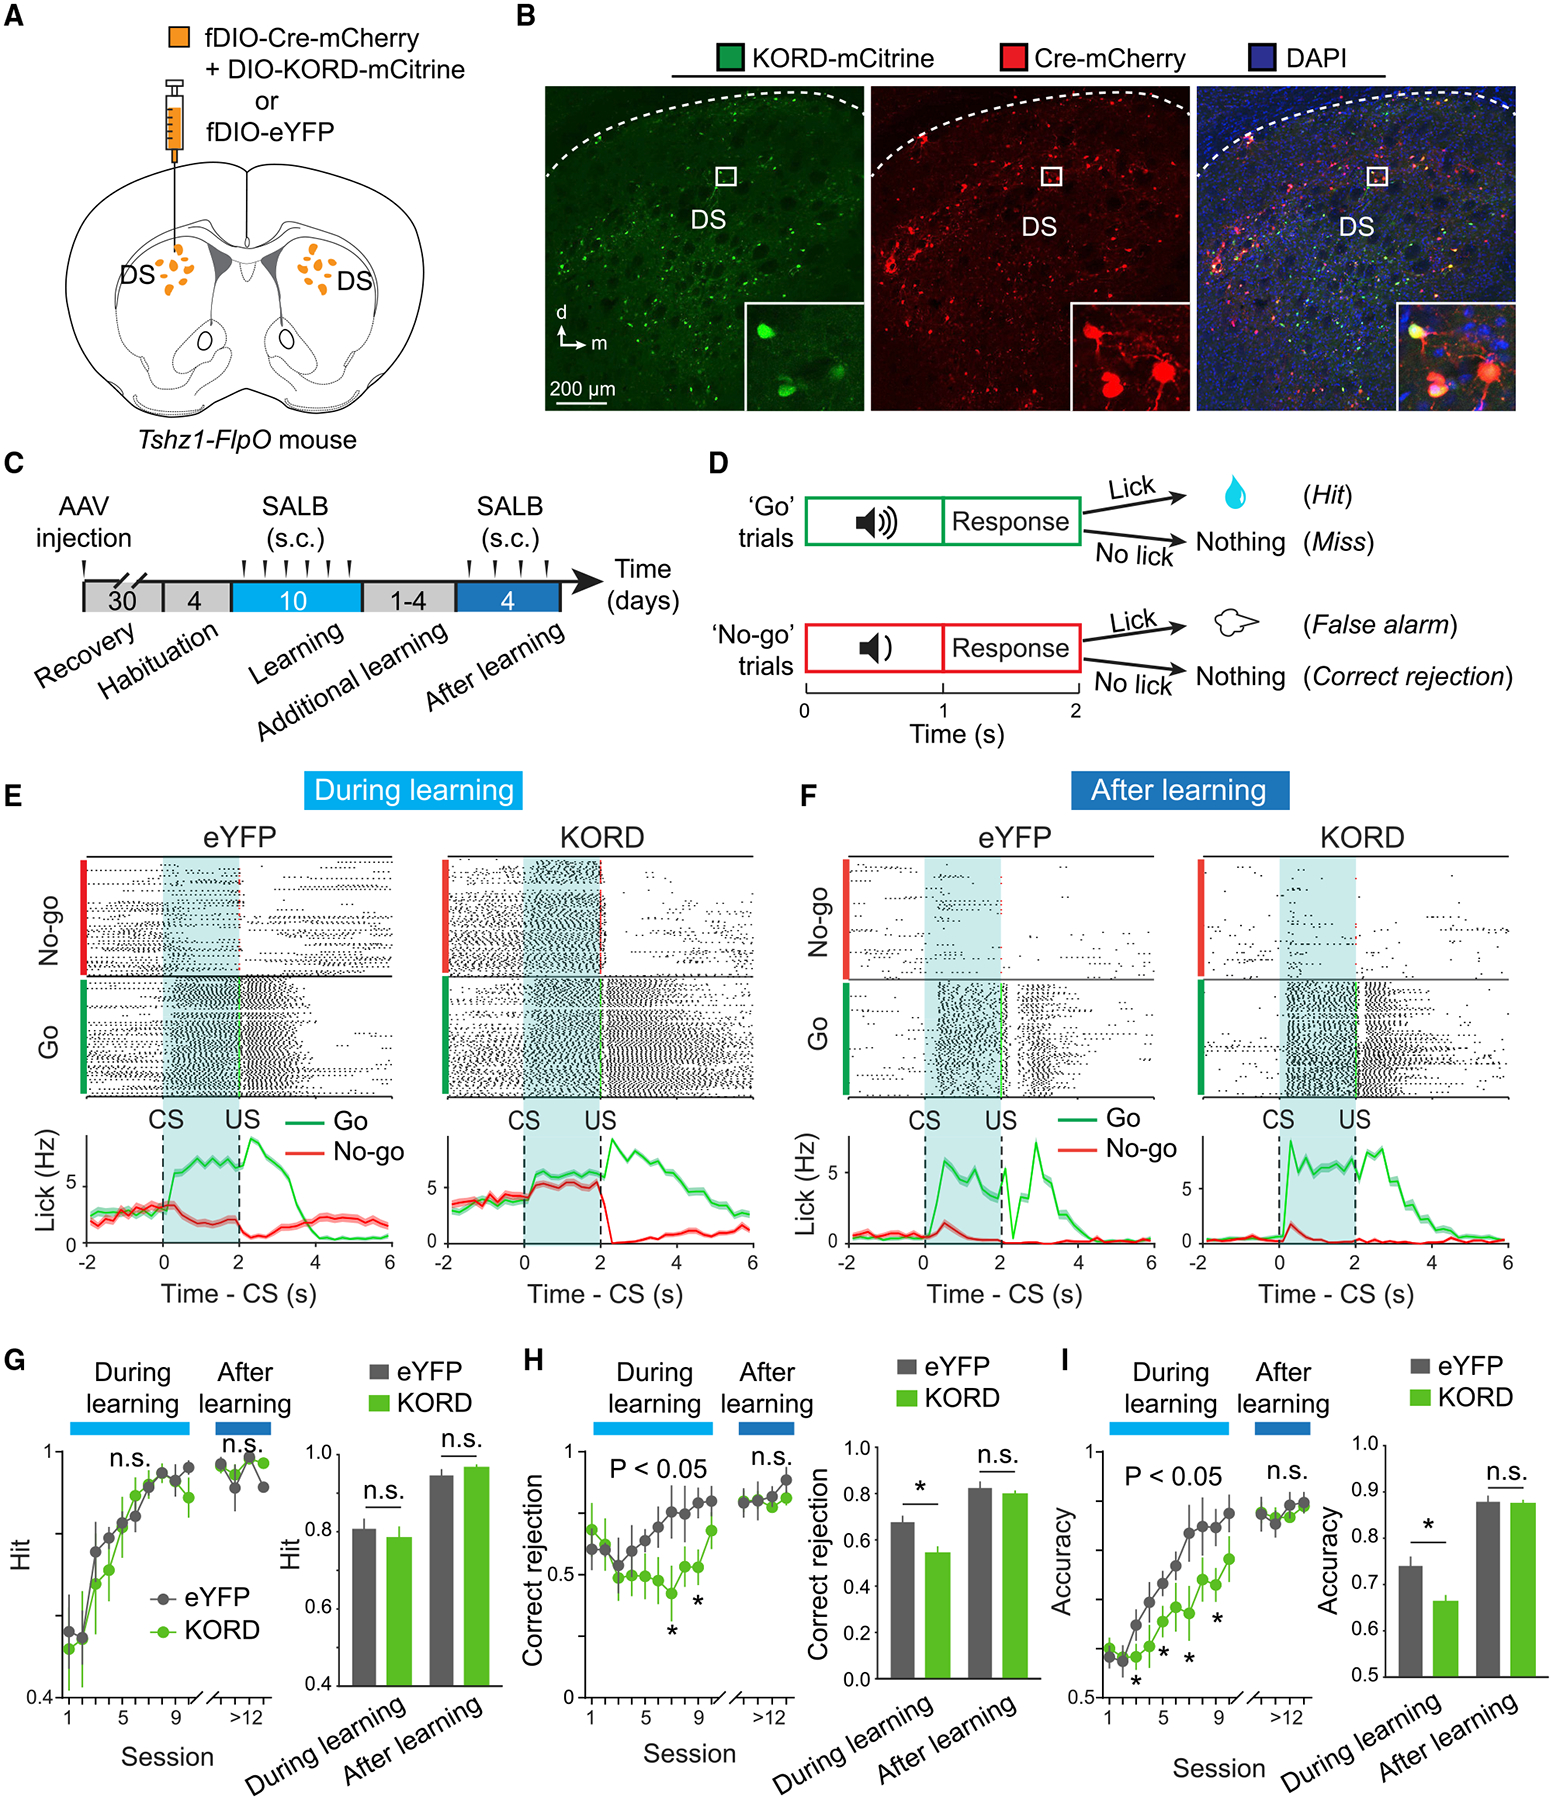
(A) A schematic of the approach.
(B) Representative confocal images showing the expression of KORD (left) and Cre (middle), and the co-expression of the two molecules (right) in Tshz1+ dMSNs. Inset in each panel, a high-magnification image of the boxed region.
(C and D) Schematics of the experimental procedure (C) and the go/no-go task (D).
(E) Licking behavior of example mice, in which the Tshz1+ dMSNs expressed eYFP (left) or KORD (right), in the go/no-go task following treatment with SALB during the learning phase. Top, lick raster; bottom, average lick rate over time (0.2 s bin).
(F) Same as (E), except that data were from mice that fully learned the task.
(G) Hit rate in each session (left) (during learning, F(9,90) = 0.46, p = 0.90; after learning, F(3,30) = 0.36, p = 0.79; two-way ANOVA), and average across sessions (right) (F(1,20) = 0.93, p = 0.35, two-way ANOVA). n.s., non-significant (p > 0.05).
(H) Correct rejection rate in each session (left) (during learning, F(9,90) = 2.14, p = 0.03, *p < 0.05; after learning, F(3,30) = 0.48, p = 0.70; two-way ANOVA followed by Tukey’s test), and average across sessions (right) (F(1,20) = 5.58, p = 0.03; during learning, *p = 0.02; after learning, p = 0.38; two-way ANOVA followed by Tukey’s test).
(I) Overall accuracy in each session (left) (during learning, F(9,90) = 2.14, p = 0.03, *p < 0.05; after learning, F(3,30) = 0.50, p = 0.68; two-way ANOVA followed by Tukey’s test), and average across sessions (right) (F(1,20) = 7.14, p = 0.015; during learning, *p = 0.013; after learning, p = 0.72; two-way ANOVA followed by Tukey’s test).
Data in (E)–(I) are presented as mean ± SEM. Shaded areas in the average traces in (E) and (F) represent SEM. See also Figure S7.
We found that when Tshz1+ dMSNs were inhibited during the training, by systemic application of KORD agonist salvinorin B (SALB) (Vardy et al., 2015), the mice were impaired in learning to withhold licking during no-go trials, resulting in a reduction in the “correct rejection” rate and overall performance (Figures 7E and 7G–7I; Figure S7A). However, these mice were unaffected in learning to lick during go trials and thus had an intact “hit” rate (Figures 7E and 7G). By contrast, when Tshz1+ dMSNs were inhibited after the mice had fully learned the task, their performance was affected in neither the go trials nor the no-go trials (Figures 7F–7I). Inhibiting Tshz1+ dMSNs did not influence licking per se (Figures S7B–S7E) and, notably, also did not affect the air-puff-evoked strong lick-suppression during false alarm in no-go trials during training (Figure S7F). The latter observation, and the result that inhibiting Tshz1+ dMSNs did not affect no-go responses after learning (Figures 7F–7I), suggests that these neurons are not essential for air-puff perception, because in both cases the behavioral responses rely on animals’ ability to sense the air puff. Last, inhibiting Tshz1+ dMSNs did not affect locomotion when the mice were tested in an open field (Figures S7G–S7K). Taken together, our results indicate that Tshz1+ dMSNs are indispensable for learning to avoid punishment but are less critical for learning to obtain reward, expressing well-learned purposeful actions or carrying sensorimotor functions.
DISCUSSION
Tshz1+ dMSNs Are “Unconventional”
Our results demonstrate that Tshz1 demarcates a distinct MSN population in the DS, which is enriched in the striosome and constitute an “unconventional” direct pathway crucial for negative reinforcement and aversive learning. This function of the Tshz1+ dMSNs and the suppressing effect of these neurons on movement are opposite of the functions of the previously described “conventional” direct pathway (Dudman and Krakauer, 2016; Frank et al., 2004; Hikosaka et al., 2019; Kravitz et al., 2010, 2012; Kravitz and Kreitzer, 2012; Nonomura et al., 2018; Shin et al., 2018). By contrast, Pdyn+ dMSNs, which are also enriched in the striosome, show properties that resemble those of the conventional direct pathway, promoting reward or positive reinforcement and facilitating movement. The functional divergence between Tshz1+ dMSNs and Pdyn+ dMSNs is likely rooted in the different connectivity of these neurons. Indeed, we show that these two populations receive distinct sets of monosynaptic inputs.
These neurons may also differentially project onto and regulate the function of distinct postsynaptic target neurons. In this regard, recent studies show that striosomal MSNs are the major source of inputs onto the habenula-projecting GPi (GPh) neurons (Hong et al., 2019; Stephenson-Jones et al., 2016; Wallace et al., 2017; Figure S7L), which are essential for evaluating negative and positive outcomes during reinforcement learning (Hong and Hikosaka, 2008; Stephenson-Jones et al., 2016). Therefore, it is conceivable that Tshz1+ dMSNs and Pdyn+ dMSNs convey information about punishment and reward by activating (via disinhibition) or inhibiting GPh neurons, respectively, thereby contributing to evaluating behavioral outcomes or motivating valence-specific behaviors (Figure S7L). Alternatively, or in addition, Tshz1+ dMSNs and Pdyn+ dMSNs could influence learning or motivation via projections to midbrain dopamine areas (Figure S7L), which have been shown to receive direct inputs from striosomal neurons (Crittenden et al., 2016; Fujiyama et al., 2011). How exactly these two populations regulate GPh neurons or dopamine neurons to influence behavior is an important question for future research. Future studies should also assess the connectivity between Tshz1+ dMSNs and Pdyn+ dMSNs and elucidate how these two populations interact during behavior.
Tshz1+ dMSNs Contribute to Distinct Aspects of Negative Reinforcement
Recent imaging studies show that the activities of individual dMSNs or iMSNs in the DS, targeted with the D1-Cre or A2A-Cre transgenic mice, respectively, correlate with the velocity of animals’ self-initiated natural locomotion (Barbera et al., 2016; Klaus et al., 2017; Parker et al., 2018). Similar observations have been made on dopaminergic inputs to the DS (Howe et al., 2019; Howe and Dombeck, 2016). This correlation likely represents the function of matrix neurons (Amemori et al., 2011; Crittenden and Graybiel, 2016), which can be preferentially imaged as the matrix compartment occupies a much larger fraction of the DS than the striosome (Gerfen, 1992; Graybiel and Ragsdale, 1978). We found that in the active avoidance task, the activities of many Tshz1+ dMSNs also appear to correlate with animals’ running velocity. However, the running-related Tshz1+ dMSNs did not simply represent movements in this task, because a major population of these neurons (the “failure cells”) was activated only during the reactive running induced by air puff in failure trials but not during the active running in anticipation of the air puff in success trials, whereas another population (the “success cells”) behaved in an opposite manner.
It is important to recognize that the speed of movement in the active avoidance task can reflect the affective state of an animal, which likely does not change in simple, self-initiated locomotion. Thus, the speed of mice during the reactive running may reflect the perceived value of a punishment (i.e., the air puff), whereas the speed during the active running may reflect the anticipated value of a future punishment and hence the vigor to avoid it. In such a scenario, an ostensible relationship between Tshz1+ dMSN activation and reactive or active running may in fact indicate that these neurons participate in distinct affective processes. The failure cells may encode the value of punishment and contribute to evaluating and updating negative outcomes when animals experience punishment. This notion is consistent with the observations that Tshz1+ dMSNs encode the values of air puffs (Figures 4F and 4G; Figures S4F and S4G), and the activity of Tshz1+ dMSNs is required for aversive learning in the go/no-go task (Figure 7; Figure S7). On the other hand, the success cells may represent the anticipated value of a future punishment and thus contribute to invigorating avoidance in anticipation of the punishment. This function bears a resemblance to the previously described “negative motivation” or “aversive salience” (Berridge, 2012, 2018). The ND cells may contribute to both the evaluation and the invigoration functions, as they are activated during both the experience and the anticipation of air puff. Although inhibition of Tshz1+ dMSNs did not affect no-go responses after learning (Figure 7), this may reflect the fact that a “no-go” (i.e., no-licking) response requires little effort in a well-trained animal. It remains to be tested whether Tshz1+ dMSN activity is required for invigorating a more demanding active avoidance.
The firing of Tshz1+ dMSNs could also be modulated by the sensory properties of stimuli, such as those of air puff and shock. Notwithstanding, as is the case with movement velocity, the responses of these neurons do not merely represent sensory properties per se, because, for example, the success cells were not responsive to the air puff, and the ND cells were activated irrespective of the air puff. Overall, our results suggest that the encoding of Tshz1+ dMSNs can be best described as being tuned to aversive stimuli, as well as the behavioral actions and affective states evoked by or in anticipation of aversive stimuli.
In summary, while the Pavlovian conditioning task allowed us to operationally identify “negative valence neurons” as a major population of Tshz1+ dMSNs, results based on the active avoidance task uncover that these neurons can be classified into sub-populations—”failure cells,” “success cells” and “ND cells”—which may subserve distinct roles in reinforcement learning.
Toward Understanding MSN Diversity and Striosome Function
Recent molecular studies increasingly recognize the diversity of MSNs in the DS (Saunders et al., 2018; Stanley et al., 2020; Zeisel et al., 2018). In parallel, it has been shown that iMSNs have divergent functions, capable of supporting positive reinforcement (Vicente et al., 2016) besides the well-known role of this population in negative reinforcement. These findings urge investigations in the DS beyond just D1 or D2 MSNs. By focusing on Tshz1+ dMSNs, our study uncovers previously unknown functions of the direct pathway and furthermore identifies a major role of the striosome, which has so far been challenging to pinpoint with traditional methods (Amemori et al., 2011; Hong et al., 2019).
One issue in our study is that, despite the fact that Tshz1+ dMSNs are highly enriched in the striosome, they were also found scattered in areas outside of the striosome. This issue was also recognized in recent studies that exploited genetic strategies for labeling striosomal MSNs (Bloem et al., 2017; Kelly et al., 2018; Smith et al., 2016; Yoshizawa et al., 2018). However, those genetically labeled MSNs outside of the “boundary” of the striosome (or being “extra-striosomal”) could still be developmentally and functionally similar to those within the boundary, and different from the classic matrix neurons (e.g., see Kelly et al., 2018; Smith et al., 2016), for two reasons. First, the striosome is defined as the areas within the DS that have high levels of expression of MOR (Gerfen, 1992). However, because MOR expression levels—which are usually measured with immunohistochemistry—follow gradients, rather than being all or none, it is often impossible to draw lines in the DS to unambiguously mark where the striosome stops (and where the matrix starts). Thus, a true striosomal neuron can be mistaken as a matrix one. Second, with regard to Tshz1+ dMSNs, our imaging results indicate that their distinct functional classes do not form spatial clusters within the entire population (Figure 4B), suggesting that Tshz1+ dMSNs are not functionally segregated according to them being striosomal or extra-striosomal.
Of note, recent studies indicate that TSHZ1 deletion in humans is linked with mood disorders including depression (Daviss et al., 2013), and forebrain Tshz1 deletion in mice leads to depression-like behaviors (Kuerbitz et al., 2018). Such genetic lesions likely cause deficits in the development or function of Tshz1+ dMSNs. In light of these findings and those that the basal ganglia (Gunaydin and Kreitzer, 2016), in particular, the striosome (Crittenden and Graybiel, 2011, 2016; Crittenden et al., 2016; Friedman et al., 2017, 2015; Hurd and Herkenham, 1993), are affected in mood and motivational disorders, our results point to an avenue of research toward a deeper understanding of how the basal ganglia are involved in disorders of motivational regulation, and in motivated behaviors in general.
STAR★METHODS
RESOURCE AVAILABILITY
Lead Contact
Further information and requests for resources and reagents should be directed to and will be fulfilled by the Lead Contact, Bo Li (bli@cshl.edu).
Materials Availability
The Tshz1-2A-FlpO knock-in mouse driver line generated in this study is currently under preparation for being deposited to Jackson Laboratory.
Data and Code Availability
The custom code that support the findings from this study are available from the Lead Contact upon request.
EXPERIMENTAL MODEL AND SUBJECT DETAILS
Male and female mice (2–4 months old) were used for all the experiments. Mice were housed under a 12-h light/dark cycle (8 a.m. to 8 p.m. light) in groups of 2–5 animals, with food and water available ad libitum before being used for experiments. All behavioral experiments were performed during the light cycle. Littermates were randomly assigned to different groups prior to experiments. All mice were bred onto a C57BL/6J background. All experimental procedures were approved by the Institutional Animal Care and Use Committee of Cold Spring Harbor Laboratory (CSHL) and performed in accordance to the US National Institutes of Health guidelines.
The Tshz1-2A-FlpO knock-in mouse driver line, in which the expression of an optimized flippase recombinase (FlpO) is driven by the endogenous Tshz1 promoter, was generated as previously described (He et al., 2016; Taniguchi et al., 2011). A gene-targeting vector for Tshz1-2A-FlpO was generated using a PCR-based cloning approach (Taniguchi et al., 2011) to insert a 2A-FlpO construct immediately after the STOP codon of the Tshz1 gene. The targeting vector was linearized and transfected into a 129SVj/B6 F1 hybrid ES cell line (V6.5, Open Biosystems). G418-resistant ES clones were first screened by PCR and then confirmed by Southern blotting using probes against the 5′ and 3′ homology arms of the targeted site.
The D1-Cre and A2A-Cre BAC transgenic mice (RRID MMRRC_029178-UCD and MMRRC_036158-UCD, respectively, available at MMRRC) were provided by Dr. A. Zador at CSHL). The Frt-Stop-Frt-TdTomato reporter allele, which has a Frt-flanked STOP cassette preventing transcription of a CAG promoter-driven red fluorescent protein variant (tdTomato), was inserted into the Gt(ROSA)26Sor locus and was developed as described (He et al., 2016). The Pdyn-IRES-Cre (Stock No: 027958) and Ai14 (Stock No: 007908) were purchased from Jackson Laboratory.
METHOD DETAILS
Immunohistochemistry
Immunohistochemistry experiments were conducted following standard procedures (Stephenson-Jones et al., 2016). Briefly, mice were anesthetized with Euthasol (0.4 ml; Virbac, Fort Worth, Texas, USA) and transcardially perfused with 30 mL of PBS, followed by 30 mL of 4% paraformaldehyde (PFA) in PBS. Brains were extracted and further fixed in 4% PFA overnight followed by cryoprotection in a 30% PBS-buffered sucrose solution for 36–48 h at 4°C. Coronal sections (50-μm) were cut using a freezing microtome (Leica SM 2010R, Leica). Sections were first washed in PBS (5 min), incubated in PBST (0.3% Triton X-100 in PBS) for 30 min at room temperature (RT) and then washed with PBS (3 × 5 min). Next, sections were blocked in 5% normal goat serum in PBST for 30 min at RT and then incubated with primary antibodies overnight at 4°C. Sections were washed with PBS (3 × 5 min) and incubated with fluorescent secondary antibodies at RT for 2 h. In some experiments (as indicated in Figures and Supplemental Figures), sections were washed twice in PBS, incubated with DAPI (4′,6-diamidino-2-phenylindole, Invitrogen, catalog number D1306) (0.5μg/ml in PBS) for 2 min. After washing with PBS (3 × 5 min), sections were mounted onto slides with Fluoromount-G (eBioscience, San Diego, California, USA). Images were taken using a LSM 710 laser-scanning confocal microscope (Carl Zeiss, Oberkochen, Germany). The primary antibodies used were: rabbit anti-μ-opioid receptor (MOR) (Immunostar, Inc., Hudson, WI, USA; catalog number 24216; dilution 1:500), rabbit anti-tyrosine hydroxylase (TH) (Millipore, catalog number AB152; dilution 1:1000), chicken anti-GFP (Aves Labs, catalog number GFP1020, lot number GFP697986; dilution 1:1000), rabbit anti-RFP (Rockland, catalog number 600-401-379, lot number 34135; dilution 1:1000), rabbit anti-HA-Tag (C29F4, Cell Signaling, catalog number 3724S; dilution 1:1000), mouse anti-Parvalbumin (MAB1572, Millipore; dilution 1:1000), rabbit anti-Somatostatin-14 (T-4103, Peninsula Laboratories; dilution 1:1000), goat anti-ChAT (AB144P, Millipore; dilution 1:500). Appropriate fluorophore-conjugated secondary antibodies (Life Technologies) were used depending on the desired fluorescence colors.
Fluorescent in situ hybridization
Single molecule fluorescent in situ hybridization (ACDBio, RNAscope) was used to detect the expression of Drd1, Drd2, Pdyn and tdTomato (as an indicator for Tshz1) mRNAs in the dorsal striatum (DS) and nucleus accumbens (NAc) of adult Tshz1-2A-FlpO;Frt-Stop-Frt-tdTomato mice, which express tdTomato under the control of the endogenous Tshz1 promoter. For tissue preparation, mice were first anesthetized under isoflurane and then decapitated. Their brain tissue was first embedded in cryomolds (Sakura Finetek, Ref 4566) filled with M-1 Embedding Matrix (Thermo Scientific, Cat. No. 1310) then quickly fresh-frozen on dry ice. The tissue was stored at −80°C until it was sectioned with a cryostat. Cryostat-cut sections (16-μm) containing the DS or NAc were collected and quickly stored at −80°C until processed. Hybridization was carried out using the RNAscope kit (ACDBio).
The day of the experiment, frozen sections were post-fixed in 4% PFA in RNA-free PBS (hereafter referred to as PBS) at RT for 15 min, then washed twice in PBS (2 minutes each), dehydrated using increasing concentrations of ethanol in water (50%, once; 70%, once; 100%, twice; 5 min each). Sections were then dried at RT and incubated with Protease IV for 30 min at RT. Sections were washed in PBS three times (5 min each) at RT, then hybridized. Probes against Drd1 (Cat. No. #406491, dilution 1:50), Drd2 (Cat. No. #406501, dilution 1:50), Pdyn (Cat. No. #318771, dilution 1:50) and tdTomato (Cat. No. #317041, dilution 1:50) were applied to DS or NAc sections. Hybridization was carried out for 2 h at 40°C. After that, sections were washed twice in PBS (2 min each) at RT, then incubated with three consecutive rounds of amplification reagents (30 min, 15 min and 30 min, at 40°C). After each amplification step, sections were washed twice in PBS (2 min each) at RT. Finally, fluorescence detection was carried out for 15 min at 40°C. Sections were then washed twice in PBS (2 min each), incubated with DAPI for 2 min, washed twice in PBS (2 min each), then mounted with coverslip using mounting medium. Images were acquired using an LSM780 confocal microscope with a 20x or 40x lens, and visualized and processed using ImageJ and Adobe Illustrator.
Viral vectors
The following adeno-associated viruses (AAVs) were produced by K. Deisseroth’s lab at Stanford University: AAV8-Ef1a-fDIO-GCaMP6m, AAVdj-hSyn-CreOFF/FlpON-hChR2(H134R)-eYFP, AAVdj-hSyn-CreON/FlpOFF-hChR2(H134R)-eYFP, AAV8-EF1a-fDIO-Cre-p2A-mCherry (which expresses Cre in a Flp-dependent manner). The following AAVs were produced by the University of North Carolina vector core facility (Chapel Hill, North Carolina, USA): AAV5-Ef1a-DIO-hChR2(H134R)-eYFP, AAV9-CAG-Flex-GFP, AAVdj-hSyn-CreOFF/FlpON-hChR2(H134R)-eYFP, AAVdj-EF1a-fDIO-eYFP, AAV8-hSyn-DIO-KORD-IRES-Mcitrine. The AAV2/8-Ef1a-fDIO-TVA-mCherry was produced by Z. Josh Huang’s lab at CSHL. The retroAAV2-CBA-fDIO-Cre was packaged by Vigene Biosciences (Rockville, MD, USA). The following viruses, which are components of the optimized rabies viral tracing system (Reardon et al., 2016), were produced by HHMI Janelia Research Campus: AAV9-CAGGS-Flex-mKate-T2A-TVA, AAV9-CAGGS-Flex-mKate-T2A-N2c-G, Rbv-CVS-N2c-dG-GFP (the modified rabies virus). The AAV8-hSyn-DIO-mCherry was produced by Addgene (Watertown, MA, USA). All viral vectors were aliquoted and stored at −80°C until use.
Stereotaxic surgery
All surgery was performed under aseptic conditions and body temperature was maintained with a heating pad. Standard surgical procedures were used for stereotaxic injection and implantation, as previously described (Stephenson-Jones et al., 2016; Zhang and Li, 2018). Briefly, mice were anesthetized with isoflurane (1–2% in a mixture with oxygen, applied at 1.0 L/min), and head-fixed in a stereotaxic injection frame, which was linked to a digital mouse brain atlas to guide the targeting of different brain structures (Angle Two Stereotaxic System, myNeuroLab.com). Lidocaine (20 μl) was injected subcutaneously into the head and neck area as a local anesthetic.
We first made a small cranial window (1–2 mm2) in each mouse. To prepare mice for the imaging experiments, we lowered a glass micropipette (tip diameter, ~5 μm) containing viral solution to reach the right dorsal striatum (coordinates: 0.8 mm anterior to Bregma, 1.60 mm lateral from midline, and 2.6 mm vertical from brain surface). About 0.4–0.6 μL of viral solution was delivered with pressure applications (5–20 psi, 5–20 ms at 1 Hz) controlled by a Picrospritzer III (General Valve) and a pulse generator (Agilent). The rate of injection was ~20 nl/min. The pipette was left in place for 10–15 min following the injection, and then slowly withdrawn. One week later, we performed the second surgery, in which a GRIN lens (diameter, 0.6 or 1 mm, length, 7.3 or 4.0 mm, respectively; Inscopix) was implanted such that the tip of the lens was at the same coordinates as those of the injection site. The GRIN lens was slowly (~100 μm/min) lowered to the target area and then fixed in place using self-adhesive resin cements (3M, Catalog Number, 56848). A metal head-bar (for head-restraint) was subsequently mounted onto the skull with black dental cement (Ortho-Jet). We waited for a minimum of 6 weeks before starting the imaging experiments in these mice.
To prepare mice for the optogenetic experiments, we first injected the targets in both hemispheres with viruses, and subsequently implanted optic fibers to the injection locations. A head-bar was also mounted for head-restraint. Viruses were injected at a total volume of approximately 0.4–0.6 μl, and were allowed at least 4 weeks for expression. Viral injection or optic fiber implantation was performed at the following stereotaxic coordinates for the DS: 0.8 mm anterior to Bregma, 1.6 mm lateral from midline, 2.60 mm ventral from cortical surface; GPi: 1.45 mm posterior to Bregma, 2.0 mm lateral from midline, 4.2 mm ventral from cortical surface; and SNr: 3.64 mm posterior to Bregma, 1.2 mm lateral from midline, 4.2 mm ventral from cortical surface. We waited for a minimum of 4 weeks before starting the optogenetic experiments in these mice.
Real-time place aversion or preference test
Freely moving mice were initially habituated to a two-sided chamber (23 × 33 × 25 cm; made from Plexiglas) for 10 min, during which their baseline preference for the left or right side of the chamber was assessed. During the first test session (10 min), we assigned one side of the chamber (counterbalanced across mice) as the photo-stimulation side, and placed the mice in the non-stimulation side to start the experiment. Once the mouse entered the stimulation side, photo-stimulation (5-ms pulses, 20 Hz, 10 mW (measured at the tip of optic fibers)), generated by a 473-nm laser (OEM Laser Systems Inc., Bluffdale, Utah, USA), was immediately turned on, and was turned off as soon as the mouse exited the stimulation side. In the second test session (10 min) we repeated this procedure but assigned the other side of the chamber as the stimulation side. The behavior of the mice were videotaped with a CCD camera interfaced with Ethovision software (Noldus Information Technologies), which was also used to control the laser stimulation and extract behavioral parameters (position, time, distance and velocity).
Choice task
Thirsty mice were first trained to drink water at either one of the two side-ports (left or right) for two days. The mice were subsequently trained in a forced-choice situation, in which they needed to poke their nose into a center-port, and learn that poking into the center-port would turn on the light at one side-port each time, and would also make water available at the same side-port. Mice could then collect the water reward at that port, but not at the other port. After 5–10 days of training, mice performed the forced choice task with > 90% accuracy. Next, the mice were tested in a free-choice situation, during which poking the center-port would turn on the lights at both of the side-ports. The mice could then collect the water reward at either one of these ports.
Each test session consisted of 20 forced-choice trials followed by 180 free-choice trials. In each session we designated one side-port (counterbalanced across mice) as the photo-stimulation port, whereby drinking water was paired with photo-stimulation in the DS. The photo-stimulation (10-ms pulses, 20 Hz, 10 mW; λ = 473 nm) was applied for 1 s immediately following mouse’s entry into the side-port. Because mice might have a bias toward one of the side-ports, we tested the mice in two sessions, with each session having a different side-port designated as the photo-stimulation port. The choice percentage at the photo-stimulation port (or the other port) were calculated based on all the choices made across the two sessions. If the mouse initiated a trial by entering the center-port, but made no selection, such a trial would not contribute to the choice percentage. The optic fibers used for the photo-stimulation were 200 μm in diameter (Newdoon, Hangzhou, China; or Inper, Hangzhou, China) and transmitted light with > 90% efficiency when tested before implantation.
Self-stimulation test
Freely moving mice were placed in a chamber equipped with two ports. Poking into one of the ports (the active port) triggered photo-stimulation for 2 s in the DS (5-ms pulses, 20 Hz, 10 mW; λ = 473 nm), whereas poking into the other port (the inactive port) did not trigger photo-stimulation. Mice were allowed to freely poke the two ports and were tested in two 1-h sessions, with one session per day and the designation of active port in each session being counterbalanced.
Pavlovian conditioning task
One month after surgery mice were subjected to a water-deprivation schedule and trained on an auditory classical conditioning task, during which the mice were head restrained using custom-made clamps and the head-bars mounted on the skull. Each mouse was habituated to head-restraint for one day prior to training. During training, each trial began with a conditioned stimulus (CS), which was a 1 s sound (3 kHz or10 kHz), followed by a 1 s delay and then an unconditioned stimulus (US; the outcome). The outcome was either a water reward (5 μl) or an air-puff (200 ms). The air-puff was delivered toward the animal’s face. In each session, reward and punishment trials were presented in two sequential blocks, with each cue chosen pseudo-randomly.
A metal spout was placed in front of the mouth of the mice for water delivery. The spout also served as part of a custom “lickometer” circuit, which registered a lick event each time a mouse completed the circuit by licking the spout. A custom software written in MATLAB (The MathWorks, Inc., Natick, Massachusetts, USA) was used to control the delivery of CSs and USs and record licking events through a Bpod State Machine (Sanworks, Stony Brook, NY, USA) during conditioning.
Active avoidance task
This task was designed to train mice to actively avoid punishment. Mice were first habituated to freely moving on a wheel under head-restraint for 2–4 days, one session (30~45 min) per day, and were subsequently subjected to conditioning that included different types of trials. In the punishment trials, a 1 s 10-kHz tone (CSP) was presented, followed by a 1 s decision window. If mice ran above a threshold speed (10 cm/s) during the decision window, they would avoid an unpleasant air-puff (40 psi, 100 ms) blowing to the face, in an area close to the eye. Otherwise mice would receive the air-puff immediately after the decision window. In the neutral trials, a 1 s white noise (CSN) was presented. The CSN was followed by nothing and served as a control. The different types of trials were randomly interleaved. The inter-trial interval was randomly variable between 10 to 16 s. Animals were trained one session per day, with each session consisting of ~100 trials.
Go/no-go task
Thirsty mice were trained in an auditory go/no-go task under head restraint. Training started with habituation, during which mice received water rewards by licking the water spout (2 μl for each lick). No auditory stimulus was presented. Once mice reliably licked the spout (2–3 days), they were subjected to the go/no-go training that included both “go trials” and “no-go trials.” In go trials, an auditory stimulus (the “go cue,” 1 s in duration) was delivered, followed by a 1 s delay (the “response window”). Licking during the response window was rewarded with a drop of water (5 μl). In no-go trials, a different auditory stimulus (the “no-go cue,” 1 s) was delivered, followed by a response window (1 s). Liking during the response window was punished by an air-puff blowing to the face. The go trials and no-go trials were randomly interleaved. For analysis, trials were sorted into go trials and no-go trials. A correct response during a go trial (“hit”) occurred when the mouse successfully licked the spout during the response window and subsequently received the water reward. A correct response during a no-go trial (“correct rejection”) occurred when the mouse successfully withheld lick response during the response window and thus avoided the air-puff. The overall performance was calculated as the total correct responses divided by the total trials: overall performance = (hits + correct rejects) / (total trials).
To test the behavioral effects of inhibiting Tshz1+ dMSNs in the go/no-go task, we introduced KORD (a DREADD derived from the kappa-opioid receptor) (Vardy et al., 2015) or eYFP (as the control) into these neurons in mice with viruses, and treated these mice with the KORD agonist salvinorin B (SALB) (Vardy et al., 2015) (10 mg/kg of body weight, subcutaneous (s.c.) injection) 15 min before behavioral testing.
The discriminability was calculated as follows:
The lick suppression index was calculated as follows:
Open field test
We used an open field test to assess the spontaneous movements of mice. The arena was 40 × 40 cm with white walls (20 cm height) and white acrylic floor, and was inside a sound-attenuating chamber. Each session lasted 10 min. Mice were videotaped with a CCD camera interfaced with Ethovision software (Noldus Information Technologies), which was also used to extract behavioral parameters (position, time, distance, and velocity). The apparatus was cleaned with 75% ethanol after each session.
Mapping monosynaptic inputs with pseudotyped rabies virus
Retrograde tracing of monosynaptic inputs onto Tshz1+ or Pdyn+ dMSNs was accomplished using a previously described method (Reardon et al., 2016). To prepare Tshz1+ dMSNs for infection with a pseudotyped rabies virus, we injected the DS of Tshz1-2A-FlpO mice with AAV-fDIO-TVA-mCherry (0.3–0.4 μl) and AAV-fDIO-oG (0.3–0.4 μl) that express the following components in a Flp-dependent manner: a fluorescent reporter mCherry, TVA (which is a receptor for the avian virus envelope protein EnvA), and the rabies envelope glycoprotein (oG). Three weeks later, mice were injected in the same location with Rbv-CVS-N2c-dG-GFP (0.5 μl), a rabies virus that is pseudotyped with EnvA, lacks the envelope glycoprotein, and expresses GFP. This rabies strain has been shown to have enhanced retrograde trans-synaptic transfer and reduced neurotoxicity (Reardon et al., 2016). Brain tissue was prepared one week after the rabies virus injection for histological examination. This method ensures that the rabies virus exclusively infects cells expressing TVA. Furthermore, complementation of the modified rabies virus with the envelope glycoprotein in the TVA-expressing cells allows the generation of infectious particles, which then can trans-synaptically infect presynaptic neurons.
To prepare Pdyn+ dMSNs for infection with the Rbv-CVS-N2c-dG-GFP, we injected the DS of Pdyn-Cre mice with AAV-Flex-mKate-T2A-TVA (0.3–0.4 μl) and AAV-Flex-mKate-T2A-N2c-G (0.3–0.4 μl) that expresses the following components in a Cre-dependent manner: a fluorescent reporter mKate, TVA, and the rabies envelope glycoprotein (G). Three weeks later, mice were injected in the same location with Rbv-CVS-N2c-dG-GFP (0.5 μl). Brain tissue was prepared one week after the rabies virus injection for histological examination.
In vivo fiber photometry and data analysis
To record the activities of Tshz1+ or Pdyn+ dMSNs in vivo in behaving animals, we used a commercial fiber photometry system (Neurophotometrics Ltd., San Diego, CA, USA) to measure GCaMP6 signals in these neurons through an optical fiber (Fiber core diameter, 200 μm; Fiber length, 3.0 mm; NA, 0.37; Inper, Hangzhou, China) implanted in the DS. A patch cord (fiber core diameter, 200 μm; Doric Lenses) was used to connect the photometry system with the implanted optical fiber. The intensity of the blue light (λ = 470 nm) for excitation was adjusted to a low level (20~50 μW) at the tip of the patch cord. Emitted GCaMP6f fluorescence was band-pass filtered and focused on the sensor of a CCD camera. Photometry signals and behavioral events were aligned based on an analog TTL signal generated by the Bpod. Mean values of signals from a region of interest were calculated and saved by using Bonsai software (Bonsai), and were exported to MATLAB for further analysis.
To correct for photobleaching of fluorescence signals (baseline drift), a bi-exponential curve was fit to the raw fluorescence trace and subtracted as follows:
After baseline drift correction, the fluorescence signals were z-scored relative to the mean and standard deviation of the signals in a time window −2 to 0 s relative to CS onset.
Calcium imaging and imaging data analysis
All imaging experiments were conducted on awake behaving mice under head-restraint in a dim, sound attenuated box. A one-photon imaging system modified from an Olympus BX51 microscope (Olympus Corporation, Shinjuku, Tokyo, Japan) with a 10 X objective (NA 0.3; Olympus, Cat. Number MPLFLN10x) was used to monitor GCaMP6 signals from Tshz1+ dMSNs in behaving mice through the implanted GRIN lenses. The light source for imaging was a single-wavelength LED system (λ = 470 nm; https://www.coolled.com/) connected to the epifluorescence port of the Olympus BX51 microscope. The output power of the LED was set to 0.1–0.3 mW and was kept constant for the same subject across all imaging sessions. During imaging, the focus of the objective was adjusted such that the best dynamic fluorescence signals were at the focal plane. Visible landmarks, such as GCaMP6-expressing neurons and blood vessels, were used to help identify the same field of view (FOV) across different imaging sessions.
GCaMP6 fluorescence signals were captured with a monochrome CCD camera (pco.pixelfly, digital 14 bit CCD camera, image sensor ICX285AL) mounted onto the Olympus BX51. A custom Imaging Acquisition software written in LabVIEW (National Instruments) was used to interface the camera with a dedicated desktop computer and record the GCaMP6 signals at a frame rate of 10 frames/s. To synchronize imaging acquisition with behavioral events, Imaging Acquisition was triggered with a TTL (transistor-transistor logic) signal from the Bpod State Machine (Sanworks) used for behavioral control. During imaging, the timestamps of different events, including the trigger signals sent to Imaging Acquisition, CS onset, US onset and licking events, were all recorded with Bpod.
To reliably detect stimulus-driven responses while minimizing photobleaching, we typically imaged neuronal responses to the same stimulus in 20 trials, with the imaging duration for each trial being 14 s to cover baseline, CS and/or US responses. Before training in the conditioning task, we imaged the responses to either CSs or USs, which were presented randomly interleaved.
For imaging data processing and analysis, we first used Inscopix Data Processing software (v.1.2.0., Inscopix) to spatially down-sample all the raw images by a factor of 4 to reduce file size, and to correct the image stack for motion artifacts. The motion-corrected images were cropped to remove post-registration borders and margin areas. The pre-processed image stack was exported as a .tif file. Next, we used the extended constrained non-negative matrix factorization optimized for one-photon imaging (CNMF-E) (Pnevmatikakis et al., 2016; Zhang and Li, 2018; Zhou et al., 2018) to demix neural signals and get their denoised and deconvolved temporal activity, termed ΔF (Pnevmatikakis et al., 2016; Zhou et al., 2018). We used the output C_raw, which corresponds to a scaled version of ΔF, for further analysis.
To determine whether a neuron was significantly (p < 0.05) excited or suppressed by a stimulus, and thus can be classified as being “responsive” to the stimulus, we used the Wilcoxon signed-rank test to compare the mean ΔF values in the 2 s immediately after stimulus onset with those in the 2 s immediately before stimulus onset. For further analyses, such as the population analyses, we used z-scores to represent the dynamic activities in each neuron. To obtain the temporal z-scores for a neuron, we first obtained the mean activity trace for the neuron by averaging the fluorescence signals (ΔF) at each time point across all trials, and then computed the z-scores as (F(t) − Fmean)/FSD, where F(t) is the ΔF value at time t, Fmean, and FSD are the mean and standard deviation, respectively, of the ΔF values over a 2 s baseline period.
Decoding analysis
We performed population decoding analysis using the linear support vector machine (SVM) in MATLAB (fitcsvm) (MathWorks) to determine whether the types of trials could be predicted on the basis of the trial-by-trial population activities of Tshz1+ dMSNs acquired in each session. We used the activities of all the simultaneously imaged neurons in each session of each mouse to perform the population decoding analysis. First, we applied principal component analysis (PCA) on the matrix of z-scored trial-by-trial neuronal activities. We used the first two or three PCs to represent the population activity in each trial. We subsequently used a subset of the low dimensional trial-by-trial neuronal activity data as the training dataset to train a classifier with linear kernel function (‘linear’) for two-class decoding (i.e., classifying reward and punishment trials in the Pavlovian task), or Gaussian kernel function (‘rbf’) for three-class decoding (i.e., classifying success, failure and neutral trials in the active avoidance task). Finally, we validated the classifier by using the ‘predict’ function to classify the trial-by-trial neuronal activities in the test dataset. Activities from randomly selected 75% of trials of each type (e.g., reward and punishment, or success, failure and neutral) were used to train the classifier, and activities from the remaining 25% of trials of each type were used to test decoding accuracy. To generate the shuffled data, we randomly reassigned a trial type to each of the trial-by-trial neuronal activities. We then followed the same procedure as that used for classifying the actual data to decode the shuffled data. We repeated this classification process 1,000 times for both the actual test dataset and the shuffled data, and calculated the average accuracy as the decoding accuracy.
Clustering analysis
For the clustering analysis, we first concatenated the trial-averaged responses (z-scores) of individual neurons to air-puffs with those to shocks, such that each row corresponds to the responses of one neuron. The responses were aligned to the onset of air-puffs or shocks. We subsequently performed PCA on the z-scores, and used the first three principal components (PCs) for agglomerative hierarchical clustering using a correlation distance metric and complete agglomeration methods. Pairs of neurons that were in close proximity were linked. As they were paired into binary clusters, the newly formed clusters were grouped into larger clusters until a hierarchical tree was formed. We set a threshold at 0.5 × max (linkage) to prune branches off the bottom of the hierarchical tree, and assigned all the neurons below each cutoff to a single cluster.
Analysis of Tshz1+ dMSN population dynamics in the activity space
To assess the relationship between Tshz1+ dMSN population activity and upcoming punishment and reward, we used a previously described ‘coding direction’ analysis (Allen et al., 2019; Gao et al., 2018; Li et al., 2016). For a population of n neurons, we found an n × 1 vector in the n dimensional activity space that maximally separated the response vectors in punishment and reward trials. We term this vector “coding direction (cd).” To obtain the cd, for each neuron we first computed the average z-scored response in the two types (punishment and reward) of trials, rpunishment and rreward, which are n × 1 response vectors that describe the population response at each time point, t. We then computed the difference in the mean response vectors, cdt = rpunishment − rreward. We averaged the values of cdt from CS onset to US onset to obtain a single cd. For a population of n neurons, this yielded an n × 1 vector. The projection of population activity in reward and punishment trials along the cd was obtained as cdTrpunishment and cdTrreward, respectively. The projection along the cd captured 25.5 ± 4.3% of the total variance in Tshz1+ dMSN task-related activity, which was quantified as the root mean square of the activity over the period from CS onset to US onset.
QUANTIFICATION AND STATISTICAL ANALYSIS
All statistics are indicated where used. Statistical analyses were conducted using GraphPad Prism 7 Software (GraphPad Software, Inc., La Jolla, CA) and MATLAB statistical toolbox (MathWorks). To determine whether parametric tests could be used, the D’Agostino-Pearson Test was performed on all data as a test for normality. The statistical test used for each comparison is indicated when used. Parametric tests were used whenever possible to test differences between two or more means. Non-parametric tests were used when data distributions were non-normal. Analysis of variance (ANOVA) was used to check for main effects and interactions in experiments with repeated-measures and more than one factor. When main effects or interactions were significant, we did the planned comparisons according to experimental design (for example, comparing laser on and off conditions). All comparisons were two tailed. Statistic hypothesis testing was conducted at a significance level of 0.05.
Supplementary Material
Figure S1. Characterization of Tshz1+ Neurons and Pdyn+ Neurons, Related to Figure 1
(A) Confocal images of coronal brain sections from a Tshz1-2A-FlpO;Frt-stop-Frt-tdTomato mouse, showing the distribution of Tshz1+ neurons.
(B) Confocal images of a coronal brain section from a Tshz1-2A-FlpO;Frt-stop-Frt-tdTomato mouse, showing the distribution of Tshz1tdTomato neurons (first from left) and cholinergic interneurons (labeled with antibodies recognizing choline acetyltransferase (ChAT)) (second from left) in the DS. An overlay image (third from left) shows both populations. The rightmost panel consists of high magnification images of the boxed area in the left three panels.
(C) Quantification shows Tshz1tdTomato neurons do not express ChAT (n = 3 mice).
(D) Confocal images of a coronal brain section from a Tshz1-2A-FlpO;Frt-stop-Frt-tdTomato mouse, showing the distribution of Tshz1tdTomato neurons (first from left) and parvalbumin (PV) interneurons (labeled with antibodies recognizing PV) (second from left) in the DS. An overlay image (third from left) shows both populations. The rightmost panel consists of high magnification images of the boxed area in the left three panels.
(E) Quantification shows Tshz1tdTomato neurons do not express PV (n = 3 mice).
(F) Confocal images of a coronal brain section from a Tshz1-2A-FlpO;Frt-stop-Frt-tdTomato mouse, showing the distribution of Tshz1tdTomato neurons (first from left) and somatostatin (SOM) interneurons (labeled with antibodies recognizing SOM) (second from left) in the DS. An overlay image (third from left) shows both populations. The rightmost panel consists of high magnification images of the boxed areas in the left three panels.
(G) Quantification shows Tshz1tdTomato neurons do not express SOM (n = 3 mice).
(H–N) Tshz1 and Pdyn label dMSNs in the direct pathway.
(H) A schematic of the approach for anterograde tracing.
(I) Confocal images of Tshz1+ DS neurons labeled with eYFP (Tshz1eYFP). On the right is a high magnification image of the boxed area on the left.
(J) Images of the axons originating from the Tshz1eYFP neurons shown in (I).
(K) A schematic of the approach to compare the neural projections of the Tshz1+ MSNs and the general population of dMSNs.
(L) Images of brain sections from a Tshz1-2A-FlpO;D1-Cre mouse prepared as in (K). Top: D1 neurons in the DS were labeled with mCherry (D1mCherry), which revealed that these neurons sent projections to the GPe, GPi and SNr. Middle: Tshz1+ neurons in the DS were labeled with eYFP (Tshz1eYFP), which revealed that these neurons also sent projections to the GPe, GPi and SNr. Bottom: overlay images showing D1mCherry and Tshz1eYFP had the same projection pattern.
(M) A schematic showing the approach.
(N) Images taken from a mouse prepared as in (M), showing Pdyn+ neurons in the DS labeled with ChR2-eYFP. These neurons sent projections to the GPe, GPi and SNr.
(O) Confocal images of in situ hybridization for Tshz1tdTomato, Pdyn, and Drd1 in the nucleus accumbens (NAc).
(P) High magnification images of the boxed area in (O), showing that Tshz1 and Pdyn only partially overlap, but both overlap with Drd1.
(Q) Quantification of the fractions of Tshz1+ nuclei that were positive for Pdyn and Drd1, and the fractions of Pdyn+ nuclei that were positive for Tshz1 and Drd1 in the NAc (n = 2 mice).
DS, dorsal striatum; GPe, globus pallidus externus; GPi, globus pallidus internus; MGB, medial geniculate body; NAc, nucleus accumbens; OB, olfactory bulb; Pir, piriform cortex; SNr, substantia nigra pars reticulata; SNc, substantia nigra pars compacta.
Figure S2. Optogenetic Activation of Tshz1+ dMSNs, iMSNs, or Pdyn+ dMSNs, Related to Figure 2
(A) A schematic of the experimental approach to verify the specificity of the AAV-CreOFF/FlpON-ChR2.
(B) Representative confocal images of a coronal brain section from a mouse prepared as in A. At the bottom are high magnification images of the boxed region in the images on the top, showing ChR2 expression (green) in Tshz1tdTomato dMSNs (red).
(C) Quantification of the ChR2-expressing neurons that are Tshz1tdTomato+ (89.1 ± 1.5%; n = 6 slices / 2 mice).
(D) A schematic of the approach to activate Tshz1+ dMSNs.
(E) Quantification of movement distance (left) and velocity (right) of mice prepared as in D, during baseline and photo-stimulation sessions (n = 6 mice; distance, F(2,15) = 5.36, p = 0.018, *p < 0.05; velocity, F(2,15) = 5.43, p = 0.017, *p < 0.05; one-way ANOVA followed by Tukey’s test).
(F) Same as in E (right), except that velocity was quantified separately for movement in the left side and right side of the chamber (F(2,30) = 5.79, p = 0.0075, *p = 0.027, n.s., p > 0.05, two-way ANOVA followed by Tukey’s test).
(G) A schematic of the approach for the control experiment.
(H) Quantification of movement distance (left) and velocity (right) of mice prepared as in G, during baseline and photo-stimulation sessions (n = 6 mice; distance, F(2,15) = 1.47, p = 0.26, n.s., p > 0.05; velocity, F(2,15) = 1.44, p = 0.27, n.s., p > 0.05; one-way ANOVA).
(I) Same as in H (right), except that velocity was quantified separately for movement in the left side and right side of the chamber (F(2,30) = 0.0065, p = 0.99, n.s., p > 0.05, two-way ANOVA).
(J–M) Selective activation of D2 neurons in the DS induced aversive responses and reduced movements.
(J) A schematic of the approach (left) and an image of a sagittal brain section (right) from a mouse prepared as shown in the left. Note that D2 neurons project to the GPe but not GPi or SNr.
(K) Heat-maps for the activity of a representative mouse at baseline (top), or in a situation whereby entering the left (middle) or right (bottom) side of the chamber triggered photo-activation of D2 MSNs.
(L and M) Quantification of the mouse activity as shown in K. The mice (n = 4) avoided the side associated with photo-activation of D2 MSNs (L) (F(2,9) = 312.5, p < 0.0001, ***p < 0.001, one-way ANOVA followed by Tukey’s test), and reduced movement velocity following the activation (M) (F(2,9) = 5.06, p = 0.034, *p < 0.05, n.s., p > 0.05, one-way ANOVA followed by Tukey’s test).
(N–P) The choice task.
(N) Schematics of the task structure. In the forced choice trials, water is available only at the side-port indicated by light (light is turned on at only one port in each trial). In the free choice trials, water is available at both of the side-ports (light is turned on at both ports in each trial), but drinking at one of the ports triggers photo-stimulation in the DS.
(O) An example session by a control mouse in which the Tshz1+ dMSNs expressed eYFP, showing that the choice of this mouse was not affected by the photo-stimulation.
(P) Quantification of choice behavior in the forced-choice trials, showing that neither the experimental mice (ChR2) (in which the Tshz1+ dMSNs expressed ChR2) nor the control mice (eYFP) had biases before testing in the free choice trials (F(1,20) = 0.051, p = 0.82, n.s., p > 0.05, two-way ANOVA).
(Q) A schematic of the approach to activate Pdyn+ dMSNs.
(R) Quantification of movement distance (left) and velocity (right) of mice prepared as in Q, during baseline and photo-stimulation sessions. The photo-activation (n = 6 mice) increased movement distance (F(2,15) = 4.60, p = 0.028; *p < 0.05, one-way ANOVA followed by Bonferroni’s test) and velocity (F(2,15) = 6.03, p = 0.012; *p < 0.05, one-way ANOVA followed by Tukey’s test).
(S) Same as that in R (right), except that velocity was quantified separately for movement in the left side and right side of the chamber (F(2,30) = 8.85, p = 0.0010; *p < 0.05, **p < 0.01, two-way ANOVA followed by Tukey’s test).
(T-AA) Histological verification of the placement of optical fibers.
(T, V, X, and Z) Schematics of the experimental approach.
(U, W, Y, and AA) Schematics corresponding to T, V, X and Z, respectively, showing the locations of optic fiber placement in the mice used for the various experiments as indicated.
Data are presented as mean ± s.e.m.
Figure S3. Targeting MSNs in the Direct Pathway with Enhanced Specificity, Related to Figure 2
(A–D) Selective activation of Tshz1+ neurons exclusive of D2 neurons in the DS, using an intersectional strategy, induced aversive responses and reduced movements.
(A) A schematic of the approach (left) and a confocal image of a coronal brain section (right) from a mouse prepared as shown in the left.
(B) Heat-maps for the activity of a representative mouse at baseline (top), or in a situation whereby entering the left (middle) or right (bottom) side of the chamber triggered photo-activation of Tshz1+/D2− neurons in the DS.
(C and D) Quantification of the mouse activity as shown in B. The mice (n = 5) avoided the side associated with the photo-activation (C) (F(2,12) = 32.75, p = 0.0004, *p < 0.05, one-way ANOVA followed by Tukey’s test), and reduced movement velocity following the activation (D) (F(2,12) = 6.01, p = 0.016, *p < 0.05, n.s., p > 0.05, one-way ANOVA followed by Tukey’s test).
(E–H) Activation of GPi inputs originating from Tshz1+ neurons in the DS induced aversive responses and reduced movements.
(E) A schematic of the approach (left) and a confocal image of a coronal brain section (right) from a mouse prepared as shown in the left.
(F) Heat-maps for the activity of a representative mouse at baseline (top), or in a situation whereby entering the left (middle) or right (bottom) side of the chamber triggered photo-activation of GPi inputs originating from Tshz1+ neurons in the DS.
(G and H) Quantification of the mouse activity as shown in F. The mice (n = 4) avoided the side associated with the photo-activation (G) (F(2,9) = 16.15, p = 0.0011, *p < 0.05, one-way ANOVA followed by Tukey’s test), and reduced movement velocity following the activation (H) (F(2,9) = 7.85, p = 0.011, *p < 0.05, **p < 0.01, one-way ANOVA followed by Tukey’s test).
(I–L) Selective activation of D1 neurons exclusive of Tshz1+ neurons in the DS, using an intersectional strategy, induced reward responses.
(I) A schematic of the approach (left) and an image of a sagittal brain section (right) from a mouse prepared as shown in the left. Note that D1 neurons project to the GPi and SNr.
(J) Heat-maps for the activity of a representative mouse at baseline (top), or in a situation whereby entering the left (middle) or right (bottom) side of the chamber triggered photo-activation of D1+/Tshz1− dMSNs.
(K and L) Quantification of the mouse activity as shown in J. The mice (n = 4) preferred the side associated with the photo-activation (K) (F(2,9) = 87.43, p < 0.0001, ***p < 0.001, **p < 0.01, one-way ANOVA followed by Tukey’s test), and did not show changes in movement velocity following the stimulation (L) (F(2,9) = 0.16, p = 0.85, n.s., p > 0.05, one-way ANOVA followed by Tukey’s test).
(M–P) Activation of GPi inputs originating from Pdyn+ neurons in the DS induced reward responses.
(M) A schematic of the approach (left) and a confocal image of a coronal brain section (right) from a mouse prepared as shown in the left.
(N) Heat-maps for the activity of a representative mouse at baseline (top), or in a situation whereby entering the left (middle) or right (bottom) side of the chamber triggered photo-activation of GPi inputs originating from Pdyn+ neurons in the DS.
(O and P) Quantification of the mouse activity as shown in N. The mice (n = 4) preferred the side associated with the photo-activation (O) (F(2,9) = 60.15, p < 0.0001, ***p < 0.001, **p < 0.01, one-way ANOVA followed by Tukey’s test), and had a tendency to show increased movement velocity following the activation (P) (F(2,9) = 1.78, p = 0.22, n.s., p > 0.05, one-way ANOVA followed by Tukey’s test).
Data are presented as mean ± s.e.m.
Figure S4. GPi-projecting Tshz1+ MSNs Are Preferentially Excited by and Represent the Value of Aversive Stimuli, Related to Figure 3
(A–C) Schematics of the approach (A), experimental setup (B) and design (C).
(D) Top: licking events, sorted according to trial types, for a representative Tshz1-2A-FlpO mouse in the early (left) and late (right) stages of training in the Pavlovian task. Middle: average licking rates of this mouse in different types of trials as indicated. Bottom: average GCaMP6 signals from the GPi-projecting Tshz1+ MSNs in this mouse, obtained from different types of trials. Dashed lines indicate the onset of CS and US, as indicated.
(E) Left: quantification of the responses of GPi-projecting Tshz1+ MSNs in all mice to different stimuli at the early stage of training (n = 5 mice; F(1,8) = 17.48, p = 0.0031; CS response, p = 0.56 (n.s.); US response, ***p < 0.0001; two-way ANOVA followed by Bonferroni’s test). Right: quantification of the responses of GPi-projecting Tshz1+ MSNs in all mice to different stimuli at the late stage of training (n = 5 mice; F(1,8) = 10.94, p = 0.011; CS response, p = 0.26 (n.s.); US response, ***p = 0.0009; two-way ANOVA followed by Bonferroni’s test).
(F) Trial-by-trial (top) and average (bottom) responses of GPi-projecting Tshz1+ MSNs in an example mouse to air puffs of different durations.
(G) Quantification of the responses of GPi-projecting Tshz1+ MSNs in all mice to air puffs of different durations (n = 5 mice; F(2,12) = 9.12, **p = 0.0039, one-way ANOVA followed by Tukey’s test).
Data are presented as mean ± s.e.m. Shaded areas represent s.e.m.
Figure S5. Mapping the Monosynaptic Inputs onto Tshz1+ dMSNs and Pdyn+ dMSNs, Related to Figure 3 and STAR Methods
(A–J) Mapping the inputs onto Tshz1+ dMSNs.
(A) A schematic of the approach (see STAR Methods).
(B) Images of a coronal brain section from a mouse prepared as in A, showing the Tshz1+ dMSNs infected by the helper viruses (red) and the cells infected by the rabies virus (green). The starter cells are yellow, as indicated in the high magnification images on the right.
(C) Representative images of the SNc area, showing input neurons labeled by the rabies virus. Many of these neurons are dopaminergic, as indicated by their expression of tyrosine hydroxylase (TH).
(D–I), Representative images showing input neurons in the medial prefrontal cortex (D), insular cortex (E), anterior thalamus (F), basal lateral amygdala (BLA) (G), motor cortex and somatosensory cortex (H) and subiculum (I).
(J) A series of coronal sections, ipsilateral to site of injection, from a representative mouse showing the major monosynaptic inputs to Tshz1+ dMSNs. (K-O) Mapping the inputs onto Pdyn+ dMSNs.
(K) A schematic of the approach (see STAR Methods).
(L) Images of a coronal brain section from a mouse prepared as in K, showing the Pdyn+ dMSNs infected by the helper viruses (red) and the cells infected by the rabies virus (green). The starter cells are yellow, as indicated in the high magnification images on the right.
(M) Representative images of the SNc area, showing input neurons labeled by the rabies virus. Many of these neurons are dopaminergic, as indicated by their expression of TH.
(N) A representative image showing input neurons in the BLA and central amygdala (CeA).
(O) A series of coronal sections, ipsilateral to site of injection, from a representative mouse showing the major monosynaptic inputs to Pdyn+ dMSNs.
(P) Normalized distributions of rabies-labeled input neurons across different brain areas in each hemisphere (ipsilateral or contralateral to the injection site). The inputs onto Tshz1+ or Pdyn+ dMSNs are color coded as indicated (*p < 0.05, **p < 0.01, ***p < 0.001, t test).
Data are presented as mean ± s.e.m.
Figure S6. Imaging the Activities of Tshz1+ dMSNs in Behaving Mice, Related to Figures 4, 5, and 6
(A) A representative confocal image of GCaMP6m expression in Tshz1+ dMSNs.
(B) Left, the field of view (FOV), which was captured using a wide-field microscope equipped with a 10x objective, through a GRIN lens implanted in the DS. In the FOV are raw GCaMP6m fluorescence signals from Tshz1+ dMSNs. Right, the spatial locations of individual extracted neurons (see STAR Methods) in the FOV shown on the left. The contours of 7 representative neurons were colored in yellow and numbered.
(C) The temporal calcium activities of the 7 neurons outlined in B during the Pavlovian conditioning. Neurons #1–4 responded to air puff, neurons #5, 6 responded to water, and neuron #7 was not responsive to either US. Red bars indicate the period from CS1 onset to air-puff delivery. Green bars indicate the period from CS2 onset to water delivery.
(D) Left: a confocal histological image showing the location of GRIN lens implantation in a mouse used for the imaging experiments. Right: a high magnification image of the boxed area on the left, showing the expression of GCaMP6m in Tshz1+ dMSNs.
(E) A schematic showing the placement of GRIN lens implants in the mice (n = 6) used for imaging. (F–I) Characterization of Tshz1+ dMSN activities during Pavlovian conditioning.
(F) Heat-maps of neuronal responses to different stimuli before (left) and after (right) training in the Pavlovian conditioning. In either the left or the right panel, each row represents the responses of one neuron; neurons are sorted according to their responses to the air puff.
(G) Trial-by-trial responses of three example neurons, each of which was chosen from the corresponding panel in F.
(H) Five example Tshz1+ dMSNs exhibiting different responses to the aversive or appetitive stimuli.
(I) Pie charts showing the percentage distribution of Tshz1+ dMSNs according to their response profiles to US1 (air puff) and US2 (water), before (left) and after (right) training in the Pavlovian conditioning task. NVNs, negative valence neurons; PVNs, positive valence neurons.
(J and K) Tshz1+ dMSNs are activated by different aversive stimuli.
(J) Z-score activity plots of the responses of all neurons to air puffs and tail shocks, the onset of which is indicated by the dashed lines. Each row represents the activities of one neuron. On the right are the first three principle components (PC) and hierarchical clustering (see STAR Methods) dendrogram showing the relationship of each neuron within the four clusters.
(K) Average z-scored responses of the four types of neurons to the air puff and shock (n = 380 neurons from 3 mice). Note that a major population (72%) shows excitatory response to the shock (cluster III & IV), including a subpopulation (40%) excited by both shock and air puff (cluster III).
(L and M) Characterization of Tshz1+ dMSN activities during active avoidance.
(L) Heat-maps of neuronal responses in the three different types of trials in the active avoidance task. Each row represents the responses of one neuron; neurons are sorted according to their responses after air-puff delivery in the failure trials.
(M) Average running velocity (top) and average activity of all the Tshz1+ dMSNs imaged (bottom) in these mice in different types of trials as indicated.
Data are presented as mean ± s.e.m. Shaded areas represent s.e.m.
Figure S7. Chemogenetic Inhibition of Tshz1+ dMSNs Impairs Learning but Does Not Affect Sensorimotor Functions, Related to Figure 7
(A) Quantification of the effect of inhibiting Tshz1+ dMSNs on discriminability (see STAR Methods) at different learning stages. Left: discriminability in each session (during learning, F(9,90) = 1.58, p = 0.13; after learning, F(3,30) = 0.40, p = 0.75; two-way ANOVA). Right: average discriminability across sessions (F(1,20) = 5.42, p = 0.03; during learning, *p = 0.04; after learning, p = 0.68; two-way ANOVA followed by Tukey’s test). n.s., non-significant.
(B–E) Quantification of the effect of inhibiting Tshz1+ dMSNs on licking response during baseline period (B), following the go cue (C), following the no-go cue (D), and during water consumption (E).
(B) Left: licking rate during baseline period in each session (during learning, F(9,90) = 0.42, p = 0.92; after learning, F(3,30) = 1.10, p = 0.37; two-way ANOVA). Right: average licking rate during baseline across sessions (F(1,20) = 0.45, p = 0.51; two-way ANOVA).
(C) Left: licking rate following the go cue in each session (during learning, F(9,90) = 0.57, p = 0.82; after learning, F(3,30) = 0.33, p = 0.80; two-way ANOVA). Right: average licking rate following the go cue across sessions (F(1,20) = 0.057, p = 0.81; two-way ANOVA).
(D) Left: licking rate following the no-go cue in each session (during learning, F(9,90) = 0.42, p = 0.92; after learning, F(3,30) = 0.85, p = 0.48; two-way ANOVA). Right: average licking rate following the no-go cue across sessions (F(1,20) = 1.30, p = 0.27; two-way ANOVA).
(E) Left: licking rate following water delivery in each session (during learning, F(9,90) = 0.22, p = 0.99; after learning, F(3,30) = 0.60, p = 0.62; two-way ANOVA). Right: average licking rate following water delivery across sessions (F(1,20) = 0.21, p = 0.66; two-way ANOVA).
(F) Left: lick-suppression index, which measures the supressing effects of air puff on licking (STAR Methods), during false alarm in the no-go trials in each session during learning (F(9,90) = 1.06, p = 0.40 (n.s.), two-way ANOVA). Right: average lick-suppression across sessions (t(10) = 0.498, p = 0.63, t test).
(G) Top: a schematic of the experimental procedure. Bottom: tracks of representative mice in which the Tshz1+ dMSNs expressed eYFP (left) or KORD (right) in the open field test. The red boxes mark the center area of the arena.
(H–K) Quantification of movement parameters in the open field.
(H) Movement distance (t(10) = 0.17, p = 0.87, t test).
(I) Movement velocity (t(10) = 0.17, p = 0.87, t test).
(J) Time spent in the center (t(10) = 0.49, p = 0.63, t test).
(K) Quantification of movement distance across time (F(9,100) = 0.30, p = 0.97, two-way ANOVA).
(L) A circuit model. A model diagram showing the circuits engaged by Tshz1+ and Pdyn+ striosomal dMSNs. LHb, lateral habenula; RMTg, rostromedial tegmental nucleus; VTA, ventral tegmental area.
Data are presented as mean ± s.e.m.
KEY RESOURCES TABLE
| REAGENT or RESOURCE | SOURCE | IDENTIFIER |
|---|---|---|
| Antibodies | ||
| Rabbit polyclonal anti-MOR | Immunostar | 24216 |
| Rabbit polyclonal anti-tyrosine hydroxylase | Millipore | AB152 |
| Chicken polyclonal anti-GFP | Aves Labs | GFP1020 |
| Rabbit polyclonal anti-RFP | Rockland | 600-401-379 |
| Rabbit monoclonal anti-HA-Tag | Cell Signaling | 3724S |
| Mouse monoclonal anti-Parvalbumin | Millipore | MAB1572 |
| Rabbit polyclonal anti-Somatostatin-14 | Peninsula Laboratories | T-4103 |
| Goat polyclonal anti-ChAT | Millipore | AB144P |
| Bacterial and Virus Strains | ||
| AAV8-Ef1a-fDIO-GCaMP6m | Laboratory of Karl Deisseroth | N/A |
| AAVdj-hSyn-CreOFF/FlpON-hChR2(H134R)-eYFP | Fenno et al., 2014 | Addgene 55648 |
| AAVdj-hSyn-CreON/FlpOFF-hChR2(H134R)-eYFP | Fenno et al., 2014 | Addgene 55646 |
| AAV8-EF1a-fDIO-Cre-p2A-mCherry | Laboratory of Karl Deisseroth | N/A |
| AAV5-Ef1a-DIO-hChR2(H134R)-eYFP | UNC | N/A |
| AAVdj-EF1a-fDIO-eYFP | UNC | N/A |
| AAV8-hSyn-DIO-KORD-IRES-Mcitrine | UNC | N/A |
| AAV2/8-Ef1a-fDIO-TVA-mCherry | Laboratory of Z. Josh Huang | N/A |
| retroAAV2-CBA-fDIO-Cre | Vigene Biosciences | N/A |
| AAV9-CAGGS-Flex-mKate-T2A-TVA | HHMI Janelia Research Campus | N/A |
| AAV9-CAGGS-Flex-mKate-T2A-N2c-G | HHMI Janelia Research Campus | N/A |
| Rbv-CVS-N2c-dG-GFP | HHMI Janelia Research Campus | Addgene 73461 |
| AAV8-hSyn-DIO-mCherry | Addgene | Addgene 50459 |
| Experimental Models: Organisms/Strains | ||
| Mouse: Tg(Drd1a-cre)FK150Gsat/Mmucd (the “D1-Cre” line) | MMRRC | RRID: MMRRC_029178-UCD |
| Mouse: B6.FVB(Cg)-Tg(Adora2a-cre) KG139Gsat/Mmucd (the “A2A-Cre” line) | MMRRC | RRID: MMRRC_036158-UCD |
| Mouse: Tshz1-2A-FlpO | This study | N/A |
| Mouse: Frt-Stop-Frt-TdTomato | He et al., 2016 | N/A |
| Mouse: Pdyn-IRES-Cre (B6.Cg-129S-Pdyn tm1.1(cre)Mjkr/LowlJ) | The Jackson Laboratory | JAX: 027958 |
| Mouse: Ai14 (B6.Cg-Gt(ROSA) 26Sortm14(CAG-tdTomato)Hze/J) | The Jackson Laboratory | JAX: 007908 |
| Software and Algorithms | ||
| ImageJ (Fiji) software | NIH | https://fiji.sc/ |
| MATLAB | Mathworks | https://www.mathworks.com/ |
| GraphPad Prism 7 | GraphPad Software | https://www.graphpad.com/ |
Highlights.
Tshz1 labels a population of striatal direct pathway medium spiny neurons (dMSNs)
Tshz1-expressing (Tshz1+) dMSNs are localized in the striosome
Tshz1+ striosomal dMSNs represent punishment and drive negative reinforcement
Pdyn labels another population of striosomal dMSNs mediating positive reinforcement
ACKNOWLEDGMENTS
We thank Dr. Joshua Dudman (Janelia Research Campus, Howard Hughes Medical Institute) and Dr. Dinu F. Albeanu (Cold Spring Harbor Laboratory) for comments on an earlier version of the manuscript, Dr. P. Zhou for advice and the MATLAB codes for CNMF-E analysis, Dr. A. Zador for providing the D1-Cre and A2A-Cre mouse strains, Taylor Russo and Radhashree Sharma for technical assistance, and members of the Li laboratory for helpful discussions. This work was supported by grants from the EMBO Fellowship (ALTF 458-2017, A.F.), National Institutes of Health (NIH) (R01MH101214, R01MH108924, and R01NS104944, B.L.), Human Frontier Science Program (RGP0015/2016, B.L.), Wodecroft Foundation (B.L.), the Cold Spring Harbor Laboratory and Northwell Health Affiliation (B.L.), and Feil Family Neuroscience Endowment (B.L.).
Footnotes
DECLARATION OF INTERESTS
The authors declare no competing interests.
REFERENCES
- Allen WE, Chen MZ, Pichamoorthy N, Tien RH, Pachitariu M, Luo L, and Deisseroth K (2019). Thirst regulates motivated behavior through modulation of brainwide neural population dynamics. Science 364, 253. [DOI] [PMC free article] [PubMed] [Google Scholar]
- Amemori K, Gibb LG, and Graybiel AM (2011). Shifting responsibly: the importance of striatal modularity to reinforcement learning in uncertain environments. Front. Hum. Neurosci 5, 47. [DOI] [PMC free article] [PubMed] [Google Scholar]
- Banghart MR, Neufeld SQ, Wong NC, and Sabatini BL (2015). Enkephalin Disinhibits Mu Opioid Receptor-Rich Striatal Patches via Delta Opioid Receptors. Neuron 88, 1227–1239. [DOI] [PMC free article] [PubMed] [Google Scholar]
- Barbera G, Liang B, Zhang L, Gerfen CR, Culurciello E, Chen R, Li Y, and Lin DT (2016). Spatially Compact Neural Clusters in the Dorsal Striatum Encode Locomotion Relevant Information. Neuron 92, 202–213. [DOI] [PMC free article] [PubMed] [Google Scholar]
- Berridge KC (2012). From prediction error to incentive salience: mesolimbic computation of reward motivation. Eur. J. Neurosci 35, 1124–1143. [DOI] [PMC free article] [PubMed] [Google Scholar]
- Berridge KC (2018). Evolving Concepts of Emotion and Motivation. Front. Psychol 9, 1647. [DOI] [PMC free article] [PubMed] [Google Scholar]
- Bloem B, Huda R, Sur M, and Graybiel AM (2017). Two-photon imaging in mice shows striosomes and matrix have overlapping but differential reinforcement-related responses. eLife 6, e32353. [DOI] [PMC free article] [PubMed] [Google Scholar]
- Caubit X, Tiveron MC, Cremer H, and Fasano L (2005). Expression patterns of the three Teashirt-related genes define specific boundaries in the developing and postnatal mouse forebrain. J. Comp. Neurol 486, 76–88. [DOI] [PubMed] [Google Scholar]
- Chen TW, Wardill TJ, Sun Y, Pulver SR, Renninger SL, Baohan A, Schreiter ER, Kerr RA, Orger MB, Jayaraman V, et al. (2013). Ultrasensitive fluorescent proteins for imaging neuronal activity. Nature 499, 295–300. [DOI] [PMC free article] [PubMed] [Google Scholar]
- Crittenden JR, and Graybiel AM (2011). Basal Ganglia disorders associated with imbalances in the striatal striosome and matrix compartments. Front. Neuroanat 5, 59. [DOI] [PMC free article] [PubMed] [Google Scholar]
- Crittenden JR, and Graybiel AM (2016). Disease-associated changes in the striosome and matrix compartments of the dorsal striatum. In Handbook of Basal Ganglia Structure and Function, Steiner H and Tseng KY, eds. (Elsevier; ), pp. 801–821. [Google Scholar]
- Crittenden JR, Tillberg PW, Riad MH, Shima Y, Gerfen CR, Curry J, Housman DE, Nelson SB, Boyden ES, and Graybiel AM (2016). Striosome-dendron bouquets highlight a unique striatonigral circuit targeting dopamine-containing neurons. Proc. Natl. Acad. Sci. USA 113, 11318–11323. [DOI] [PMC free article] [PubMed] [Google Scholar]
- Cui G, Jun SB, Jin X, Pham MD, Vogel SS, Lovinger DM, and Costa RM (2013). Concurrent activation of striatal direct and indirect pathways during action initiation. Nature 494, 238–242. [DOI] [PMC free article] [PubMed] [Google Scholar]
- Cunningham JP, and Yu BM (2014). Dimensionality reduction for large-scale neural recordings. Nat. Neurosci 17, 1500–1509. [DOI] [PMC free article] [PubMed] [Google Scholar]
- Daviss WB, O’Donnell L, Soileau BT, Heard P, Carter E, Pliszka SR, Gelfond JA, Hale DE, and Cody JD (2013). Mood disorders in individuals with distal 18q deletions. Am. J. Med. Genet. B. Neuropsychiatr. Genet 162B, 879–888. [DOI] [PubMed] [Google Scholar]
- Doya K (2002). Metalearning and neuromodulation. Neural Netw 15, 495–506. [DOI] [PubMed] [Google Scholar]
- Dudman JT, and Krakauer JW (2016). The basal ganglia: from motor commands to the control of vigor. Curr. Opin. Neurobiol 37, 158–166. [DOI] [PubMed] [Google Scholar]
- Fenno LE, Mattis J, Ramakrishnan C, Hyun M, Lee SY, He M, Tucciarone J, Selimbeyoglu A, Berndt A, Grosenick L, et al. (2014). Targeting cells with single vectors using multiple-feature Boolean logic. Nat. Methods 11, 763–772. [DOI] [PMC free article] [PubMed] [Google Scholar]
- Frank MJ, Seeberger LC, and O’reilly RC (2004). By carrot or by stick: cognitive reinforcement learning in parkinsonism. Science 306, 1940–1943. [DOI] [PubMed] [Google Scholar]
- Friedman A, Homma D, Gibb LG, Amemori K, Rubin SJ, Hood AS, Riad MH, and Graybiel AM (2015). A Corticostriatal Path Targeting Striosomes Controls Decision-Making under Conflict. Cell 161, 1320–1333. [DOI] [PMC free article] [PubMed] [Google Scholar]
- Friedman A, Homma D, Bloem B, Gibb LG, Amemori KI, Hu D, Delcasso S, Truong TF, Yang J, Hood AS, et al. (2017). Chronic Stress Alters Striosome-Circuit Dynamics, Leading to Aberrant Decision-Making. Cell 171, 1191–1205. [DOI] [PMC free article] [PubMed] [Google Scholar]
- Fujiyama F, Sohn J, Nakano T, Furuta T, Nakamura KC, Matsuda W, and Kaneko T (2011). Exclusive and common targets of neostriatofugal projections of rat striosome neurons: a single neuron-tracing study using a viral vector. Eur. J. Neurosci 33, 668–677. [DOI] [PubMed] [Google Scholar]
- Gao Z, Davis C, Thomas AM, Economo MN, Abrego AM, Svoboda K, De Zeeuw CI, and Li N (2018). A cortico-cerebellar loop for motor planning. Nature 563, 113–116. [DOI] [PMC free article] [PubMed] [Google Scholar]
- Gerfen CR (1992). The neostriatal mosaic: multiple levels of compartmental organization in the basal ganglia. Annu. Rev. Neurosci 15, 285–320. [DOI] [PubMed] [Google Scholar]
- Gerfen CR, Engber TM, Mahan LC, Susel Z, Chase TN, Monsma FJ Jr., and Sibley DR (1990). D1 and D2 dopamine receptor-regulated gene expression of striatonigral and striatopallidal neurons. Science 250, 1429–1432. [DOI] [PubMed] [Google Scholar]
- Graybiel AM (2008). Habits, rituals, and the evaluative brain. Annu. Rev. Neurosci 31, 359–387. [DOI] [PubMed] [Google Scholar]
- Graybiel AM, and Ragsdale CW Jr. (1978). Histochemically distinct compartments in the striatum of human, monkeys, and cat demonstrated by acetylthiocholinesterase staining. Proc. Natl. Acad. Sci. USA 75, 5723–5726. [DOI] [PMC free article] [PubMed] [Google Scholar]
- Gunaydin LA, and Kreitzer AC (2016). Cortico-Basal Ganglia Circuit Function in Psychiatric Disease. Annu. Rev. Physiol 78, 327–350. [DOI] [PubMed] [Google Scholar]
- He M, Tucciarone J, Lee S, Nigro MJ, Kim Y, Levine JM, Kelly SM, Krugikov I, Wu P, Chen Y, et al. (2016). Strategies and Tools for Combinatorial Targeting of GABAergic Neurons in Mouse Cerebral Cortex. Neuron 91, 1228–1243. [DOI] [PMC free article] [PubMed] [Google Scholar]
- Hikosaka O, Kim HF, Yasuda M, and Yamamoto S (2014). Basal ganglia circuits for reward value-guided behavior. Annu. Rev. Neurosci 37, 289–306. [DOI] [PMC free article] [PubMed] [Google Scholar]
- Hikosaka O, Kim HF, Amita H, Yasuda M, Isoda M, Tachibana Y, and Yoshida A (2019). Direct and indirect pathways for choosing objects and actions. Eur. J. Neurosci 49, 637–645. [DOI] [PMC free article] [PubMed] [Google Scholar]
- Hong S, and Hikosaka O (2008). The globus pallidus sends reward-related signals to the lateral habenula. Neuron 60, 720–729. [DOI] [PMC free article] [PubMed] [Google Scholar]
- Hong S, Amemori S, Chung E, Gibson DJ, Amemori KI, and Graybiel AM (2019). Predominant Striatal Input to the Lateral Habenula in Macaques Comes from Striosomes. Curr. Biol 29, 51–61. [DOI] [PMC free article] [PubMed] [Google Scholar]
- Houk JC, Adams JL, and Barto AG (1995). A Model of how the Basal Ganglia generate and Use Neural Signals That Predict Reinforcement. In Models of Information Processing in the Basal Ganglia, Houk JC, Davis J, and Beiser D, eds., eds. (MIT Press; ), pp. 215–232. [Google Scholar]
- Howe MW, and Dombeck DA (2016). Rapid signalling in distinct dopaminergic axons during locomotion and reward. Nature 535, 505–510. [DOI] [PMC free article] [PubMed] [Google Scholar]
- Howe M, Ridouh I, Allegra Mascaro AL, Larios A, Azcorra M, and Dombeck DA (2019). Coordination of rapid cholinergic and dopaminergic signaling in striatum during spontaneous movement. eLife 8, e44903. [DOI] [PMC free article] [PubMed] [Google Scholar]
- Hurd YL, and Herkenham M (1993). Molecular alterations in the neostriatum of human cocaine addicts. Synapse 13, 357–369. [DOI] [PubMed] [Google Scholar]
- Isomura Y, Takekawa T, Harukuni R, Handa T, Aizawa H, Takada M, and Fukai T (2013). Reward-modulated motor information in identified striatum neurons. J. Neurosci 33, 10209–10220. [DOI] [PMC free article] [PubMed] [Google Scholar]
- Ito M, and Doya K (2009). Validation of decision-making models and analysis of decision variables in the rat basal ganglia. J. Neurosci 29, 9861–9874. [DOI] [PMC free article] [PubMed] [Google Scholar]
- Ito M, and Doya K (2011). Multiple representations and algorithms for reinforcement learning in the cortico-basal ganglia circuit. Curr. Opin. Neurobiol 21, 368–373. [DOI] [PubMed] [Google Scholar]
- Ito M, and Doya K (2015). Parallel Representation of Value-Based and Finite State-Based Strategies in the Ventral and Dorsal Striatum. PLoS Comput. Biol 11, e1004540. [DOI] [PMC free article] [PubMed] [Google Scholar]
- Jin X, Tecuapetla F, and Costa RM (2014). Basal ganglia subcircuits distinctively encode the parsing and concatenation of action sequences. Nat. Neurosci 17, 423–430. [DOI] [PMC free article] [PubMed] [Google Scholar]
- Jonkman S, Pelloux Y, and Everitt BJ (2012). Differential roles of the dorsolateral and midlateral striatum in punished cocaine seeking. J. Neurosci 32, 4645–4650. [DOI] [PMC free article] [PubMed] [Google Scholar]
- Kelly SM, Raudales R, He M, Lee JH, Kim Y, Gibb LG, Wu P, Matho K, Osten P, Graybiel AM, et al. (2018). Radial Glial Lineage Progression and Differential Intermediate Progenitor Amplification Underlie Striatal Compartments and Circuit Organization. Neuron 99, 345–361. [DOI] [PMC free article] [PubMed] [Google Scholar]
- Klaus A, Martins GJ, Paixao VB, Zhou P, Paninski L, and Costa RM (2017). The Spatiotemporal Organization of the Striatum Encodes Action Space. Neuron 95, 1171–1180.e7. [DOI] [PMC free article] [PubMed] [Google Scholar]
- Klaus A, Alves da Silva J, and Costa RM (2019). What, If, and When to Move: Basal Ganglia Circuits and Self-Paced Action Initiation. Annu. Rev. Neurosci 42, 459–483. [DOI] [PubMed] [Google Scholar]
- Kravitz AV, and Kreitzer AC (2012). Striatal mechanisms underlying movement, reinforcement, and punishment. Physiology (Bethesda) 27, 167–177. [DOI] [PMC free article] [PubMed] [Google Scholar]
- Kravitz AV, Freeze BS, Parker PR, Kay K, Thwin MT, Deisseroth K, and Kreitzer AC (2010). Regulation of parkinsonian motor behaviours by optogenetic control of basal ganglia circuitry. Nature 466, 622–626. [DOI] [PMC free article] [PubMed] [Google Scholar]
- Kravitz AV, Tye LD, and Kreitzer AC (2012). Distinct roles for direct and indirect pathway striatal neurons in reinforcement. Nat. Neurosci 15, 816–818. [DOI] [PMC free article] [PubMed] [Google Scholar]
- Kuerbitz J, Arnett M, Ehrman S, Williams MT, Vorhees CV, Fisher SE, Garratt AN, Muglia LJ, Waclaw RR, and Campbell K (2018). Loss of Intercalated Cells (ITCs) in the Mouse Amygdala of Tshz1 Mutants Correlates with Fear, Depression, and Social Interaction Phenotypes. J. Neurosci 38, 1160–1177. [DOI] [PMC free article] [PubMed] [Google Scholar]
- Lau B, and Glimcher PW (2008). Value representations in the primate striatum during matching behavior. Neuron 58, 451–463. [DOI] [PMC free article] [PubMed] [Google Scholar]
- Lawhorn C, Smith DM, and Brown LL (2009). Partial ablation of mu-opioid receptor rich striosomes produces deficits on a motor-skill learning task. Neuroscience 163, 109–119. [DOI] [PMC free article] [PubMed] [Google Scholar]
- Li N, Daie K, Svoboda K, and Druckmann S (2016). Robust neuronal dynamics in premotor cortex during motor planning. Nature 532, 459–464. [DOI] [PMC free article] [PubMed] [Google Scholar]
- Markowitz JE, Gillis WF, Beron CC, Neufeld SQ, Robertson K, Bhagat ND, Peterson RE, Peterson E, Hyun M, Linderman SW, et al. (2018). The Striatum Organizes 3D Behavior via Moment-to-Moment Action Selection. Cell 174, 44–58. [DOI] [PMC free article] [PubMed] [Google Scholar]
- Menegas W, Akiti K, Amo R, Uchida N, and Watabe-Uchida M (2018). Dopamine neurons projecting to the posterior striatum reinforce avoidance of threatening stimuli. Nat. Neurosci 21, 1421–1430. [DOI] [PMC free article] [PubMed] [Google Scholar]
- Nelson AB, and Kreitzer AC (2014). Reassessing models of basal ganglia function and dysfunction. Annu. Rev. Neurosci 37, 117–135. [DOI] [PMC free article] [PubMed] [Google Scholar]
- Nonomura S, Nishizawa K, Sakai Y, Kawaguchi Y, Kato S, Uchigashima M, Watanabe M, Yamanaka K, Enomoto K, Chiken S, et al. (2018). Monitoring and Updating of Action Selection for Goal-Directed Behavior through the Striatal Direct and Indirect Pathways. Neuron 99, 1302–1314. [DOI] [PubMed] [Google Scholar]
- Parker JG, Marshall JD, Ahanonu B, Wu YW, Kim TH, Grewe BF, Zhang Y, Li JZ, Ding JB, Ehlers MD, and Schnitzer MJ (2018). Diametric neural ensemble dynamics in parkinsonian and dyskinetic states. Nature 557, 177–182. [DOI] [PMC free article] [PubMed] [Google Scholar]
- Pascoli V, Hiver A, Van Zessen R, Loureiro M, Achargui R, Harada M, Flakowski J, and Lüscher C (2018). Stochastic synaptic plasticity underlying compulsion in a model of addiction. Nature 564, 366–371. [DOI] [PubMed] [Google Scholar]
- Pnevmatikakis EA, Soudry D, Gao Y, Machado TA, Merel J, Pfau D, Reardon T, Mu Y, Lacefield C, Yang W, et al. (2016). Simultaneous Denoising, Deconvolution, and Demixing of Calcium Imaging Data. Neuron 89, 285–299. [DOI] [PMC free article] [PubMed] [Google Scholar]
- Reardon TR, Murray AJ, Turi GF, Wirblich C, Croce KR, Schnell MJ, Jessell TM, and Losonczy A (2016). Rabies Virus CVS-N2c(ΔG) Strain Enhances Retrograde Synaptic Transfer and Neuronal Viability. Neuron 89, 711–724. [DOI] [PMC free article] [PubMed] [Google Scholar]
- Samejima K, Ueda Y, Doya K, and Kimura M (2005). Representation of action-specific reward values in the striatum. Science 310, 1337–1340. [DOI] [PubMed] [Google Scholar]
- Saunders A, Macosko EZ, Wysoker A, Goldman M, Krienen FM, de Rivera H, Bien E, Baum M, Bortolin L, Wang S, et al. (2018). Molecular Diversity and Specializations among the Cells of the Adult Mouse Brain. Cell 174, 1015–1030. [DOI] [PMC free article] [PubMed] [Google Scholar]
- Schwarz LA, Miyamichi K, Gao XJ, Beier KT, Weissbourd B, DeLoach KE, Ren J, Ibanes S, Malenka RC, Kremer EJ, and Luo L (2015). Viral-genetic tracing of the input-output organization of a central noradrenaline circuit. Nature 524, 88–92. [DOI] [PMC free article] [PubMed] [Google Scholar]
- Shin JH, Kim D, and Jung MW (2018). Differential coding of reward and movement information in the dorsomedial striatal direct and indirect pathways. Nat. Commun 9, 404. [DOI] [PMC free article] [PubMed] [Google Scholar]
- Smith JB, Klug JR, Ross DL, Howard CD, Hollon NG, Ko VI, Hoffman H, Callaway EM, Gerfen CR, and Jin X (2016). Genetic-Based Dissection Unveils the Inputs and Outputs of Striatal Patch and Matrix Compartments. Neuron 91, 1069–1084. [DOI] [PMC free article] [PubMed] [Google Scholar]
- Stanley G, Gokce O, Malenka RC, Sudhof TC, and Quake SR (2020). Continuous and Discrete Neuron Types of the Adult Murine Striatum. Neuron 105, 688–699. [DOI] [PubMed] [Google Scholar]
- Stephenson-Jones M, Yu K, Ahrens S, Tucciarone JM, van Huijstee AN, Mejia LA, Penzo MA, Tai LH, Wilbrecht L, and Li B (2016). A basal ganglia circuit for evaluating action outcomes. Nature 539, 289–293. [DOI] [PMC free article] [PubMed] [Google Scholar]
- Taniguchi H, He M, Wu P, Kim S, Paik R, Sugino K, Kvitsiani D, Fu Y, Lu J, Lin Y, et al. (2011). A resource of Cre driver lines for genetic targeting of GABAergic neurons in cerebral cortex. Neuron 71, 995–1013. [DOI] [PMC free article] [PubMed] [Google Scholar]
- Tecuapetla F, Jin X, Lima SQ, and Costa RM (2016). Complementary Contributions of Striatal Projection Pathways to Action Initiation and Execution. Cell 166, 703–715. [DOI] [PubMed] [Google Scholar]
- Vardy E, Robinson JE, Li C, Olsen RHJ, DiBerto JF, Giguere PM, Sassano FM, Huang XP, Zhu H, Urban DJ, et al. (2015). A New DREADD Facilitates the Multiplexed Chemogenetic Interrogation of Behavior. Neuron 86, 936–946. [DOI] [PMC free article] [PubMed] [Google Scholar]
- Vicente AM, Galvão-Ferreira P, Tecuapetla F, and Costa RM (2016). Direct and indirect dorsolateral striatum pathways reinforce different action strategies. Curr. Biol 26, R267–R269. [DOI] [PMC free article] [PubMed] [Google Scholar]
- Wallace ML, Saunders A, Huang KW, Philson AC, Goldman M, Macosko EZ, McCarroll SA, and Sabatini BL (2017). Genetically Distinct Parallel Pathways in the Entopeduncular Nucleus for Limbic and Sensorimotor Output of the Basal Ganglia. Neuron 94, 138–152. [DOI] [PMC free article] [PubMed] [Google Scholar]
- White NM, and Hiroi N (1998). Preferential localization of self-stimulation sites in striosomes/patches in the rat striatum. Proc. Natl. Acad. Sci. USA 95, 6486–6491. [DOI] [PMC free article] [PubMed] [Google Scholar]
- Yamada H, Inokawa H, Matsumoto N, Ueda Y, and Kimura M (2011). Neuronal basis for evaluating selected action in the primate striatum. Eur. J. Neurosci 34, 489–506. [DOI] [PubMed] [Google Scholar]
- Yoshizawa T, Ito M, and Doya K (2018). Reward-Predictive Neural Activities in Striatal Striosome Compartments. eNeuro 5, ENEURO.0367–17.2018. [DOI] [PMC free article] [PubMed] [Google Scholar]
- Yu K, Garcia da Silva P, Albeanu DF, and Li B (2016). Central Amygdala Somatostatin Neurons Gate Passive and Active Defensive Behaviors. J. Neurosci 36, 6488–6496. [DOI] [PMC free article] [PubMed] [Google Scholar]
- Zeisel A, Hochgerner H, Lonnerberg P, Johnsson A, Memic F, van der Zwan J, Haring M, Braun E, Borm LE, La Manno G, et al. (2018). Molecular Architecture of the Mouse Nervous System. Cell 174, 999–1014. [DOI] [PMC free article] [PubMed] [Google Scholar]
- Zhang X, and Li B (2018). Population coding of valence in the basolateral amygdala. Nat. Commun 9, 5195. [DOI] [PMC free article] [PubMed] [Google Scholar]
- Zhou P, Resendez SL, Rodriguez-Romaguera J, Jimenez JC, Neufeld SQ, Giovannucci A, Friedrich J, Pnevmatikakis EA, Stuber GD, Hen R, et al. (2018). Efficient and accurate extraction of in vivo calcium signals from microendoscopic video data. eLife 7, e28728. [DOI] [PMC free article] [PubMed] [Google Scholar]
Associated Data
This section collects any data citations, data availability statements, or supplementary materials included in this article.
Supplementary Materials
Figure S1. Characterization of Tshz1+ Neurons and Pdyn+ Neurons, Related to Figure 1
(A) Confocal images of coronal brain sections from a Tshz1-2A-FlpO;Frt-stop-Frt-tdTomato mouse, showing the distribution of Tshz1+ neurons.
(B) Confocal images of a coronal brain section from a Tshz1-2A-FlpO;Frt-stop-Frt-tdTomato mouse, showing the distribution of Tshz1tdTomato neurons (first from left) and cholinergic interneurons (labeled with antibodies recognizing choline acetyltransferase (ChAT)) (second from left) in the DS. An overlay image (third from left) shows both populations. The rightmost panel consists of high magnification images of the boxed area in the left three panels.
(C) Quantification shows Tshz1tdTomato neurons do not express ChAT (n = 3 mice).
(D) Confocal images of a coronal brain section from a Tshz1-2A-FlpO;Frt-stop-Frt-tdTomato mouse, showing the distribution of Tshz1tdTomato neurons (first from left) and parvalbumin (PV) interneurons (labeled with antibodies recognizing PV) (second from left) in the DS. An overlay image (third from left) shows both populations. The rightmost panel consists of high magnification images of the boxed area in the left three panels.
(E) Quantification shows Tshz1tdTomato neurons do not express PV (n = 3 mice).
(F) Confocal images of a coronal brain section from a Tshz1-2A-FlpO;Frt-stop-Frt-tdTomato mouse, showing the distribution of Tshz1tdTomato neurons (first from left) and somatostatin (SOM) interneurons (labeled with antibodies recognizing SOM) (second from left) in the DS. An overlay image (third from left) shows both populations. The rightmost panel consists of high magnification images of the boxed areas in the left three panels.
(G) Quantification shows Tshz1tdTomato neurons do not express SOM (n = 3 mice).
(H–N) Tshz1 and Pdyn label dMSNs in the direct pathway.
(H) A schematic of the approach for anterograde tracing.
(I) Confocal images of Tshz1+ DS neurons labeled with eYFP (Tshz1eYFP). On the right is a high magnification image of the boxed area on the left.
(J) Images of the axons originating from the Tshz1eYFP neurons shown in (I).
(K) A schematic of the approach to compare the neural projections of the Tshz1+ MSNs and the general population of dMSNs.
(L) Images of brain sections from a Tshz1-2A-FlpO;D1-Cre mouse prepared as in (K). Top: D1 neurons in the DS were labeled with mCherry (D1mCherry), which revealed that these neurons sent projections to the GPe, GPi and SNr. Middle: Tshz1+ neurons in the DS were labeled with eYFP (Tshz1eYFP), which revealed that these neurons also sent projections to the GPe, GPi and SNr. Bottom: overlay images showing D1mCherry and Tshz1eYFP had the same projection pattern.
(M) A schematic showing the approach.
(N) Images taken from a mouse prepared as in (M), showing Pdyn+ neurons in the DS labeled with ChR2-eYFP. These neurons sent projections to the GPe, GPi and SNr.
(O) Confocal images of in situ hybridization for Tshz1tdTomato, Pdyn, and Drd1 in the nucleus accumbens (NAc).
(P) High magnification images of the boxed area in (O), showing that Tshz1 and Pdyn only partially overlap, but both overlap with Drd1.
(Q) Quantification of the fractions of Tshz1+ nuclei that were positive for Pdyn and Drd1, and the fractions of Pdyn+ nuclei that were positive for Tshz1 and Drd1 in the NAc (n = 2 mice).
DS, dorsal striatum; GPe, globus pallidus externus; GPi, globus pallidus internus; MGB, medial geniculate body; NAc, nucleus accumbens; OB, olfactory bulb; Pir, piriform cortex; SNr, substantia nigra pars reticulata; SNc, substantia nigra pars compacta.
Figure S2. Optogenetic Activation of Tshz1+ dMSNs, iMSNs, or Pdyn+ dMSNs, Related to Figure 2
(A) A schematic of the experimental approach to verify the specificity of the AAV-CreOFF/FlpON-ChR2.
(B) Representative confocal images of a coronal brain section from a mouse prepared as in A. At the bottom are high magnification images of the boxed region in the images on the top, showing ChR2 expression (green) in Tshz1tdTomato dMSNs (red).
(C) Quantification of the ChR2-expressing neurons that are Tshz1tdTomato+ (89.1 ± 1.5%; n = 6 slices / 2 mice).
(D) A schematic of the approach to activate Tshz1+ dMSNs.
(E) Quantification of movement distance (left) and velocity (right) of mice prepared as in D, during baseline and photo-stimulation sessions (n = 6 mice; distance, F(2,15) = 5.36, p = 0.018, *p < 0.05; velocity, F(2,15) = 5.43, p = 0.017, *p < 0.05; one-way ANOVA followed by Tukey’s test).
(F) Same as in E (right), except that velocity was quantified separately for movement in the left side and right side of the chamber (F(2,30) = 5.79, p = 0.0075, *p = 0.027, n.s., p > 0.05, two-way ANOVA followed by Tukey’s test).
(G) A schematic of the approach for the control experiment.
(H) Quantification of movement distance (left) and velocity (right) of mice prepared as in G, during baseline and photo-stimulation sessions (n = 6 mice; distance, F(2,15) = 1.47, p = 0.26, n.s., p > 0.05; velocity, F(2,15) = 1.44, p = 0.27, n.s., p > 0.05; one-way ANOVA).
(I) Same as in H (right), except that velocity was quantified separately for movement in the left side and right side of the chamber (F(2,30) = 0.0065, p = 0.99, n.s., p > 0.05, two-way ANOVA).
(J–M) Selective activation of D2 neurons in the DS induced aversive responses and reduced movements.
(J) A schematic of the approach (left) and an image of a sagittal brain section (right) from a mouse prepared as shown in the left. Note that D2 neurons project to the GPe but not GPi or SNr.
(K) Heat-maps for the activity of a representative mouse at baseline (top), or in a situation whereby entering the left (middle) or right (bottom) side of the chamber triggered photo-activation of D2 MSNs.
(L and M) Quantification of the mouse activity as shown in K. The mice (n = 4) avoided the side associated with photo-activation of D2 MSNs (L) (F(2,9) = 312.5, p < 0.0001, ***p < 0.001, one-way ANOVA followed by Tukey’s test), and reduced movement velocity following the activation (M) (F(2,9) = 5.06, p = 0.034, *p < 0.05, n.s., p > 0.05, one-way ANOVA followed by Tukey’s test).
(N–P) The choice task.
(N) Schematics of the task structure. In the forced choice trials, water is available only at the side-port indicated by light (light is turned on at only one port in each trial). In the free choice trials, water is available at both of the side-ports (light is turned on at both ports in each trial), but drinking at one of the ports triggers photo-stimulation in the DS.
(O) An example session by a control mouse in which the Tshz1+ dMSNs expressed eYFP, showing that the choice of this mouse was not affected by the photo-stimulation.
(P) Quantification of choice behavior in the forced-choice trials, showing that neither the experimental mice (ChR2) (in which the Tshz1+ dMSNs expressed ChR2) nor the control mice (eYFP) had biases before testing in the free choice trials (F(1,20) = 0.051, p = 0.82, n.s., p > 0.05, two-way ANOVA).
(Q) A schematic of the approach to activate Pdyn+ dMSNs.
(R) Quantification of movement distance (left) and velocity (right) of mice prepared as in Q, during baseline and photo-stimulation sessions. The photo-activation (n = 6 mice) increased movement distance (F(2,15) = 4.60, p = 0.028; *p < 0.05, one-way ANOVA followed by Bonferroni’s test) and velocity (F(2,15) = 6.03, p = 0.012; *p < 0.05, one-way ANOVA followed by Tukey’s test).
(S) Same as that in R (right), except that velocity was quantified separately for movement in the left side and right side of the chamber (F(2,30) = 8.85, p = 0.0010; *p < 0.05, **p < 0.01, two-way ANOVA followed by Tukey’s test).
(T-AA) Histological verification of the placement of optical fibers.
(T, V, X, and Z) Schematics of the experimental approach.
(U, W, Y, and AA) Schematics corresponding to T, V, X and Z, respectively, showing the locations of optic fiber placement in the mice used for the various experiments as indicated.
Data are presented as mean ± s.e.m.
Figure S3. Targeting MSNs in the Direct Pathway with Enhanced Specificity, Related to Figure 2
(A–D) Selective activation of Tshz1+ neurons exclusive of D2 neurons in the DS, using an intersectional strategy, induced aversive responses and reduced movements.
(A) A schematic of the approach (left) and a confocal image of a coronal brain section (right) from a mouse prepared as shown in the left.
(B) Heat-maps for the activity of a representative mouse at baseline (top), or in a situation whereby entering the left (middle) or right (bottom) side of the chamber triggered photo-activation of Tshz1+/D2− neurons in the DS.
(C and D) Quantification of the mouse activity as shown in B. The mice (n = 5) avoided the side associated with the photo-activation (C) (F(2,12) = 32.75, p = 0.0004, *p < 0.05, one-way ANOVA followed by Tukey’s test), and reduced movement velocity following the activation (D) (F(2,12) = 6.01, p = 0.016, *p < 0.05, n.s., p > 0.05, one-way ANOVA followed by Tukey’s test).
(E–H) Activation of GPi inputs originating from Tshz1+ neurons in the DS induced aversive responses and reduced movements.
(E) A schematic of the approach (left) and a confocal image of a coronal brain section (right) from a mouse prepared as shown in the left.
(F) Heat-maps for the activity of a representative mouse at baseline (top), or in a situation whereby entering the left (middle) or right (bottom) side of the chamber triggered photo-activation of GPi inputs originating from Tshz1+ neurons in the DS.
(G and H) Quantification of the mouse activity as shown in F. The mice (n = 4) avoided the side associated with the photo-activation (G) (F(2,9) = 16.15, p = 0.0011, *p < 0.05, one-way ANOVA followed by Tukey’s test), and reduced movement velocity following the activation (H) (F(2,9) = 7.85, p = 0.011, *p < 0.05, **p < 0.01, one-way ANOVA followed by Tukey’s test).
(I–L) Selective activation of D1 neurons exclusive of Tshz1+ neurons in the DS, using an intersectional strategy, induced reward responses.
(I) A schematic of the approach (left) and an image of a sagittal brain section (right) from a mouse prepared as shown in the left. Note that D1 neurons project to the GPi and SNr.
(J) Heat-maps for the activity of a representative mouse at baseline (top), or in a situation whereby entering the left (middle) or right (bottom) side of the chamber triggered photo-activation of D1+/Tshz1− dMSNs.
(K and L) Quantification of the mouse activity as shown in J. The mice (n = 4) preferred the side associated with the photo-activation (K) (F(2,9) = 87.43, p < 0.0001, ***p < 0.001, **p < 0.01, one-way ANOVA followed by Tukey’s test), and did not show changes in movement velocity following the stimulation (L) (F(2,9) = 0.16, p = 0.85, n.s., p > 0.05, one-way ANOVA followed by Tukey’s test).
(M–P) Activation of GPi inputs originating from Pdyn+ neurons in the DS induced reward responses.
(M) A schematic of the approach (left) and a confocal image of a coronal brain section (right) from a mouse prepared as shown in the left.
(N) Heat-maps for the activity of a representative mouse at baseline (top), or in a situation whereby entering the left (middle) or right (bottom) side of the chamber triggered photo-activation of GPi inputs originating from Pdyn+ neurons in the DS.
(O and P) Quantification of the mouse activity as shown in N. The mice (n = 4) preferred the side associated with the photo-activation (O) (F(2,9) = 60.15, p < 0.0001, ***p < 0.001, **p < 0.01, one-way ANOVA followed by Tukey’s test), and had a tendency to show increased movement velocity following the activation (P) (F(2,9) = 1.78, p = 0.22, n.s., p > 0.05, one-way ANOVA followed by Tukey’s test).
Data are presented as mean ± s.e.m.
Figure S4. GPi-projecting Tshz1+ MSNs Are Preferentially Excited by and Represent the Value of Aversive Stimuli, Related to Figure 3
(A–C) Schematics of the approach (A), experimental setup (B) and design (C).
(D) Top: licking events, sorted according to trial types, for a representative Tshz1-2A-FlpO mouse in the early (left) and late (right) stages of training in the Pavlovian task. Middle: average licking rates of this mouse in different types of trials as indicated. Bottom: average GCaMP6 signals from the GPi-projecting Tshz1+ MSNs in this mouse, obtained from different types of trials. Dashed lines indicate the onset of CS and US, as indicated.
(E) Left: quantification of the responses of GPi-projecting Tshz1+ MSNs in all mice to different stimuli at the early stage of training (n = 5 mice; F(1,8) = 17.48, p = 0.0031; CS response, p = 0.56 (n.s.); US response, ***p < 0.0001; two-way ANOVA followed by Bonferroni’s test). Right: quantification of the responses of GPi-projecting Tshz1+ MSNs in all mice to different stimuli at the late stage of training (n = 5 mice; F(1,8) = 10.94, p = 0.011; CS response, p = 0.26 (n.s.); US response, ***p = 0.0009; two-way ANOVA followed by Bonferroni’s test).
(F) Trial-by-trial (top) and average (bottom) responses of GPi-projecting Tshz1+ MSNs in an example mouse to air puffs of different durations.
(G) Quantification of the responses of GPi-projecting Tshz1+ MSNs in all mice to air puffs of different durations (n = 5 mice; F(2,12) = 9.12, **p = 0.0039, one-way ANOVA followed by Tukey’s test).
Data are presented as mean ± s.e.m. Shaded areas represent s.e.m.
Figure S5. Mapping the Monosynaptic Inputs onto Tshz1+ dMSNs and Pdyn+ dMSNs, Related to Figure 3 and STAR Methods
(A–J) Mapping the inputs onto Tshz1+ dMSNs.
(A) A schematic of the approach (see STAR Methods).
(B) Images of a coronal brain section from a mouse prepared as in A, showing the Tshz1+ dMSNs infected by the helper viruses (red) and the cells infected by the rabies virus (green). The starter cells are yellow, as indicated in the high magnification images on the right.
(C) Representative images of the SNc area, showing input neurons labeled by the rabies virus. Many of these neurons are dopaminergic, as indicated by their expression of tyrosine hydroxylase (TH).
(D–I), Representative images showing input neurons in the medial prefrontal cortex (D), insular cortex (E), anterior thalamus (F), basal lateral amygdala (BLA) (G), motor cortex and somatosensory cortex (H) and subiculum (I).
(J) A series of coronal sections, ipsilateral to site of injection, from a representative mouse showing the major monosynaptic inputs to Tshz1+ dMSNs. (K-O) Mapping the inputs onto Pdyn+ dMSNs.
(K) A schematic of the approach (see STAR Methods).
(L) Images of a coronal brain section from a mouse prepared as in K, showing the Pdyn+ dMSNs infected by the helper viruses (red) and the cells infected by the rabies virus (green). The starter cells are yellow, as indicated in the high magnification images on the right.
(M) Representative images of the SNc area, showing input neurons labeled by the rabies virus. Many of these neurons are dopaminergic, as indicated by their expression of TH.
(N) A representative image showing input neurons in the BLA and central amygdala (CeA).
(O) A series of coronal sections, ipsilateral to site of injection, from a representative mouse showing the major monosynaptic inputs to Pdyn+ dMSNs.
(P) Normalized distributions of rabies-labeled input neurons across different brain areas in each hemisphere (ipsilateral or contralateral to the injection site). The inputs onto Tshz1+ or Pdyn+ dMSNs are color coded as indicated (*p < 0.05, **p < 0.01, ***p < 0.001, t test).
Data are presented as mean ± s.e.m.
Figure S6. Imaging the Activities of Tshz1+ dMSNs in Behaving Mice, Related to Figures 4, 5, and 6
(A) A representative confocal image of GCaMP6m expression in Tshz1+ dMSNs.
(B) Left, the field of view (FOV), which was captured using a wide-field microscope equipped with a 10x objective, through a GRIN lens implanted in the DS. In the FOV are raw GCaMP6m fluorescence signals from Tshz1+ dMSNs. Right, the spatial locations of individual extracted neurons (see STAR Methods) in the FOV shown on the left. The contours of 7 representative neurons were colored in yellow and numbered.
(C) The temporal calcium activities of the 7 neurons outlined in B during the Pavlovian conditioning. Neurons #1–4 responded to air puff, neurons #5, 6 responded to water, and neuron #7 was not responsive to either US. Red bars indicate the period from CS1 onset to air-puff delivery. Green bars indicate the period from CS2 onset to water delivery.
(D) Left: a confocal histological image showing the location of GRIN lens implantation in a mouse used for the imaging experiments. Right: a high magnification image of the boxed area on the left, showing the expression of GCaMP6m in Tshz1+ dMSNs.
(E) A schematic showing the placement of GRIN lens implants in the mice (n = 6) used for imaging. (F–I) Characterization of Tshz1+ dMSN activities during Pavlovian conditioning.
(F) Heat-maps of neuronal responses to different stimuli before (left) and after (right) training in the Pavlovian conditioning. In either the left or the right panel, each row represents the responses of one neuron; neurons are sorted according to their responses to the air puff.
(G) Trial-by-trial responses of three example neurons, each of which was chosen from the corresponding panel in F.
(H) Five example Tshz1+ dMSNs exhibiting different responses to the aversive or appetitive stimuli.
(I) Pie charts showing the percentage distribution of Tshz1+ dMSNs according to their response profiles to US1 (air puff) and US2 (water), before (left) and after (right) training in the Pavlovian conditioning task. NVNs, negative valence neurons; PVNs, positive valence neurons.
(J and K) Tshz1+ dMSNs are activated by different aversive stimuli.
(J) Z-score activity plots of the responses of all neurons to air puffs and tail shocks, the onset of which is indicated by the dashed lines. Each row represents the activities of one neuron. On the right are the first three principle components (PC) and hierarchical clustering (see STAR Methods) dendrogram showing the relationship of each neuron within the four clusters.
(K) Average z-scored responses of the four types of neurons to the air puff and shock (n = 380 neurons from 3 mice). Note that a major population (72%) shows excitatory response to the shock (cluster III & IV), including a subpopulation (40%) excited by both shock and air puff (cluster III).
(L and M) Characterization of Tshz1+ dMSN activities during active avoidance.
(L) Heat-maps of neuronal responses in the three different types of trials in the active avoidance task. Each row represents the responses of one neuron; neurons are sorted according to their responses after air-puff delivery in the failure trials.
(M) Average running velocity (top) and average activity of all the Tshz1+ dMSNs imaged (bottom) in these mice in different types of trials as indicated.
Data are presented as mean ± s.e.m. Shaded areas represent s.e.m.
Figure S7. Chemogenetic Inhibition of Tshz1+ dMSNs Impairs Learning but Does Not Affect Sensorimotor Functions, Related to Figure 7
(A) Quantification of the effect of inhibiting Tshz1+ dMSNs on discriminability (see STAR Methods) at different learning stages. Left: discriminability in each session (during learning, F(9,90) = 1.58, p = 0.13; after learning, F(3,30) = 0.40, p = 0.75; two-way ANOVA). Right: average discriminability across sessions (F(1,20) = 5.42, p = 0.03; during learning, *p = 0.04; after learning, p = 0.68; two-way ANOVA followed by Tukey’s test). n.s., non-significant.
(B–E) Quantification of the effect of inhibiting Tshz1+ dMSNs on licking response during baseline period (B), following the go cue (C), following the no-go cue (D), and during water consumption (E).
(B) Left: licking rate during baseline period in each session (during learning, F(9,90) = 0.42, p = 0.92; after learning, F(3,30) = 1.10, p = 0.37; two-way ANOVA). Right: average licking rate during baseline across sessions (F(1,20) = 0.45, p = 0.51; two-way ANOVA).
(C) Left: licking rate following the go cue in each session (during learning, F(9,90) = 0.57, p = 0.82; after learning, F(3,30) = 0.33, p = 0.80; two-way ANOVA). Right: average licking rate following the go cue across sessions (F(1,20) = 0.057, p = 0.81; two-way ANOVA).
(D) Left: licking rate following the no-go cue in each session (during learning, F(9,90) = 0.42, p = 0.92; after learning, F(3,30) = 0.85, p = 0.48; two-way ANOVA). Right: average licking rate following the no-go cue across sessions (F(1,20) = 1.30, p = 0.27; two-way ANOVA).
(E) Left: licking rate following water delivery in each session (during learning, F(9,90) = 0.22, p = 0.99; after learning, F(3,30) = 0.60, p = 0.62; two-way ANOVA). Right: average licking rate following water delivery across sessions (F(1,20) = 0.21, p = 0.66; two-way ANOVA).
(F) Left: lick-suppression index, which measures the supressing effects of air puff on licking (STAR Methods), during false alarm in the no-go trials in each session during learning (F(9,90) = 1.06, p = 0.40 (n.s.), two-way ANOVA). Right: average lick-suppression across sessions (t(10) = 0.498, p = 0.63, t test).
(G) Top: a schematic of the experimental procedure. Bottom: tracks of representative mice in which the Tshz1+ dMSNs expressed eYFP (left) or KORD (right) in the open field test. The red boxes mark the center area of the arena.
(H–K) Quantification of movement parameters in the open field.
(H) Movement distance (t(10) = 0.17, p = 0.87, t test).
(I) Movement velocity (t(10) = 0.17, p = 0.87, t test).
(J) Time spent in the center (t(10) = 0.49, p = 0.63, t test).
(K) Quantification of movement distance across time (F(9,100) = 0.30, p = 0.97, two-way ANOVA).
(L) A circuit model. A model diagram showing the circuits engaged by Tshz1+ and Pdyn+ striosomal dMSNs. LHb, lateral habenula; RMTg, rostromedial tegmental nucleus; VTA, ventral tegmental area.
Data are presented as mean ± s.e.m.
Data Availability Statement
The custom code that support the findings from this study are available from the Lead Contact upon request.