

Abstract
Background and Objectives
This study examined the association between body mass index (BMI) and disability in children with Charcot-Marie-Tooth disease (CMT).
Methods
We conducted a cross-sectional analysis of 477 patients with CMT who were 3 to 20 years of age from the Inherited Neuropathy Consortium and 316 age- and sex-matched healthy children from the 1,000 Norms Project. BMI was categorized according to the International Obesity Task Force (IOTF) criteria, and BMI categorization was compared with healthy children. IOTF categories (adult equivalent BMI cut points) were severely underweight (BMI <17 kg/m2), underweight (BMI ≥17–<18.5 kg/m2), healthy weight (BMI ≥18.5–<25 kg/m2), overweight (BMI ≥25–<30 kg/m2), and obese (BMI ≥30 kg/m2). Scores on the 0 to 44–point CMT Pediatric Scale (CMTPedS), a well-validated measure of disability, were examined in relation to BMI.
Results
There was a higher proportion of children with CMT categorized as severely underweight (5.7% vs 0.3%), underweight (10.3% vs 5.1%), and obese (7.3% vs 3.8%) (p < 0.05). Fewer children with CMT were categorized as healthy weight (61.8% vs 74.4%) (p < 0.05), and the proportion of overweight (14.9% vs 16.5%) between groups was similar. CMTPedS scores (mean ± SD) for weight categories were as follows: severely underweight 27 ± 9, underweight 20 ± 8, healthy weight 17 ± 9, overweight 17 ± 9, and obese 22 ± 10. Compared to children with a healthy weight with CMT, being severely underweight was associated with being more disabled (p < 0.001), as was being obese (p = 0.015).
Discussion
The proportion of children with CMT who are underweight or obese is higher compared to age- and sex-matched healthy children. In children with CMT, being underweight or obese is associated with greater disability, when compared to children with CMT of healthy weight.
Charcot-Marie-Tooth disease (CMT) is the most common inherited neuromuscular disorder, affecting ≈1 in 2,500 individuals with broad phenotypic variability, and includes hereditary disorders that are associated primarily with motor and sensory deficits of the peripheral nervous system.1,2 CMT is characterized by distal to proximal reduction in muscle bulk, muscle weakness, sensory loss, areflexia, hand and foot deformity, and gait difficulties.1,3 The classification of CMT is based on the type of nerve damage, inheritance pattern, and underlying genetic mutation. More than 100 genetic loci have been associated with CMT.4 The most common subtype, CMT1A, associated with the peripheral myelin protein-22 (PMP22) gene duplication, accounts for ≈50% of all CMT.5,6 Body mass index (BMI) has been shown to influence function in healthy children and in those with neuromuscular disorders and may influence disability in CMT.7
BMI is a measure of weight in relation to height, and reference values have been developed according to age, sex, and ethnicity. It is the most widely used indicator of adiposity and is a predictor for lifestyle disease risk among children and adolescents.8 Strongly associated with total body fat content in adults, BMI also correlates with adiposity measures in children, although change in weight during childhood is also influenced by varying growth at different stages of development.9 BMI may be expressed as a value (weight/height2), a percentile, or a z score compared to normative data, and currently, classification systems from the Centers for Disease Control and Prevention (CDC), International Obesity Task Force (IOTF), and the World Health Organization (WHO) are used to categorize weight status in childhood. BMI is used as part of health and growth assessment in both healthy, typically developing children and those with underlying disease and disability.
Healthy young children who are overweight have greater fat infiltration into muscle and show impairment in balance and gait, increased foot pressure, and reduced bone strength that may influence function and quality of life.7,10,11 An excess of body fat, muscle atrophy, and fatty infiltration of muscles are significant issues in children with neuromuscular disease.12 Children with CMT have been shown to be less active than typically developing children.13,14 Studies in boys with Duchenne muscular dystrophy have shown that obesity is common in the early teenage years, and increases in fat mass exert extra load on weakened muscles groups, further reducing mobility, while both obesity and being underweight are common in the later teenage years and early adulthood.15-19 Studies of body composition in children with spinal muscular atrophy have shown a reduction in muscle and an increase in fat mass with increasing age.20-23 While the long-term effect of being overweight has been studied in otherwise healthy children and those with neuromuscular disorders, the impact of being underweight is not well understood.24 Little is also known about the effect of BMI on disease severity in children with CMT. Muscle atrophy, increased adiposity, and poor nutrition may contribute to an unhealthy BMI in children with CMT, and each may be amenable to modification, with implications for overall health outcomes.
Methods
Objective
The goals of this work were to characterize the BMI profile of a large cohort of children with CMT compared with healthy norms and to assess the influence of BMI on disability, measured by the well-validated CMT Pediatric Scale (CMTPedS).
Design and Settings
A total of 477 children and adolescents 3 to 20 years with CMT were recruited as part of the Inherited Neuropathy Consortium. Data were collected between the years 2009 and 2015. Patients were enrolled from 8 sites: the University of Sydney/Children's Hospital at Westmead, Australia; Fondazione IRCCS Istituto Neurologico Carlo Besta, Milan, Italy; National Hospital of Neurology and Neurosurgery/Great Ormond Street Hospital London, England; Nemours Children's Hospital Orlando, FL; University of Iowa Health Care, Iowa City; Wayne State University Detroit, MI; Children's Hospital of Philadelphia, PA; and University of Rochester, NY.
Participant data included demographic information, clinical features, and genetic diagnosis. Anthropometric data collected included height and weight, which were used to calculate BMI (weight in kilograms divided by height in meters squared).25 The diagnosis of CMT was made from clinical features, nerve conduction studies, family history, and genetic testing. Data from 316 (n = 316) age- and sex-matched healthy children were obtained from the 1,000 Norms Project and were compared to those from children with CMT.26 The 1,000 Norms Project is a large observational study that established reference values for functional outcome measures, including isometric muscle strength and joint flexibility, as well as demographic and anthropometric factors, for 1,000 healthy male and female individuals 3 to 101 years of age. Data for individuals 3 to 20 years of age were extracted from this cohort to provide age- and sex-matched healthy norms. Participants were further stratified into 2 age groups (3–10 and 11–20 years).
Standard Protocol Approvals, Registrations, and Patient Consents
Each institution received approval from an ethics standards committee on human experimentation (institutional or regional). Written informed consent was obtained from all patients or guardians/parents of patients participating in the study (consent for research).
Anthropometry
Weight status was determined with the age- and sex-adjusted IOTF BMI cut points.27,28 IOTF categories used were severely underweight equivalent to an adult BMI <17 kg/m2, underweight equivalent to an adult BMI ≥17 to <18.5 kg/m2, healthy weight equivalent to an adult BMI ≥18.5 to <25 kg/m2, overweight equivalent to an adult BMI ≥25 to <30 kg/m2, and obese equivalent to an adult BMI ≥30 kg/m2. The IOTF classification criteria were selected because they use internationally representative datasets to develop age/sex–specific cut points for BMI linked to adult cut points. Categories were collapsed into 5 subgroups for statistical analysis. This method provides a uniform way of assigning weight status as the child moves through youth to adulthood and is therefore useful for assessing longitudinal change.29 These cut points have been used globally to assess the prevalence of underweight, overweight, and obesity in child and adolescent populations.27,29-31 In the absence of disease-specific weight norms, there is consensus that BMI stratification based on norms derived from healthy children is an important clinical indicator of growth and development in children with neuromuscular disease.16-18,32
BMI was also assessed according to the CDC and WHO classifications. The z scores for height, weight, and BMI were calculated from the US CDC 2000 reference values. The CDC classification uses BMI for age/sex to categorize children as underweight (<5th percentile), normal weight (≥5th–<85th percentile), overweight (≥85th–<95th percentile), and obese (≥95th percentile). The WHO classification is based on BMI for age z scores whereby obesity is defined as a z score >2, overweight as a z score >1, thinness as a z score > −2, and severe thinness as a z score > −3.
Disability
The CMTPedS is a disease-specific clinical outcome assessment used to assess disability in each participant with CMT and was conducted by trained evaluators from each site.3,33 The CMTPedS is a well-validated linearly weighted tool that evaluates fine and gross motor function, strength, sensation, gait, and balance. It is considered a responsive clinical outcome measure for CMT. The CMTPedS provides an age- and sex-adjusted disability score based on normative reference values and allows comparison within and between patients with the various genetic CMT subtypes. The 11-item category assessments include the items of plantarflexion strength, dorsiflexion strength, grip strength (strength measures), Nine-Hole Peg Test (9-HPT), Functional Dexterity Test (hand dexterity measures), pinprick, vibration (lower limb sensation measures), gait, 6-minute walk test (6MWT) (endurance), long jump (power), and balance scored with an online calculator to provide age- and sex-matched z scores for individual items. For individual items, a category score of 0 is indicative of the participant’s z score being within 1 SD of the normative reference mean. A z score of 1 to 2, 2 to 3, or 3 to 4 SDs below normal is converted to category score of 1, 2, or 3, respectively. An SD of >4 below normal will yield a category score of 4. The category scores are added to provide an overall disease severity score between 0 and 44. A score of 0 represents an unaffected individual, while a score of 44 represents the most severely affected individual. The CMTPedS has been shown to accurately capture the natural history of CMT during childhood.33,34 This study included only baseline assessments that occurred during the participants’ initial CMTPedS assessments at their first multidisciplinary CMT visit.
Statistical Analysis
Data analysis was conducted with SPSS version 25.0 (IBM Corp, Armonk, NY). All data were assessed for normality, and appropriate parametric and nonparametric tests were used. IOTF BMI cut points were calculated as distribution percentage for participants with CMT and healthy controls. The χ2 test for independence was conducted between the 2 groups to assess the distribution of participants across BMI categories. One-way analysis of variance was conducted among the CMT cohort to examine distribution against disability status, and significant interactions were examined with Tukey post hoc testing. Each of the 11 items on the CMTPedS scores was also examined individually by the same method. A statistical significance of <0.05 was used throughout the analysis.
Data Availability
Any data not published within the article will be made available in anonymized form on request from any qualified investigator.
Results
Anthropometric and demographic characteristics of the 477 children with CMT from their baseline visit and 316 healthy controls are shown in table 1. Of the children with CMT, 215 (45.1%) were between 3 and 10 years of age, and 262 were between 11 and 20 years. CMT1A was the most prevalent genetic subtype (265 [55.6%]), followed by CMT2A (22 [4.6%]), CMT4C (12 [2.5%]), CMT1B (11 [2.3%]), and CMTX1 (10 [2.1%]).
Table 1.
Demographics and Anthropometrics Comparison Between Children With CMT and Healthy Children

There was a higher proportion of children who were severely underweight, underweight, and obese in the CMT group compared to healthy controls (p < 0.05). Overall BMI category distribution differed between the CMT group and healthy children [χ2(4) = 30.438], p < 0.001. BMI distribution was also compared by use of the WHO and CDC classifications with similar overall distribution (data not shown).35 There was no significant difference in the distribution of BMI according to age (table 2) or sex in either those with CMT or healthy children.
Table 2.
BMI Distribution (IOTF) for Whole Group and Age Groups in Children With CMT and Healthy Children

Weight status was examined for the 5 most common genetic subtypes of CMT (table 3). There was a greater proportion of children being severely underweight, underweight, or obese in CMT1A, similar to the overall CMT cohort. Compared to CMT1A, CMT2A and CMT4C had a greater proportion of children who were severely underweight/underweight, CMT1B had a greater proportion of children who were underweight, and CMTX1 had a greater proportion of children classified overweight or obese.
Table 3.
BMI IOTF Distribution and Mean CMTPedS Scores for all CMT Types and CMT Genetic Subtypes

The mean CMTPedS scores differed according to BMI IOTF groups (Figure 1). CMTPedS total scores (mean ± SD) for each BMI IOTF group were as follows: severely underweight 27.2 ± 8.8, underweight 20.2 ± 8.6, healthy weight 16.8 ± 8.6, overweight 17.3 ± 9.0, and obese 21.3 ± 9.9 (table 3). Compared to a healthy weight with CMT, being severely underweight with CMT was associated with greater disability (p < 0.001), as was being obese (p = 0.015). Compared to children with a healthy weight with CMT, subitem scores also differed according to BMI. Children who were severely underweight scored worse on 6MWT (p = 0.02), plantarflexion strength (p ≤ 0.001), grip strength (p ≤ 0.001), Nine-Hole Peg Test (9-HPT) (p ≤ 0.001), gait (p ≤ 0.001), and pinprick (p ≤ 0.001). Compared to children with a healthy weight with CMT, children with obesity with CMT performed worse on the Nine-Hole Peg Test (9-HPT) (p = 0.008) and 6MWT (p = 0.003) (Figures 2 and 3). No participants scored zero (normal) on the total CMTPedS score for their functional assessments, indicating that some degree of impairment was noted among all participants at baseline.
Figure 1. Mean CMTPedS Disability Scores (With Standard Error) According to BMI Categories.
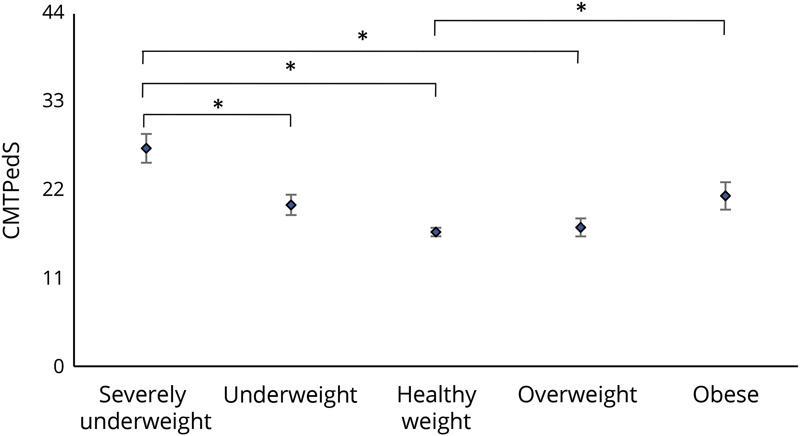
Severely underweight (body mass index [BMI] <17 kg/m2), underweight (BMI ≥17 to <18.5 kg/m2), healthy weight (BMI ≥18.5–<25 kg/m2), overweight (BMI ≥25–<30 kg/m2), and obese (BMI ≥30 kg/m2) (with standard error). Horizontal bars represent significance between groups. CMTPedS = Charcot-Marie-Tooth Pediatric Scale. Significance represented by *p ≤ 0.05.
Figure 2. CMTPedS Item Scores by BMI Categories for Hand Dexterity (Functional Dexterity Test, Nine-Hole Peg Test), Muscle Strength (Grip, Plantarflexion Dorsiflexion), and Power (Long Jump).

Higher mean (SE) item scores indicate higher disability. CMTPedS = Charcot-Marie-Tooth Pediatric Scale. Horizontal bars are significant differences between body mass index (BMI) categories represented by *p ≤ 0.05.
Figure 3. CMTPedS Items Scores by BMI Categories for Balance, Endurance (6-Minute Walk Test), Gait, and Sensation (Pinprick, Vibration).

Higher mean (SE) item scores indicate higher disability. Horizontal bars are significant differences between body mass index (BMI) categories represented by *p ≤ 0.05. CMTPedS = Charcot-Marie-Tooth Pediatric Scale.
The mean CMTPedS scores across severely underweight and healthy weight categories were also higher for those with CMT2A and CMT4C compared with the overall CMT group, as expected for more severe forms of CMT (table 3). Self-reported symptoms varied across weight groups. Compared to children with a healthy weight with CMT, those who were overweight or obese reported more frequent foot pain, those who were obese also reported leg cramps more frequently, and those who were severely underweight reported more frequent occurrence of daily tripping and falling and sensory-related symptoms (tingling or burning).
Discussion
The main finding of this large international study of 477 children and adolescents with CMT was a 3-fold higher frequency of children who were severely underweight and underweight and a 2-fold increase in the prevalence of obesity among the CMT cohort compared to age- and sex-matched healthy children. In children with CMT, being severely underweight, underweight, or obese was associated with greater disability compared to being a healthy weight. An association therefore exists between weight status and CMTPedS scores, with an unhealthy BMI associated with higher disability scores. Worse performance was also found within individual items relating to strength such as plantarflexion and grip, as well as functional measures such as walking performance, dexterity, and gait, in children who are severely underweight, underweight, and obese. The more severe forms of CMT (CMT2A and CMT4C), as expected, had greater disability compared to the overall cohort.
CMT is associated with muscle atrophy that may lower BMI, causing children to fall within the severely underweight or underweight range, and the resulting weakness may contribute to increasing disability. This could be supported by our finding that the more severe forms of CMT (CMT2A, CMT4C, CMT1B) have a greater proportion of children who were severely underweight or underweight. Upper limb impairments, including grip weakness, have previously been identified in young children with CMT, likely a reflection of distal reduction in muscle bulk and strength.33,36,37 Grip strength is considered an indicator of reduced physical function in adults with malnutrition and could be a predictor of malnutrition in paediatrics.38-41
Obesity in healthy children is often attributed to factors such as a reduction in physical activity and the resulting reduced caloric requirement, poor nutritional habits, and socioeconomic and cultural influences.14 In children with CMT, reduced metabolic demands are likely to be a result of muscle atrophy and the inability to perform the same amount of physical exercise as healthy children due to fatigue, pain, or difficulties with balance and gait. In our study, children with obesity with CMT had significantly worse 6MWT results. Body weight and BMI were predictors of 6MWT test interruption in healthy adult and pediatric populations. Children and adults with obesity have been shown to walk less distance overall and work harder than patients without obesity during the 6MWT.42-44 In children and adolescents who are overweight, increased load on already weakened muscles combined with deconditioning due to a sedentary lifestyle may contribute to increases in disability.45 This places children who are overweight and obese with CMT at increased risk of cardiovascular and metabolic disorders throughout adolescence and adult life.46,47 Poor nutrition in children who are underweight and overweight could also contribute to specific nutrient deficiencies (including vitamins B6, B12, and D) that influence muscle and nerve function.48-50 Non–disease-related factors contributing to malnutrition may include poor access to an optimal intake, the socioeconomic availability of an adequate caloric intake, and mental health burden linked to children dealing with a chronic illness affecting poor eating habits.
In this study, individuals who were in the healthy weight, underweight, or overweight range of BMI had lesser disability than those who are severely underweight or obese. The ideal weight BMI range for children with CMT might be different from that of typically developing children, and it is possible that some individuals in the underweight group have lesser disability because they may be protected from the mechanical effects of carrying extra weight.
The current study has a number of limitations. Cross-sectional analysis provides only 1 time point for examining the association between body mass and CMTPedS scores, and a longitudinal study would be needed to understand the impact of BMI on disease progression. In addition, this study has been limited to understanding nutritional status in relation to disability using BMI.
Future studies should consider using more accurate body composition measures such as bioelectrical impedance analysis or dual energy x-ray absorptiometry, evaluations not performed in the current study. The number of children with genetic mutations other than CMT1A was also limited, and future studies would benefit from including increased numbers of other CMT genetic types, although this would be challenging due to lower prevalence.
This study demonstrates that a greater proportion of children with CMT are in an unhealthy BMI range, and being in an unhealthy range is associated with greater disability. There is a greater risk of unhealthy BMI in those with more severe forms of CMT. Assessment of BMI should be part of the clinical care of children with CMT. If an unhealthy BMI is found to be associated with disease progression, then interventional studies will be needed to determine whether maintaining a BMI in the healthy range through better nutritional strategies and exercise can decrease the rate of CMT progression. On the basis of these cross-sectional data, we recommend that families and clinicians aim for a BMI that targets a healthy weight range as opposed to being on the extreme ends of weight for age where disease severity is increased (Figure 1).
BMI may need to be considered an independent variable affecting outcome in natural history studies and clinical trials in children with CMT.
Glossary
- BMI
body mass index
- CDC
Centers for Disease Control and Prevention
- CMT
Charcot-Marie-Tooth disease
- CMTPedS
CMT Pediatric Scale
- IOTF
International Obesity Task Force
- 9-HPT
Nine-Hole Peg Test
- 6MWT
6-minute walk test
- WHO
World Health Organization; Nine-Hole Peg Test (9-HPT)
Appendix. Authors

Study Funding
The authors report no targeted funding.
Disclosure
G.A. Donlevy acknowledges financial support from the University of Sydney Postgraduate Research Scholarship in Childhood Inherited Neuropathy. S.P. Garnett, K.M.D. Cornett, M.J. McKay, J.N. Baldwin, and R.R. Shy report no disclosures. S.W. Yum acknowledges support from the National Institutes of Neurological Diseases and Stroke and Office of Rare Diseases (U54NS065712). T. Estilow, I. Moroni, M. Foscan, E Pagliano, and D. Pareyson report no disclosures. M. Laura acknowledges support from the National Institutes of Neurological Diseases and Stroke and office of Rare Diseases (U54NS065712) and is grateful to the National Institute for Health Research University College London Hospitals Biomedical Research Centre. T. Bhandari reports no disclosures. F. Muntoni acknowledges support from the National Institutes of Neurological Diseases and Stroke and Office of Rare Diseases (U54NS065712) and the support of the Medical Research Council (MRC) Neuromuscular Centre and of the National Institute for Health Research Biomedical Research Centre at Great Ormond Street Hospital for Children NHS Foundation Trust and University College London. M.M. Reilly acknowledges support from the National Institutes of Neurological Diseases and Stroke and Office of Rare Diseases (U54NS065712) and is grateful to the MRC, MRC Centre grant (G0601943), and the National Institute for Health Research University College London Hospitals Biomedical Research Centre. R.S. Finkel acknowledges support from the National Institutes of Neurological Diseases and Stroke and Office of Rare Diseases (U54NS065712). J.E. Sowden and K.J. Eichinger report no disclosures. D.N. Herrmann acknowledges support from the National Institutes of Neurological Diseases and Stroke and Office of Rare Diseases (U54NS065712). M.E. Shy acknowledges support from the National Institutes of Neurological Diseases and Stroke and Office of Rare Diseases (U54NS065712). J. Burns acknowledges support from the National Institutes of Neurological Diseases and Stroke and Office of Rare Diseases (U54NS065712). M.P. Menezes reports no disclosures. The INC (U54NS065712) is a part of the NCATS Rare Diseases Clinical Research Network. Go to Neurology.org/N for full disclosures.
References
- 1.Rossor AM, Polke JM, Houlden H, Reilly MM. Clinical implications of genetic advances in Charcot-Marie-Tooth disease. Nat Rev Neurol. 2013;9(10):562-571. [DOI] [PubMed] [Google Scholar]
- 2.Hoyle JC, Isfort MC, Roggenbuck J, Arnold WD. The genetics of Charcot-Marie-Tooth disease: current trends and future implications for diagnosis and management. Appl Clin Genet. 2015;8:235-243. [DOI] [PMC free article] [PubMed] [Google Scholar]
- 3.Burns J, Ouvrier R, Estilow T, et al. Validation of the Charcot-Marie-Tooth Disease Pediatric Scale as an outcome measure of disability. Ann Neurol. 2012;71(5):642-652. [DOI] [PMC free article] [PubMed] [Google Scholar]
- 4.Patzko A, Shy M. Update on Charcot-Marie-Tooth disease. Curr Neurol Neurosci Rep. 2011;11(1):78-88. [DOI] [PMC free article] [PubMed] [Google Scholar]
- 5.Pareyson D, Saveri P, Pisciotta C. New developments in Charcot-Marie-Tooth neuropathy and related diseases. Curr Opin Neurol. 2017;30(5):471-480. [DOI] [PubMed] [Google Scholar]
- 6.Ursino G, Alberti MA, Grandis M, et al. Influence of comorbidities on the phenotype of patients affected by Charcot-Marie-Tooth neuropathy type 1A. Neuromuscul Disord. 2013;23(11):902-906. [DOI] [PubMed] [Google Scholar]
- 7.Steinberg N, Nemet D, Pantanowitz M, Eliakim A. Gait pattern, impact to the skeleton and postural balance in overweight and obese children: a review. Sports (Basel). 2018;6(3):75. [DOI] [PMC free article] [PubMed] [Google Scholar]
- 8.Rolland-Cachera MF, Sempé M, Guilloud-Bataille M, Patois E, Péquignot-Guggenbuhl F, Fautrad V. Adiposity indices in children. Am J Clin Nutr. 1982;36(1):178-183. [DOI] [PubMed] [Google Scholar]
- 9.Falaschetti E, Hingorani AD, Jones A, et al. Adiposity and cardiovascular risk factors in a large contemporary population of pre-pubertal children. Eur Heart J. 2010;31(24):3063-3072. [DOI] [PMC free article] [PubMed] [Google Scholar]
- 10.Herda TJ, Ryan ED, Kohlmeier M, Trevino MA, Gerstner GR, Roelofs EJ. Examination of muscle morphology and neuromuscular function in normal weight and overfat children aged 7-10 years. Scand J Med Sci Sports. 2018;28(11):2310-2321. [DOI] [PubMed] [Google Scholar]
- 11.O'Malley G, Hussey J, Roche E. A pilot study to profile the lower limb musculoskeletal health in children with obesity. Pediatr Phys Ther. 2012;24(3):292-298. [DOI] [PubMed] [Google Scholar]
- 12.Pessolano FA, Suarez AA, Monteiro SG, et al. Nutritional assessment of patients with neuromuscular diseases. Am J Phys Med Rehabil. 2003;83(3):182. [DOI] [PubMed] [Google Scholar]
- 13.Ramdharry GM, Pollard AJ, Grant R, et al. A study of physical activity comparing people with Charcot-Marie-Tooth disease to normal control subjects. Disabil Rehabil. 2017;39(17):1753-1758. [DOI] [PMC free article] [PubMed] [Google Scholar]
- 14.Kennedy RA, Carroll K, Paterson KL, et al. Physical activity of children and adolescents with Charcot-Marie-Tooth neuropathies: a cross-sectional case-controlled study. PLoS One. 2019;14(6):e0209628. [DOI] [PMC free article] [PubMed] [Google Scholar]
- 15.Mok E, Letellier G, Cuisset J-M, Denjean A, Gottrand F, Hankard R. Assessing change in body composition in children with Duchenne muscular dystrophy: anthropometry and bioelectrical impedance analysis versus dual-energy X-ray absorptiometry. Clin Nutr. 2010;29(5):633-638. [DOI] [PubMed] [Google Scholar]
- 16.Davidson ZE, Ryan MM, Kornberg AJ, et al. Observations of body mass index in Duchenne muscular dystrophy: a longitudinal study. Eur J Clin Nutr. 2014;68(8):892-897. [DOI] [PubMed] [Google Scholar]
- 17.Martigne LSJ, Mayer M, Cuisset J-M, et al. Natural evolution of weight status in Duchenne muscular dystrophy: a retrospective audit. Br J Nutr. 2011;105(10):1486-1491. [DOI] [PubMed] [Google Scholar]
- 18.Willig TNCL, Legrand M, Riviere H, Navarro J. Nutritional assessment in Duchenne muscular dystrophy. Dev Med Child Neurol. 1993;35(12):9. [DOI] [PubMed] [Google Scholar]
- 19.Davidson ZETH. A review of nutrition in Duchenne muscular dystrophy. J Hum Nutr Diet. 2009;22(5):383-393. [DOI] [PubMed] [Google Scholar]
- 20.Sproule DM, Montes J, Dunaway S, et al. Adiposity is increased among high-functioning, non-ambulatory patients with spinal muscular atrophy. Neuromuscul Disord. 2010;20(7):448-452. [DOI] [PMC free article] [PubMed] [Google Scholar]
- 21.Mehta NM, Newman H, Tarrant S, Graham RJ. Nutritional status and nutrient intake challenges in children with spinal muscular atrophy. Pediatr Neurol. 2016;57:80-83. [DOI] [PubMed] [Google Scholar]
- 22.Martinez EE, Quinn N, Arouchon K, et al. Comprehensive nutritional and metabolic assessment in patients with spinal muscular atrophy: opportunity for an individualized approach. Neuromuscul Disord. 2018;28(6):512-519. [DOI] [PubMed] [Google Scholar]
- 23.Moore GE, Lindenmayer AW, McConchie GA, Ryan MM, Davidson ZE. Describing nutrition in spinal muscular atrophy: a systematic review. Neuromuscul Disord. 2016;26(7):395-404. [DOI] [PubMed] [Google Scholar]
- 24.Lerner ZF, Shultz SP, Board WJ, Kung S, Browning RC. Does adiposity affect muscle function during walking in children? J Biomech. 2014;47(12):2975-2982. [DOI] [PubMed] [Google Scholar]
- 25.Kuczmarski RJ, Ogden CL, Guo SS, et al. 2000 CDC growth charts for the United States: methods and development. Vital Health Stat. 2002;11(246):1-190. [PubMed] [Google Scholar]
- 26.McKay M, Baldwin J, Ferreira P, Simic M, Vanicek N, Burns J. Normative Reference values for strength and flexibility of 1000 children and adults. Neurology. 2016;88(1):36-43. [DOI] [PMC free article] [PubMed] [Google Scholar]
- 27.Cole TJ, Lobstein T. Extended International (IOTF) Body Mass Index cut-offs for thinness, overweight and obesity. Paediatr Obes. 2012;7(4):284-294. [DOI] [PubMed] [Google Scholar]
- 28.Rolland-Cachera MF. Towards a simplified definition of childhood obesity? A focus on the extended IOTF references. Paediatr Obes. 2012;7(4):2. [DOI] [PubMed] [Google Scholar]
- 29.Li K, Haynie D, Palla H, Lipsky L, Iannotti R, Simons-Morton B. Assessment of adolescent weight status: similarities and differences between CDC, IOTF and WHO references. Prev Med. 2016;87:151-154. [DOI] [PMC free article] [PubMed] [Google Scholar]
- 30.Shields M, Tremblay MS. Canadian childhood obesity estimates based on WHO, IOTF and CDC cut-points. Int J Pediatr Obes. 2010;5(3):265-273. [DOI] [PubMed] [Google Scholar]
- 31.Keke LM, Samouda H, Jacobs J, et al. Body mass index and childhood obesity classification systems: a comparison of the French, International Obesity Task Force (IOTF) and World Health Organization (WHO) references. Rev Epidemiol Sante Publique. 2015;63(3):173-182. [DOI] [PubMed] [Google Scholar]
- 32.Darras B, Guye S, Hoffart J, et al. Distribution of weight and height in children and adolescents with spinal muscular atrophy: an observational retrospective study in the United States. Neuromuscul Disord. 2020;30:221954903. [DOI] [PMC free article] [PubMed] [Google Scholar]
- 33.Cornett K, Menezes M, Bray P, et al. Phenotypic variability of childhood Charcot-Marie-Tooth disease. JAMA Neurol. 2016;73(6):645-651. [DOI] [PMC free article] [PubMed] [Google Scholar]
- 34.Cornett K, Menezes M, Shy R, Moroni I, Pagliano E. Natural history of Charcot-Marie-Tooth disease during childhood. Ann Neurol. 2017;82(3):353-359. [DOI] [PMC free article] [PubMed] [Google Scholar]
- 35.de Onis M, O’nyango AW, Borghi E, Siyam A, Nishida C, Siekmann J. Development of a WHO growth reference for school-aged children and adolescents. Bull World Health Org. 2007;85(9):660-667. [DOI] [PMC free article] [PubMed] [Google Scholar]
- 36.Burns J, Bray P, Cross LA, North KN, Ryan MM, Ouvrier RA. Hand involvement in children with Charcot-Marie-Tooth disease type 1A. Neuromuscul Disord. 2008;18(12):970-973. [DOI] [PubMed] [Google Scholar]
- 37.Cornett KMD, Menezes MP, Bray P, Halaki M, Burns J. Established and novel measures of upper limb impairment in children with Charcot-Marie-Tooth disease type 1A and riboflavin transporter deficiency type 2. J Peripher Nervous Syst. 2018;23(1):29-35. [DOI] [PubMed] [Google Scholar]
- 38.Ervin RB, Fryar CD, Wang CY, Miller IM, Ogden CL. Strength and body weight in US children and adolescents. Pediatrics. 2014;134(3):e782-789. [DOI] [PMC free article] [PubMed] [Google Scholar]
- 39.Peterson MD, Gordon PM, Smeding S, Visich P. Grip strength is associated with longitudinal health maintenance and improvement in adolescents. J Pediatr. 2018;202:226-230. [DOI] [PubMed] [Google Scholar]
- 40.Lelijveld N, Seal A, Wells JC, et al. Chronic disease outcomes after severe acute malnutrition in Malawian children (ChroSAM): a cohort study. Lancet Glob Health. 2016;4(9):e654-e662. [DOI] [PMC free article] [PubMed] [Google Scholar]
- 41.Wells JCK. Body composition of children with moderate and severe undernutrition and after treatment: a narrative review. BMC Med. 2019;17(1):215. [DOI] [PMC free article] [PubMed] [Google Scholar]
- 42.Donini LMPE, Mosca V, Pinto A, Brunani A, Capodaglio P. Disability affects the 6-minute walking distance in obese subjects (BMI.40 kg/m2). PLoS One. 2013;8(10):e75491. [DOI] [PMC free article] [PubMed] [Google Scholar]
- 43.Calders P, Deforche B, Verschelde S, et al. Predictors of 6-minute walk test and 12-minute walk/run test in obese children and adolescents. Eur J Pediatr. 2008;167(5):563-568. [DOI] [PubMed] [Google Scholar]
- 44.Larsson UE, Reynisdottir S. The six-minute walk test in outpatients with obesity: reproducibility and known group validity. Physiother Res Int. 2008;13(2):84-93. [DOI] [PubMed] [Google Scholar]
- 45.McCorquodale D, Pucillo E, Johnson N. Management of Charcot-Marie-Tooth disease: improving long term care with multidisciplinary approach. J Multidisciplinary Healthc. 2016;9:7-19. [DOI] [PMC free article] [PubMed] [Google Scholar]
- 46.Aitkens S, Kilmer DD, Wright NC, McCrory MA. Metabolic syndrome in neuromuscular disease. Arch Phys Med Rehabil. 2005;86(5):1030-1036. [DOI] [PubMed] [Google Scholar]
- 47.Charakida M, Deanfield JE. BMI trajectories from childhood: the slippery slope to adult obesity and cardiovascular disease. Eur Heart J. 2018;39(24):2271-2273. [DOI] [PubMed] [Google Scholar]
- 48.Bellone S, Esposito S, Giglione E, et al. Vitamin D levels in a paediatric population of normal weight and obese subjects. J Endocrinol Invest. 2014;37(9):805-809. [DOI] [PubMed] [Google Scholar]
- 49.Hazell TJ, DeGuire JR, Weiler HA. Vitamin D: an overview of its role in skeletal muscle physiology in children and adolescents. Nutr Rev. 2012;70(9):520-533. [DOI] [PubMed] [Google Scholar]
- 50.Bhattoa HP, Konstantynowicz J, Laszcz N, Wojcik M, Pludowski P. Vitamin D: musculoskeletal health. Rev Endocr Metab Disord. 2016;18(3):363-371. [DOI] [PubMed] [Google Scholar]
Associated Data
This section collects any data citations, data availability statements, or supplementary materials included in this article.
Data Availability Statement
Any data not published within the article will be made available in anonymized form on request from any qualified investigator.