Abstract
Background and aims
Observational studies showed that coronavirus disease (2019) (COVID-19) attacks universally and its most menacing progression uniquely endangers the elderly with cardiovascular disease (CVD). The causal association between COVID-19 infection or its severity and susceptibility of atrial fibrillation (AF) remains unknown.
Methods and results
The bidirectional causal relationship between COVID-19 (including COVID-19, hospitalized COVID-19 compared with not hospitalized COVID-19, hospitalized COVID-19 compared with the general population, and severe COVID-19) and AF are determined by using two-sample Mendelian randomization (MR) analysis. Genetically predicted severe COVID-19 was not significantly associated with the risk of AF [odds ratio (OR), 1.037; 95% confidence interval (CI), 1.005–1.071; P = 0.023, q = 0.115]. In addition, genetically predicted AF was also not causally associated with severe COVID-19 (OR, 0.993; 95% CI, 0.888–1.111; P = 0.905, q = 0.905). There was no evidence to support the association between genetically determined COVID-19 and the risk of AF (OR, 1.111; 95% CI, 0.971–1.272; P = 0.127, q = 0.318), and vice versa (OR, 1.016; 95% CI, 0.976–1.058; P = 0.430, q = 0.851). Besides, no significant association was observed for hospitalized COVID-19 with AF. MR-Egger analysis indicated no evidence of directional pleiotropy.
Conclusion
Overall, this MR study provides no clear evidence that COVID-19 is causally associated with the risk of AF.
Keywords: Coronavirus disease 2019, Atrial fibrillation, Bidirectional Mendelian randomization
1. Introduction
Coronavirus disease (COVID-19), which is caused by the severe acute respiratory syndrome coronavirus 2 (SARS-COV2) and represents the causative agent of a potentially fatal disease, rapidly emerged as a global pandemic and afflicted global finances and healthcare systems severely [1]. The virus attacks universally, with the elderly being the most vulnerable to this disease, especially those with cardiovascular comorbidities such as diabetes mellitus, hypertension, heart failure, and coronary heart disease [2,3]. Atrial fibrillation (AF) is the most common cardiac arrhythmia worldwide, and its prevalence is higher in patients with other comorbidities [4].
COVID-19 may have an adverse impact on the heart and cardiovascular system. AF is a frequent clinical manifestation in hospitalized COVID-19 patients who require admission to an intensive care unit [5]. In addition, recent studies have found that SARS-COV2 infection may damage cardiomyocytes and increase the risk of AF [[6], [7], [8]]. However, these findings are still susceptible to unmeasured confounders and reverse causation that cannot be fully ruled out in observational studies. Further investigation is needed to determine the causal association between COVID-19 and AF.
Mendelian randomization (MR) is a burgeoning field that utilizes genetic variants that are robustly associated with such modifiable exposures to generate more reliable evidence [9]. This approach relies on the natural, random assortment of genetic variants during meiosis yielding a random distribution of genetic variants [10]. Genome-wide association studies (GWAS) data, which typically provide regression coefficients summarizing the associations of many genetic variants with various traits, are potentially a powerful source of data for MR analysis [11]. Therefore, we performed bidirectional MR analyses for determining the causal relationship between COVID-19 (including COVID-19, hospitalized COVID-19 compared with not hospitalized COVID-19, hospitalized COVID-19 compared with the general population and severe COVID-19) and AF using summary statistics results of GWAS. Understanding the bidirectional relationship between COVID-19 and AF is of significant public health importance about disease prevention and complications management.
2. Methods
2.1. Data sources
2.1.1. Genetic association datasets for COVID-19
Summary genetic association estimates for the risk of COVID-19 were obtained from the most recent version of GWAS analyses of the COVID-19 host genetics initiative in UK Biobank individuals released on January 18, 2021 (https://www.covid19hg.org/results/) [12]. We selected four phenotypes from this GWAS: (1) COVID-19 patients vs. the general population including 38,984 patients and 1,644,784 control participants; (2) hospitalized COVID-19 patients vs. not hospitalized COVID-19 patients including 3159 patients and 7206 control participants; (3) hospitalized COVID-19 patients vs. the general population including 9986 patients and 1,877,672 control participants; and (4) patients with very severe respiratory confirmed COVID-19 vs. the general population including 5101 patients and 1,383,241 control participants. All COVID-19-related GWAS summary statistic data were based on the European ancestry population.
2.1.2. Genetic association datasets for AF
We drew on summary statistics from a recent meta-analysis of GWAS in 31 studies of AF, which were included 18,398 patients and 91,536 control participants [13]. The majority of the study participants were of European ancestry. Details on genotype-quality control and adjudication of AF can be found elsewhere [13].
2.2. Instrumental variables for COVID-19 and AF
We first performed forward MR analysis to assess the effects of the phenotypes of COVID-19, hospitalized COVID-19 compared with not hospitalized COVID-19, hospitalized COVID-19 compared with the general population, and severe COVID-19 on AF by using genetic variants associated with exposure as instrumental variables (IVs). Since a few significant single nucleotide polymorphisms (SNPs) of COVID-19 were available using the criterion of P < 5 × 10⁻⁸, SNPs were selected as IVs at P < 1 × 10⁻⁵ for COVID-19. Then, we conducted reverse MR using genetic variants associated with AF as IVs to investigate its effect on COVID-19. SNPs that achieved significance (P < 5 × 10⁻⁸) for AF were selected as IVs.
We only retained independent variants from each other based on the European ancestry reference data from the 1000 Genomes Project (Linkage disequilibrium [LD], r 2 threshold = 0.001). The phenotypic variance (R 2) explained by the selected SNPs was about 0.14% for COVID-19, 3.20% for hospitalized COVID-19 compared with not hospitalized COVID-19, 0.49% for hospitalized COVID-19 compared with the general population, 1.08% for severe COVID-19, and 0.58% for AF, respectively. For each selected IV, R 2 was calculated using the formula: R 2 = 2 × β 2 × MAF × (1-MAF) (MAF represented the minor allele frequency and β represented the effect estimate of the genetic variant) [14].
2.3. MR analysis
The inverse variance-weighted (IVW) method was employed as the main analysis for estimating the causal effect combining the ratio estimates using each variant in the multiplicative random-effects model [11]. Results can be biased if IVs show horizontal pleiotropy, affecting the outcome through pathways other than the exposure, which could violate MR assumptions [15]. Therefore, four sensitivity analyses were performed including the weighted median (WM), penalised weighted median (PWM), Pleiotropy Residual Sum and Outlier (MR-PRESSO) and MR-Egger regression. The WM method, which selects the median MR estimate as the causal estimate, may provide precise causal estimates against invalid instruments [16]. MR-PRESSO was applied to detect and correct for any outliers reflecting the likely pleiotropic effect for all reported results [17]. We conducted MR-Egger analysis, which allows the intercept to be freely assessed as an indicator of average pleiotropic effect [15]. In order to assess the robustness of the significant results, we further applied the Cochran's Q statistic to detect heterogeneity among the Wald ratios for each SNP for identifying the presence of horizontal pleiotropy [18]. Leave-one-out analysis was conducted to assess the undue influence of potentially pleiotropic SNPs on the causal estimates [18]. Results are presented as odds ratios (ORs) with 95% confidence intervals (95% CIs). For the multiple corrections, the false discovery rate (FDR) was used based on the Benjamini–Hochberg procedure (q) [19].
For bidirectional MR analyses, the causal relationships between COVID-19 and AF were delineated into four potential parts. Fig. 1 showed an overview of the bidirectional MR study to investigate these explanations. If the P value was less than 0.05 only in forward MR for Explanation 1, there was a significant association of genetically instrumented COVID-19 with higher AF risk. Then we conducted the reverse MR analysis assessing whether AF affected COVID-19. This reverse causal association was observed if the P value was less than 0.05 in Explanation 2. Explanation 3 showed that there was bidirectional causality between COVID-19 and AF (P < 0.05). There was no causal association in forward and reverse MR (P > 0.05), as shown in Explanation 4.
Fig. 1.
Analyses pipeline to evaluate the explanations for the observed associations between COVID-19 and AF. COVID-19: Coronavirus disease 2019; AF: Atrial fibrillation; MR: Mendelian randomization; SNP: Single nucleotide polymorphism.
All data analyses for MR were conducted using “TwoSampleMR” package (Version 0.5.4) and “MR-PRESSO” package (Version 1.0) in the R environment (R version 4.0.4, R Project for Statistical Computing). This package harmonizes exposure and outcome data sets including information on SNPs, alleles, effect sizes, standard errors, P values, and effect allele frequencies for the selected exposure instruments.
3. Results
3.1. Causal effect of COVID-19 on AF via forward MR
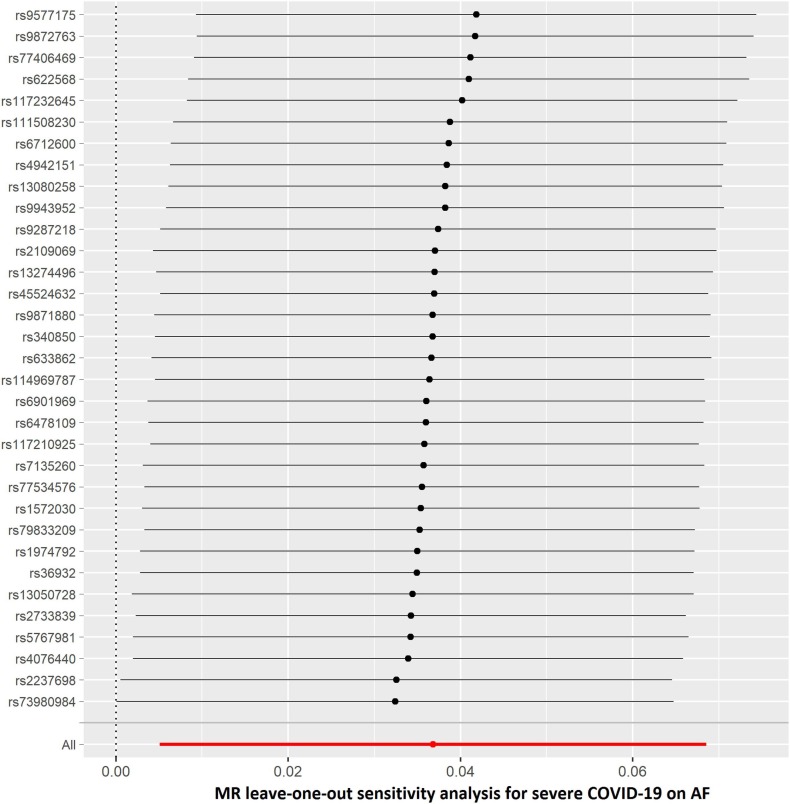
The summary genetic association data were reported in Supplementary Table 1. In the forward MR analysis, we used 29 independent SNPs as IVs for COVID-19. As shown in Table 1 , the IVW estimate showed that there was no association between the genetically instrumented COVID-19 and AF risk (OR, 1.111; 95% CI, 0.971–1.272; P = 0.127, q = 0.318), with heterogeneity (P = 0.007) across instrument SNP effects. The MR Egger intercept test further indicated no directional pleiotropy (P = 0.702). In addition, by using the IVW method, the genetic predisposition of hospitalized COVID-19 patients compared with not hospitalized COVID-19 patients and the general population was not observed to be statistically significantly associated with AF (OR = 0.991; 95% CI, 0.941–1.044; OR = 1.055; 95% CI, 0.995–1.119, respectively). The lack of causal association remained in all sensitivity analyses (Table 1). Of note, there was no association of the genetically instrumented severe COVID-19 with AF using 33 SNPs presented in Table 1 (OR, 1.037; 95% CI, 1.005–1.071; P = 0.023, q = 0.115), without directional pleiotropy (P = 0.996) and heterogeneity (P = 0.699).
Table 1.
Causal association of COVID-19 with AF via forward MR analyses.
| Phenotype | Numbers of SNPs | OR (95% CI) | Beta (SE) | P | q |
|---|---|---|---|---|---|
| COVID-19 vs. population | |||||
| IVW | 29 | 1.111 (0.971–1.272) | 0.106 (0.069) | 0.127 | 0.318 |
| Weighted median | 29 | 1.011 (0.861–1.186) | 0.010 (0.082) | 0.898 | 0.924 |
| Penalised weighted median | 29 | 1.008 (0.857–1.186) | 0.008 (0.083) | 0.924 | 0.924 |
| MR-PRESSO | 29 | −0.103 (0.061) | 0.103 | 0.318 | |
| MR-Egger | 29 | 1.196 (0.805–1.775) | 0.179 (0.202) | 0.383 | 0.638 |
| egger_intercept | −0.006 | 0.702 | |||
| Q statistic | – | 0.007 | |||
| Hospitalized COVID-19 vs. not hospitalized COVID-19 | |||||
| IVW | 20 | 0.991 (0.941–1.044) | −0.009 (0.027) | 0.730 | 0.730 |
| Weighted median | 20 | 1.014 (0.952–1.081) | 0.014 (0.032) | 0.665 | 0.730 |
| Penalised weighted median | 20 | 1.015 (0.950–1.085) | 0.015 (0.034) | 0.655 | 0.730 |
| MR-PRESSO | 20 | −0.018 (0.026) | 0.514 | 0.730 | |
| MR-Egger | 20 | 0.952 (0.838–1.082) | −0.049 (0.065) | 0.462 | 0.730 |
| egger_intercept | 0.010 | 0.511 | |||
| Q statistic | 0.080 | ||||
| Hospitalized COVID-19 vs. population | |||||
| IVW | 32 | 1.055 (0.995–1.119) | 0.054 (0.030) | 0.075 | 0.125 |
| Weighted median | 32 | 1.076 (0.996–1.163) | 0.073 (0.040) | 0.065 | 0.125 |
| Penalised weighted median | 32 | 1.080 (1.001–1.166) | 0.077 (0.039) | 0.048 | 0.125 |
| MR-PRESSO | 32 | 0.035 (0.029) | 0.246 | 0.308 | |
| MR-Egger | 32 | 0.963 (0.808–1.149) | −0.038 (0.090) | 0.679 | 0.679 |
| egger_intercept | 0.012 | 0.290 | |||
| Q statistic | 0.055 | ||||
| Severe respiratory confirmed COVID-19 vs. population | |||||
| IVW | 33 | 1.037 (1.005–1.071) | 0.037 (0.016) | 0.023 | 0.115 |
| Weighted median | 33 | 1.039 (0.994–1.086) | 0.038 (0.022) | 0.092 | 0.153 |
| Penalised weighted median | 33 | 1.039 (0.995–1.085) | 0.038 (0.022) | 0.081 | 0.153 |
| MR-Egger | 33 | 1.038 (0.920–1.171) | 0.037 (0.062) | 0.551 | 0.551 |
| egger_intercept | −6.66e-05 | 0.996 | |||
| Q statistic | 0.699 | ||||
| MR-PRESSO | 33 | −0.023 (0.016) | 0.151 | 0.189 | |
Beta is the estimated effect size. P < 0.05 was considered statistically significant.
AF: Atrial fibrillation; CI: confidence interval; IVs: instrumental variables; IVW: inverse-variance weighted; MR: Mendelian randomization; MR-PRESSO: Pleiotropy Residual Sum and Outlier; OR: odds ratio; SE: standard error; SNP: single-nucleotide polymorphism.
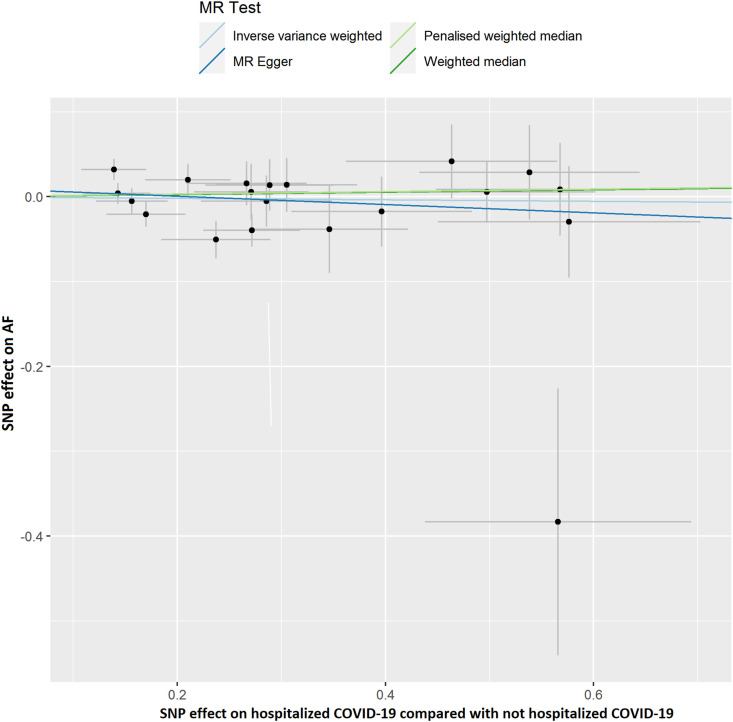
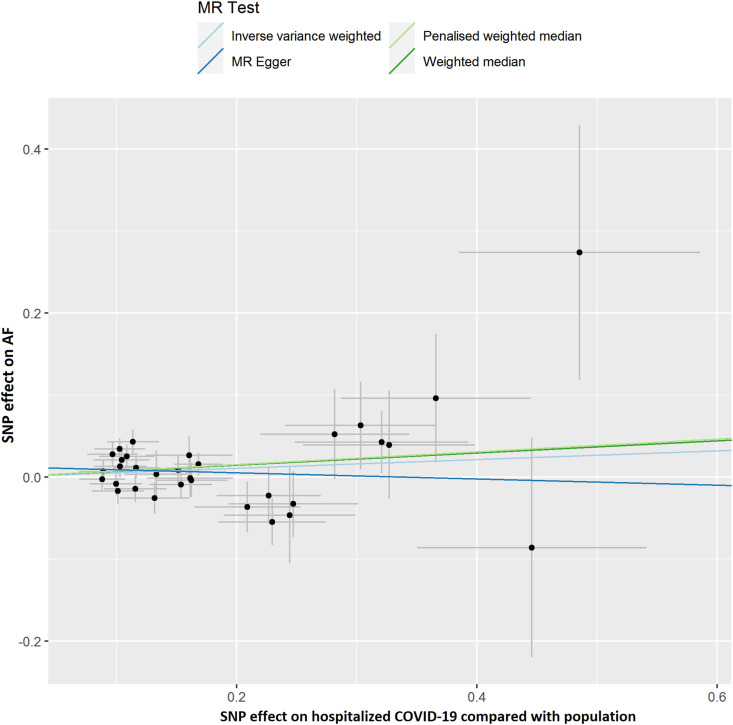
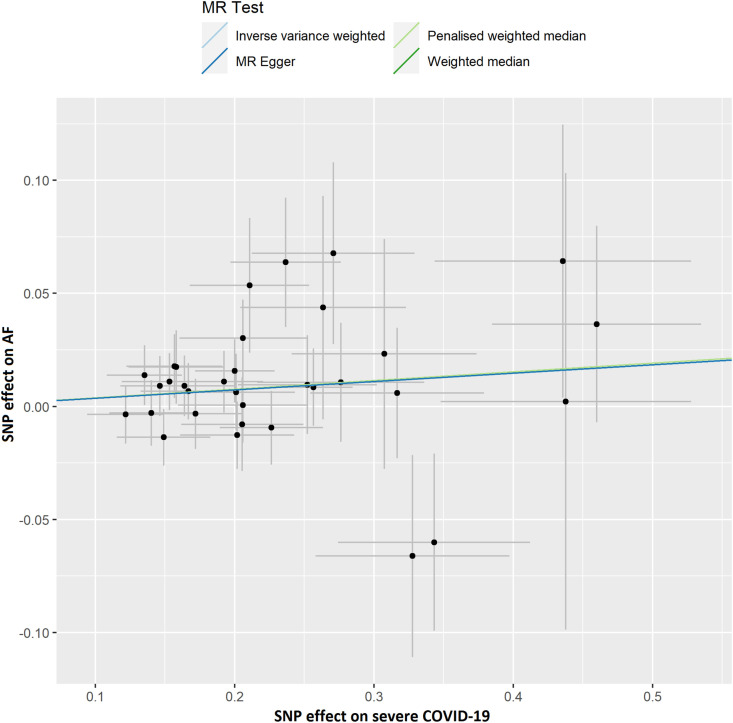
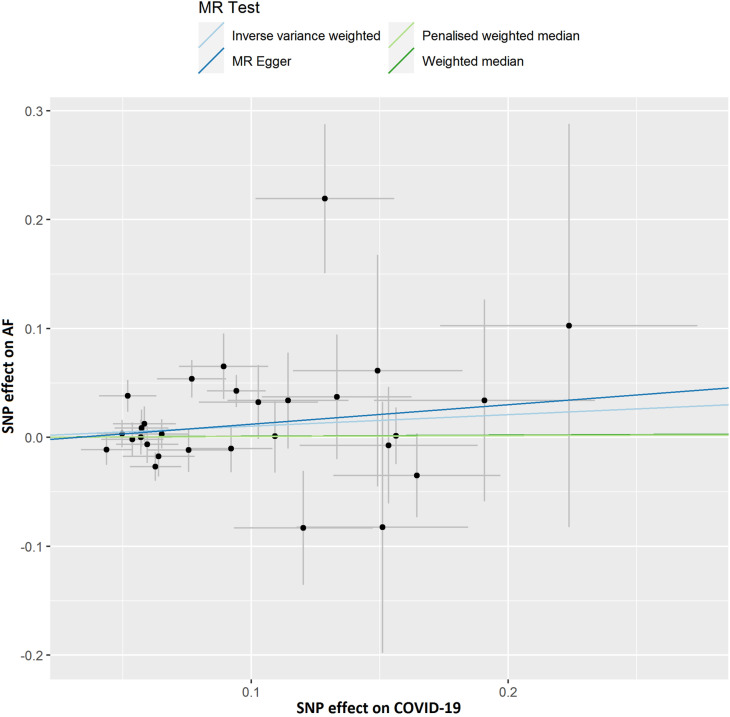
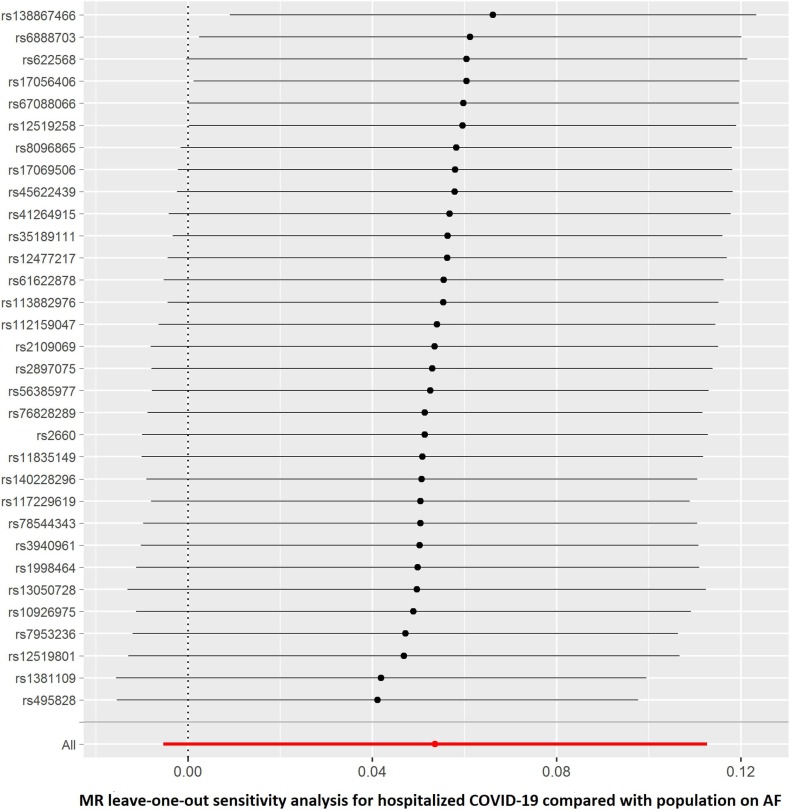
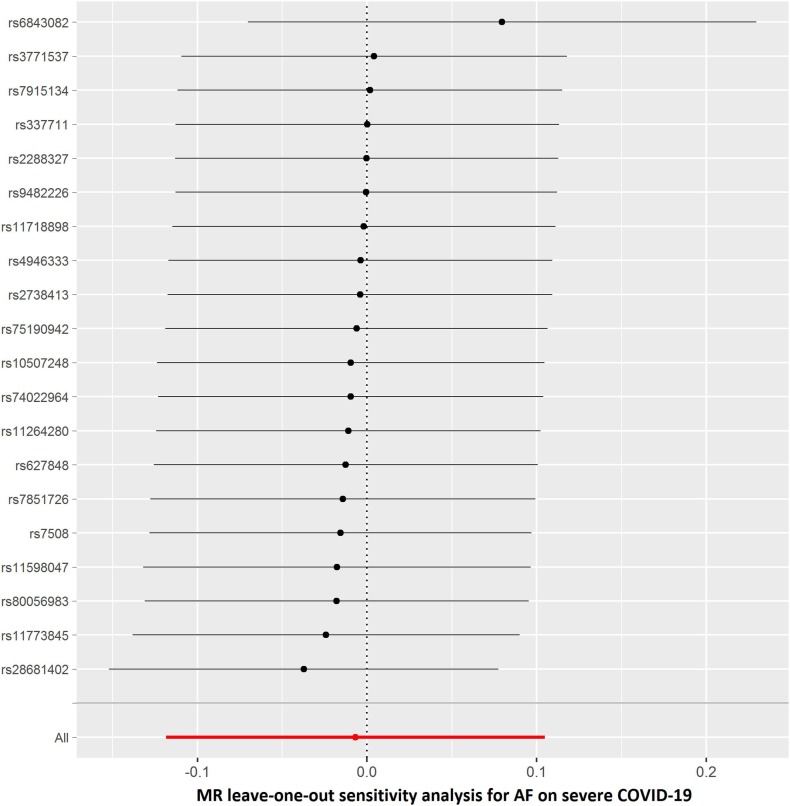
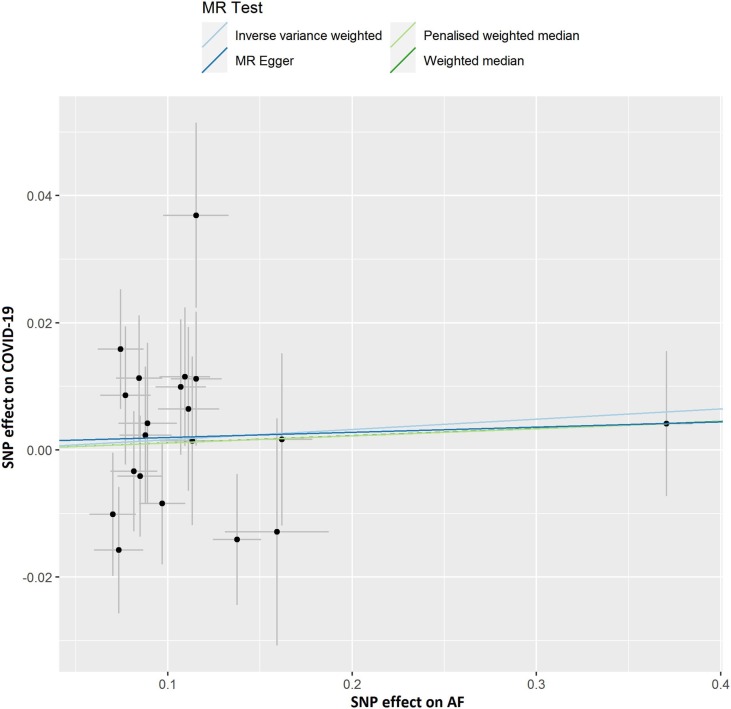
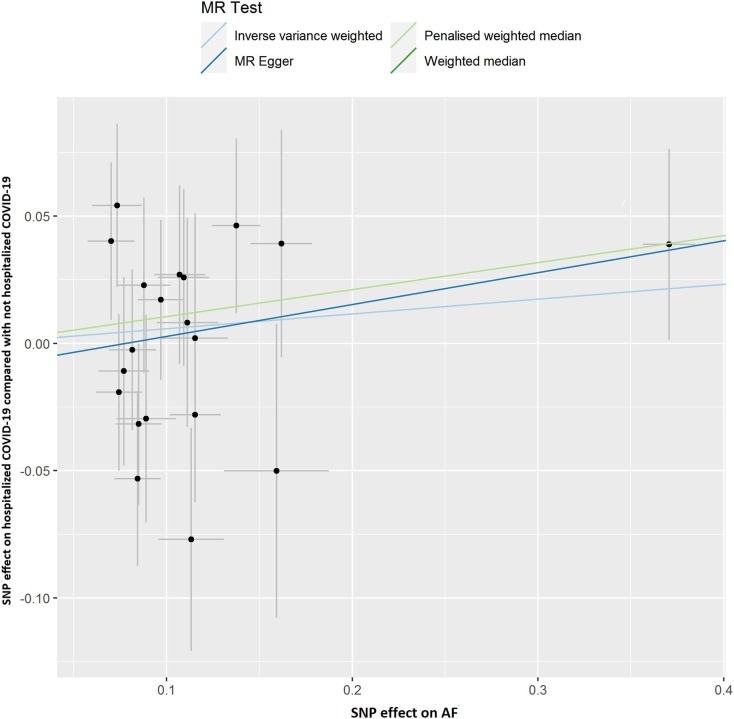
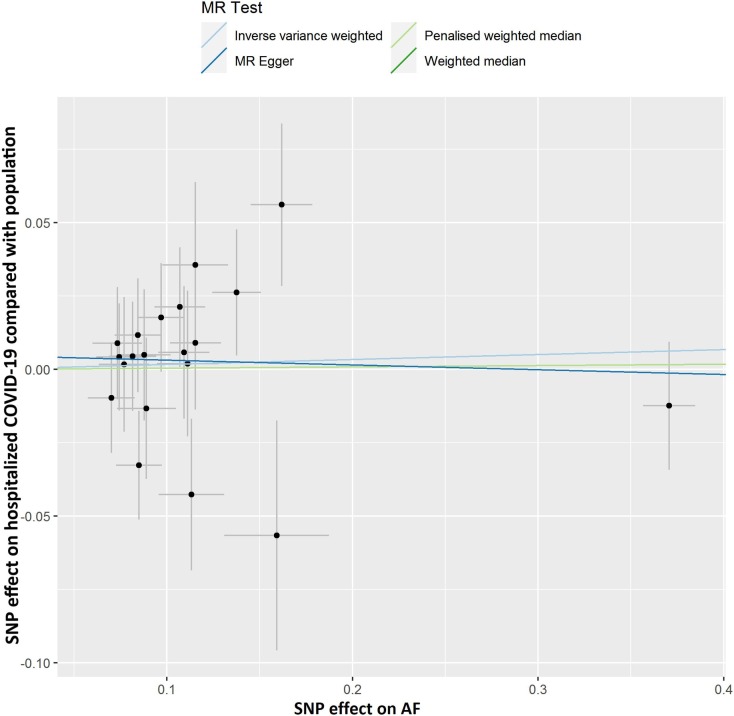
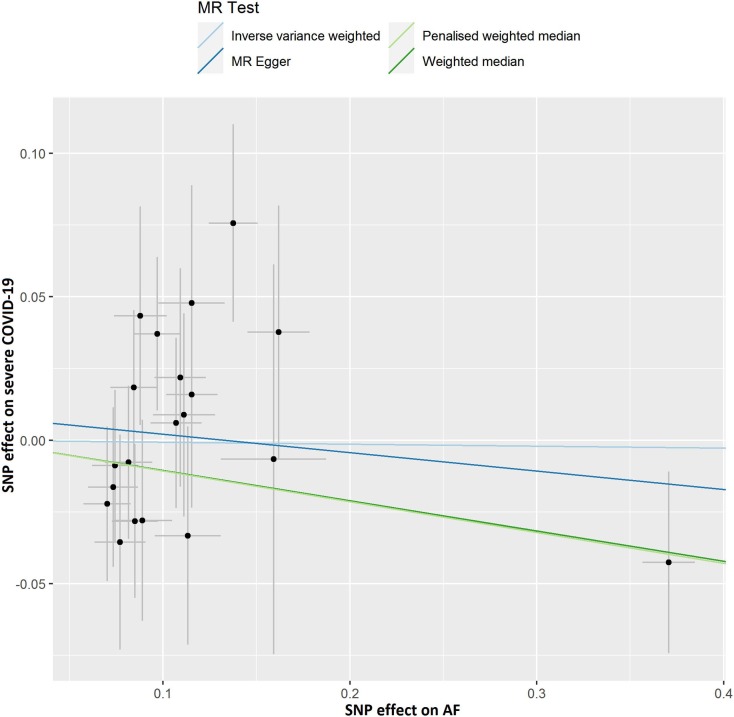
The results of leave-one-out sensitivity analyses showed that the causal associations between genetically instrumented COVID-19 phenotypes and AF were not substantially driven by any individual SNP (Supplementary Figures. 1A–D). Fig. 2B, Fig. 2C, Fig. 2D, Fig. 2A A, B, C and D presented the causal effect of the phenotypes of COVID-19 on AF, in which the regression slopes of the lines corresponded to the causal estimates using each of the four different methods.
Fig. 2B.
Scatter plot showing the associations of the SNP effects on hospitalized COVID-19 compared with not hospitalized COVID-19 against the SNP effects on AF. Circles indicate marginal genetic associations with hospitalized COVID-19 and risk of AF for each variant. Error bars indicate 95% CIs. COVID-19: Coronavirus disease 2019; AF: Atrial fibrillation; MR: Mendelian randomization; SNP: Single nucleotide polymorphism.
Fig. 2C.
Scatter plot showing the associations of the SNP effects on hospitalized COVID-19 compared with population against the SNP effects on AF. Circles indicate marginal genetic associations with hospitalized COVID-19 and risk of AF for each variant. Error bars indicate 95% CIs. COVID-19: Coronavirus disease 2019; AF: Atrial fibrillation; MR: Mendelian randomization; SNP: Single nucleotide polymorphism.
Fig. 2D.
Scatter plot showing the associations of the SNP effects on severe COVID-19 against the SNP effects on AF. Circles indicate marginal genetic associations with severe COVID-19 and the risk of AF for each variant. Error bars indicate 95% CIs. COVID-19: Coronavirus disease 2019; AF: Atrial fibrillation; MR: Mendelian randomization; SNP: Single nucleotide polymorphism.
Fig. 2A.
Scatter plot showing the associations of the SNP effects on COVID-19 against the SNP effects on AF. Circles indicate marginal genetic associations with COVID-19 and risk of AF for each variant. Error bars indicate 95% CIs. COVID-19: Coronavirus disease 2019; AF: Atrial fibrillation; MR: Mendelian randomization; SNP: Single nucleotide polymorphism.
3.2. Causal association of AF with COVID-19 via reverse MR
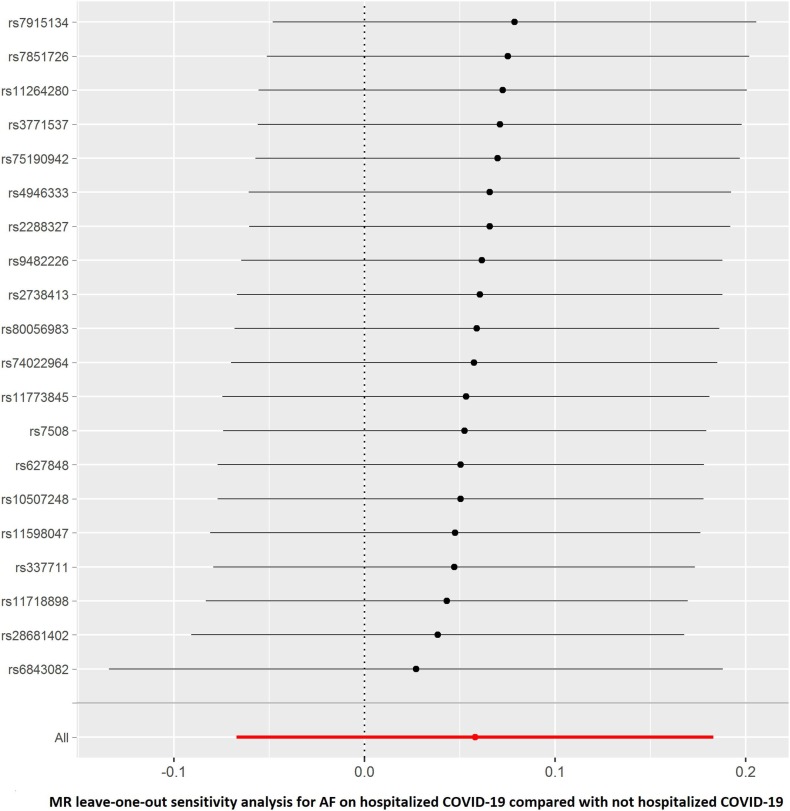
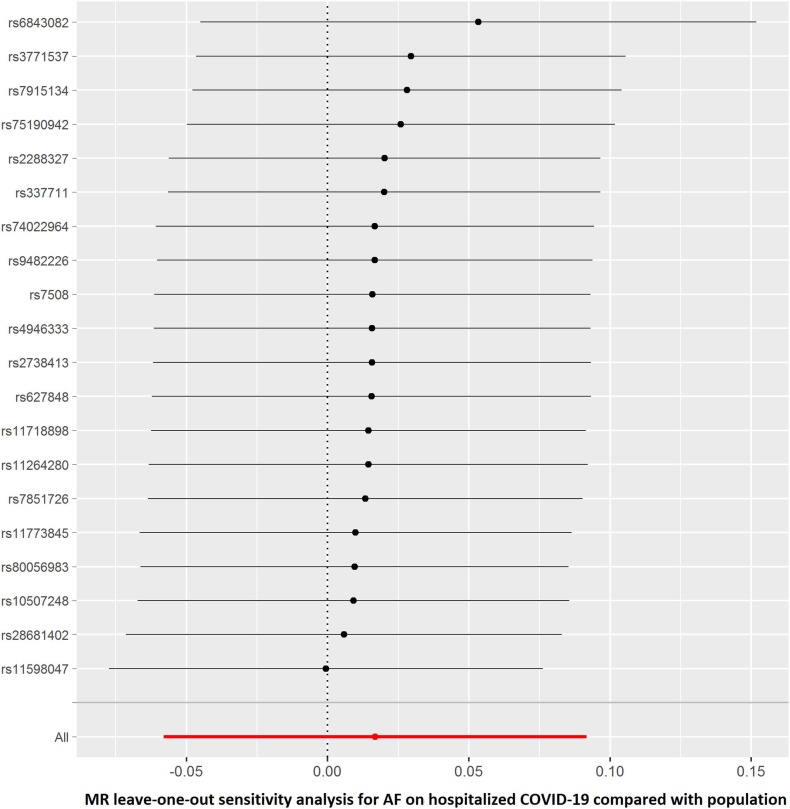
The summary genetic association data of AF were reported in Supplementary Table 1. As shown in Table 2 , the reverse MR analysis showed no statistically significant evidence of a relationship between AF and COVID-19 (OR, 1.016; 95% CI, 0.976–1.058; P = 0.430, q = 0.851), hospitalized COVID-19 compared with not hospitalized COVID-19 (OR, 1.060; 95% CI, 0.935–1.201; P = 0.363, q = 0.453), hospitalized COVID-19 compared with the general population (OR, 1.017; 95% CI, 0.944–1.096; P = 0.661, q = 0.935), and severe COVID-19 (OR, 0.993; 95% CI, 0.888–1.111; P = 0.905, q = 0.905). Similar results were found in the sensitivity analyses. There was no heterogeneity and directional pleiotropy based on the Q test and MR-Egger intercept test for the associations of AF with COVID-19, hospitalized COVID-19 compared with not hospitalized COVID-19, hospitalized COVID-19 compared with the general population, and severe COVID-19. The results of leave-one-out sensitivity analysis showed that the association between genetically instrumented AF with COVID-19, hospitalized COVID-19 compared with not hospitalized COVID-19, and hospitalized COVID-19 compared with the general population was not substantially driven by any individual SNP, except rs6843082 in phenotypes for hospitalized COVID-19 compared with the general population as well as severe COVID-19 (Supplementary Figures. 1E–H)figs5, figs6, figs7, figs8. The relationship between the effect sizes of the SNP–AF association and the SNP–the phenotypes of COVID-19 associations are presented in Supplementary Figures. 2A–D.
Table 2.
Causal association of AF with COVID-19 via reverse MR analyses.
| Phenotype | Numbers of SNPs | OR (95% CI) | Beta (SE) | P | q |
|---|---|---|---|---|---|
| COVID-19 vs. population | |||||
| IVW | 20 | 1.016 (0.976–1.058) | 0.016 (0.021) | 0.430 | 0.851 |
| Weighted median | 20 | 1.011 (0.960–1.066) | 0.011 (0.027) | 0.675 | 0.851 |
| Penalised weighted median | 20 | 1.011 (0.957–1.068) | 0.011 (0.028) | 0.689 | 0.851 |
| MR-PRESSO | 20 | 0.020 (0.020) | 0.346 | 0.851 | |
| MR-Egger | 20 | 1.008 (0.927–1.097) | 0.008 (0.043) | 0.851 | 0.851 |
| egger_intercept | 0.001 | 0.833 | |||
| Q statistic | 0.322 | ||||
| Hospitalized COVID-19 vs. not hospitalized COVID-19 | |||||
| IVW | 20 | 1.060 (0.935–1.201) | 0.058 (0.064) | 0.363 | 0.453 |
| Weighted median | 20 | 1.112 (0.937–1.319) | 0.106 (0.087) | 0.224 | 0.453 |
| Penalised weighted median | 20 | 1.112 (0.933–1.325) | 0.106 (0.089) | 0.236 | 0.453 |
| MR-PRESSO | 20 | 0.041 (0.063) | 0.521 | 0.521 | |
| MR-Egger | 20 | 1.133 (0.878–1.463) | 0.125 (0.130) | 0.350 | 0.453 |
| egger_intercept | −0.010 | 0.562 | |||
| Q statistic | 0.509 | ||||
| Hospitalized COVID-19 vs. population | |||||
| IVW | 20 | 1.017 (0.944–1.096) | 0.017 (0.038) | 0.661 | 0.935 |
| Weighted median | 20 | 1.004 (0.906–1.113) | 0.004 (0.053) | 0.935 | 0.935 |
| Penalised weighted median | 20 | 1.004 (0.907–1.112) | 0.004 (0.052) | 0.934 | 0.935 |
| MR-PRESSO | 20 | −0.030 (0.038) | 0.429 | 0.935 | |
| MR-Egger | 20 | 0.984 (0.845–1.145) | −0.016 (0.077) | 0.836 | 0.935 |
| egger_intercept | 0.005 | 0.628 | |||
| Q statistic | 0.472 | ||||
| Severe respiratory confirmed COVID-19 vs. population | |||||
| IVW | 20 | 0.993 (0.888–1.111) | −0.007 (0.057) | 0.905 | 0.905 |
| Weighted median | 20 | 0.900 (0.775–1.045) | −0.105 (0.076) | 0.167 | 0.465 |
| Penalised weighted median | 20 | 0.898 (0.767–1.053) | −0.107 (0.081) | 0.186 | 0.465 |
| MR-PRESSO | 20 | −0.029 (0.054) | 0.605 | 0.756 | |
| MR-Egger | 20 | 0.938 (0.754–1.167) | −0.064 (0.111) | 0.571 | 0.756 |
| egger_intercept | 0.009 | 0.556 | |||
| Q statistic | 0.547 | ||||
Beta is the estimated effect size. P < 0.05 was considered statistically significant.
AF: Atrial fibrillation; CI: confidence interval; IVs: instrumental variables; IVW: inverse-variance weighted; MR: Mendelian randomization; MR-PRESSO: Pleiotropy Residual Sum and Outlier; OR: odds ratio; SE: standard error; SNP: single-nucleotide polymorphism.
4. Discussion
To the best of our knowledge, this is the first study to investigate the causal relationship between COVID-19 and AF using a bidirectional two-sample MR in the European population. In the present study, using publicly available summary statistics data, no strong evidence was found to indicate associations between COVID-19, hospitalized COVID-19 compared with not hospitalized COVID-19, hospitalized COVID-19 compared with the general population, and severe COVID-19 and the risk of AF. Furthermore, there was no MR evidence indicating that genetic liability to AF increases the risk of critical COVID-19. The findings were overall robust in the sensitivity analyses.
To date, studies investigating the associations between COVID-19 and AF have reported inconsistent results. Our study showed a suggestive significance of severe COVID-19 on AF. However, this slight association disappeared after correction for multiple testing. Consistent with our results, AF is likely the consequence of systemic illness and not solely the direct effect of COVID-19 infection [20]. However, some previous conventional studies have reported a direct association between COVID-19 and the enhanced risk of AF [21]. In further population-based studies with a cohort design, even after adjustment for age, hypertension, coronary artery disease, cerebrovascular disease, and diabetes and so on, it is difficult to assess the causal relationship between the traits due to the effect of unmeasured confounders [22]. The discrepancy between the results of our study and the observational study may be attributed to the unmeasured confounders in the observational study.
Since the cause of the ongoing COVID-19 pandemic, SARSCoV-2 invades host cells by attaching to the membrane bound angiotensin-converting enzyme 2 (ACE2) [23]. ACE2 shares similarities with its protein homolog angiotensin-converting enzyme (ACE) and plays a role in the renin–angiotensin–aldosterone system (RAAS) [24]. Previous studies also found that ACE 2 activity may be related to AF [25,26]. The reason is that ACE2 might be a functional receptor and cellular entry point for SARS-CoV-2 to invade target cardiac cells [[27], [28], [29], [30]]. Our results are inconsistent with the above mechanism hypothesis. Further research is required to clarify these results using animal models in the laboratory.
In our analysis, we did not find any associations between AF and COVID-19. However, it is not clear whether AF would contribute to increasing the risk for worse prognosis, or even higher mortality of COVID-19.
Our MR study has several strengths. First, MR analysis is a genetic epidemiology method that uses genetic determinants of the exposure (COVID-19) to understand the effect of the exposure on the outcome (AF), which can control the potential bias. Genetic variation is not associated with confounding factors, such as age, hypertension, and cerebrovascular disease, which may affect observational studies [31]. Besides, MR analysis can avoid reverse causation since genetic variation is allocated at conception. Lastly, the MR analysis design is less susceptible to potential unmeasured confounding and reverse causation and can strengthen the evidence for causal inference [31].
The limitations of the current study should be addressed. First, due to the limitation of data resource, stratified analyses or analyses adjusted for other covariates were impossible. Second, estimates of SNP-AF association were derived from transancestry studies, which might cause bias in terms of population admixture. The same genetic variants could show different effects for different populations. However, this might have a slight effect on the estimates because the majority of the individuals were of European ancestry. Third, we cannot exclude that our findings might have been affected by weak instrument bias, which depends on the selection of the genetic instrument through the threshold of P = 1 × 10⁻⁵ for phenotypes of COVID-19. Finally, this MR study failed to detect the causal associations due to very large sample sizes, which is limited by a small fraction of the variation in the phenotypes of COVID-19 explained by SNPs (1%).
5. Conclusions
Our MR study suggested that there was no evidence to support the causal relationship between COVID-19 and AF. Further research is required to clarify these findings through the use of larger samples of the European ancestry.
Declaration of competing interest
The authors report no relationships that could be construed as a conflict of interest.
Acknowledgments
This work was supported by grants from the Application and Evaluation of Active Health Cloud Platform in China, National Key R&D Program of China (2018YFC2000704), and the China-Australian Collaborative Grant (NSFC 81561128020-NHMRC APP1112767).
Handling Editor: A. Siani
Footnotes
Supplementary data to this article can be found online at https://doi.org/10.1016/j.numecd.2021.11.010.
Appendix A. Supplementary data
The following are the Supplementary data to this article:
figs1.
figs2.
figs3.
figs4.
figs5.
figs6.
figs7.
figs8.
figs9.
figs10.
figs11.
figs12.
References
- 1.Dong E., Du H., Gardner L. An interactive web-based dashboard to track COVID-19 in real time. Lancet Infect Dis. 2020;20:533–534. doi: 10.1016/S1473-3099(20)30120-1. [DOI] [PMC free article] [PubMed] [Google Scholar]
- 2.Mehra M.R., Ruschitzka F. COVID-19 illness and heart failure: a missing link? JACC Heart Fail. 2020;8:512–514. doi: 10.1016/j.jchf.2020.03.004. [DOI] [PMC free article] [PubMed] [Google Scholar]
- 3.Li G., Hu R., Gu X. A close-up on COVID-19 and cardiovascular diseases. Nutrition, metabolism, and cardiovascular diseases. NMCD. 2020;30:1057–1060. doi: 10.1016/j.numecd.2020.04.001. [DOI] [PMC free article] [PubMed] [Google Scholar]
- 4.Hindricks G., Potpara T., Dagres N., Arbelo E., Bax J.J., Blomström-Lundqvist C., et al. 2020 ESC Guidelines for the diagnosis and management of atrial fibrillation developed in collaboration with the European Association for Cardio-Thoracic Surgery (EACTS) Eur Heart J. 2021;42:373–498. doi: 10.1093/eurheartj/ehaa612. [DOI] [PubMed] [Google Scholar]
- 5.Colon C.M., Barrios J.G., Chiles J.W., McElwee S.K., Russell D.W., Maddox W.R., et al. Atrial arrhythmias in COVID-19 patients. JACC Clin Electrophysiol. 2020;6:1189–1190. doi: 10.1016/j.jacep.2020.05.015. [DOI] [PMC free article] [PubMed] [Google Scholar]
- 6.Bhatla A., Mayer M.M., Adusumalli S., Hyman M.C., Oh E., Tierney A., et al. COVID-19 and cardiac arrhythmias. Heart Rhythm. 2020 doi: 10.1016/j.hrthm.2020.06.016. LID - S1547-5271(20)30594-4 [pii] LID - [doi] [DOI] [PMC free article] [PubMed] [Google Scholar]
- 7.Tomasoni D., Italia L., Adamo M., Inciardi R.M., Lombardi C.M., Solomon S.D., et al. COVID-19 and heart failure: from infection to inflammation and angiotensin II stimulation. Searching for evidence from a new disease. Eur J Heart Fail. 2020;22(6) doi: 10.1002/ejhf.1871. [DOI] [PMC free article] [PubMed] [Google Scholar]
- 8.Angeli F., Spanevello A., De Ponti R., Visca D., Marazzato J., Palmiotto G., et al. Electrocardiographic features of patients with COVID-19 pneumonia. Eur J Intern Med. 2020;78:101–106. doi: 10.1016/j.ejim.2020.06.015. [DOI] [PMC free article] [PubMed] [Google Scholar]
- 9.Sekula P., Del Greco M.F., Pattaro C., Köttgen A. Mendelian randomization as an approach to assess causality using observational data. J Am Soc Nephrol. 2016;27:3253–3265. doi: 10.1681/ASN.2016010098. [DOI] [PMC free article] [PubMed] [Google Scholar]
- 10.Emdin C.A., Khera A.V., Kathiresan S. Mendelian Randomization. JAMA. 2017;318:1925–1926. doi: 10.1001/jama.2017.17219. [DOI] [PubMed] [Google Scholar]
- 11.Burgess S., Butterworth A., Thompson S.G. Mendelian randomization analysis with multiple genetic variants using summarized data. Genet Epidemiol. 2013;37:658–665. doi: 10.1002/gepi.21758. [DOI] [PMC free article] [PubMed] [Google Scholar]
- 12.The COVID-19 Host Genetics Initiative, a global initiative to elucidate the role of host genetic factors in susceptibility and severity of the SARS-CoV-2 virus pandemic. Eur J Hum Genet. 2020;28:715–718. doi: 10.1038/s41431-020-0636-6. [DOI] [PMC free article] [PubMed] [Google Scholar]
- 13.Christophersen I.E., Rienstra M., Roselli C., Yin X., Geelhoed B., Barnard J., et al. Large-scale analyses of common and rare variants identify 12 new loci associated with atrial fibrillation. Nat Genet. 2017;49:946–952. doi: 10.1038/ng.3843. [DOI] [PMC free article] [PubMed] [Google Scholar]
- 14.Levin M.G., Judy R., Gill D., Vujkovic M., Verma S.S., Bradford Y., et al. Genetics of height and risk of atrial fibrillation: a Mendelian randomization study. PLoS Med. 2020;17 doi: 10.1371/journal.pmed.1003288. [DOI] [PMC free article] [PubMed] [Google Scholar]
- 15.Bowden J., Davey Smith G., Burgess S. Mendelian randomization with invalid instruments: effect estimation and bias detection through Egger regression. Int J Epidemiol. 2015;44:512–525. doi: 10.1093/ije/dyv080. [DOI] [PMC free article] [PubMed] [Google Scholar]
- 16.Bowden J., Davey Smith G., Haycock P.C., Burgess S. Consistent estimation in mendelian randomization with some invalid instruments using a weighted median estimator. Genet Epidemiol. 2016;40:304–314. doi: 10.1002/gepi.21965. [DOI] [PMC free article] [PubMed] [Google Scholar]
- 17.Verbanck M., Chen C.Y., Neale B., Do R. Detection of widespread horizontal pleiotropy in causal relationships inferred from Mendelian randomization between complex traits and diseases. Nat Genet. 2018;50:693–698. doi: 10.1038/s41588-018-0099-7. [DOI] [PMC free article] [PubMed] [Google Scholar]
- 18.Burgess S., Thompson S.G. Interpreting findings from Mendelian randomization using the MR-Egger method. Eur J Epidemiol. 2017;32:377–389. doi: 10.1007/s10654-017-0255-x. [DOI] [PMC free article] [PubMed] [Google Scholar]
- 19.Wu G., Wan X., Xu B. A new estimation of protein-level false discovery rate. BMC Genom. 2018;19:567. doi: 10.1186/s12864-018-4923-3. [DOI] [PMC free article] [PubMed] [Google Scholar]
- 20.Bhatla A., Mayer M.M., Adusumalli S., Hyman M.C., Oh E., Tierney A., et al. COVID-19 and cardiac arrhythmias. Heart Rhythm. 2020;17:1439–1444. doi: 10.1016/j.hrthm.2020.06.016. [DOI] [PMC free article] [PubMed] [Google Scholar]
- 21.Kelesoglu S., Yilmaz Y., Ozkan E., Calapkorur B., Gok M., Dursun Z.B., et al. New onset atrial fibrilation and risk factors in COVID-19. J Electrocardiol. 2021;65:76–81. doi: 10.1016/j.jelectrocard.2020.12.005. [DOI] [PMC free article] [PubMed] [Google Scholar]
- 22.Guo T., Fan Y., Chen M., Wu X., Zhang L., He T., et al. Cardiovascular implications of fatal outcomes of patients with coronavirus disease 2019 (COVID-19) JAMA Cardiol. 2020;5:811–818. doi: 10.1001/jamacardio.2020.1017. [DOI] [PMC free article] [PubMed] [Google Scholar]
- 23.Hoffmann M., Kleine-Weber H., Schroeder S., Krüger N., Herrler T., Erichsen S., et al. SARS-CoV-2 cell entry depends on ACE2 and TMPRSS2 and is blocked by a clinically proven protease inhibitor. Cell. 2020;181:271–280.e8. doi: 10.1016/j.cell.2020.02.052. [DOI] [PMC free article] [PubMed] [Google Scholar]
- 24.Gheblawi M., Wang K., Viveiros A., Nguyen Q., Zhong J.C., Turner A.J., et al. Angiotensin-converting enzyme 2: SARS-CoV-2 receptor and regulator of the renin-angiotensin system: celebrating the 20th anniversary of the discovery of ACE2. Circ Res. 2020;126:1456–1474. doi: 10.1161/CIRCRESAHA.120.317015. [DOI] [PMC free article] [PubMed] [Google Scholar]
- 25.Feng W., Sun L., Qu X.F. Association of AGTR1 and ACE2 gene polymorphisms with structural atrial fibrillation in a Chinese Han population. Pharmazie. 2017;72(1):17–21. doi: 10.1691/ph.2017.6752. [DOI] [PubMed] [Google Scholar]
- 26.Walters T.E., Kalman J.M., Patel S.K., Mearns M., Velkoska E., Burrell L.M. Angiotensin converting enzyme 2 activity and human atrial fibrillation: increased plasma angiotensin converting enzyme 2 activity is associated with atrial fibrillation and more advanced left atrial structural remodelling. Ep Europace. 2017;19(8):1280–1287. doi: 10.1093/europace/euw246. [DOI] [PubMed] [Google Scholar]
- 27.Yan R.A.-O., Zhang Y.A.-O., Li Y., Xia L.A.-O., Guo Y., Zhou Q.A.-O. Structural basis for the recognition of SARS-CoV-2 by full-length human ACE2. Science. 2020;367(6485):1444–1448. doi: 10.1126/science.abb2762. [DOI] [PMC free article] [PubMed] [Google Scholar]
- 28.Hu Y.F., Cheng W.H., Hung Y., Lin W.Y., Chao T.F., Liao J.N., et al. Management of atrial fibrillation in COVID-19 pandemic. Circ J. 2020;84:1679–1685. doi: 10.1253/circj.CJ-20-0566. [DOI] [PubMed] [Google Scholar]
- 29.Walls A.C., Park Y.J., Tortorici M.A., Wall A., McGuire A.T., Veesler D. Structure, function, and antigenicity of the SARS-CoV-2 spike glycoprotein. Cell. 2020;181:281–292.e6. doi: 10.1016/j.cell.2020.02.058. [DOI] [PMC free article] [PubMed] [Google Scholar]
- 30.Letko M., Marzi A., Munster V. Functional assessment of cell entry and receptor usage for SARS-CoV-2 and other lineage B betacoronaviruses. Nat Microbiol. 2020;5:562–569. doi: 10.1038/s41564-020-0688-y. [DOI] [PMC free article] [PubMed] [Google Scholar]
- 31.Lawlor D.A., Harbord R.M., Sterne J.A., Timpson N., Davey Smith G. Mendelian randomization: using genes as instruments for making causal inferences in epidemiology. Stat Med. 2008;27:1133–1163. doi: 10.1002/sim.3034. [DOI] [PubMed] [Google Scholar]
Associated Data
This section collects any data citations, data availability statements, or supplementary materials included in this article.


