Abstract
BACKGROUND
Self-report questionnaires, weighing products consumed, and Δ9-tetrahydrocannabinol (THC) biomarkers are established techniques for estimating cannabis exposure. Population pharmacokinetic modeling of plasma THC and metabolite concentrations by incorporating self-reported and weighed products as covariates could improve estimates of THC exposure in regular cannabis users.
METHODS
In this naturalistic study, blood samples were obtained from 36 regular smokers of cannabis for analysis of THC and its two metabolites at four time points: recruitment and during an experimental mobile laboratory assessment that included three time points: before, immediately after, and one hour after ad libitum legal market flower use. These data were analyzed using an established model of population pharmacokinetics developed from laboratory-controlled cannabis administration data. Elimination and metabolite production clearances were estimated for each subject as well as their daily THC doses and the dose consumed during the ad libitum event.
RESULTS
A statistically significant correlation existed between the daily THC dose estimated by self-report questionnaire and population pharmacokinetic modeling (correlation coefficient = 0.79, p<0.05) between the weighed cannabis smoked ad libitum and that estimated by population pharmacokinetic modeling (correlation coefficient = 0.71, p<0.05).
CONCLUSION
Inclusion of self-reported questionnaire data of THC consumption improved pharmacokinetic model-derived estimates based on measured THC and metabolite concentrations. Additionally, the pharmacokinetic-derived dose estimates for the ad libitum smoking event underestimated the THC consumption compared to the weighed amount smoked. Thus, the subjects in this study, who smoked ad libitum, and used cannabis products with high concentrations of THC were less efficient (lower bioavailability) compared to computer-paced smokers of low potency, NIDA cannabis in a laboratory setting.
Introduction
Cannabis is the most widely used illicit substance in the world, and over the last several years, public acceptance has grown rapidly, (1) with an estimated 192 million adults and adolescents using cannabis worldwide. (2) Δ9-tetrahydrocannabinol (THC) exhibits dose-dependent effects, for example, “feeling high” and tachycardia. (3–5) Cannabis produces acute cognitive impairment, in particular reduced memory and attention, and mood-altering effects. (6, 7) With chronic cannabis use, the dose-response curve shifts to the right due to partial tolerance. (8, 9) To assess the relationship of THC exposure and its neurophysiologic effects, quantitative estimates of drug use or exposure are needed.
There are three established methods for assessing THC exposure in human subjects: retrospective self-report (for example, the timeline follow-back (TLFB) interview provides highly detailed and well-validated frequency and quantity data) (10–12), weighing the consumed cannabis product, and measurement of cannabinoids in biological matrices, such as blood or urine. (13–15) Direct measurement is both objective and, by definition, reflects the amount of drug that enters and transitions the body. THC and metabolite concentration ratios have been suggested to estimate time since last use as well as for a quantitative measure of daily use. (13, 16) In addition, due to individual differences in smoking topography, metabolism, and other factors, actual THC exposure is particularly challenging to estimate, even when the dose is known. There is a strong consensus that the most accurate drug use information is obtained by employing multiple assessments, including self-report and biologic testing, to obtain drug and metabolite concentrations. (14) However, it is also widely recognized that there are no established guidelines for integrating self-report and toxicology data to estimate THC exposure. (14) In studies of proprietary drugs, rather than using raw drug concentration data, population pharmacokinetic models provide a bridge between self-reported dosing and plasma drug concentrations. (17) Few studies have applied this approach to cannabis dose estimation.
Population (i.e., nonlinear mixed effects) pharmacokinetic analyses are strongly recommended by drug-regulatory agencies to delineate variability in a single individual and among all individuals. Such modeling techniques are utilized to analyze drug and metabolite concentration datasets in which the number of samples per subject is small (i.e., sparse) or unbalanced in terms of sampling frequency and timing since dose (18, 19) thereby permitting objective assessment of quantifiable drug effects with drug exposure. We analyzed the plasma concentration versus time data from a previously published, highly controlled study of THC administration (20) with frequent blood sampling (i.e., dense) to produce a population pharmacokinetic model of THC, 11-OH-THC, and THCCOOH. (21)
While several formal pharmacokinetic studies have been performed utilizing NIDA- or pharmaceutically-sourced cannabis (20, 22–25), due to DEA scheduling of THC, it is difficult to perform rigorous pharmacokinetic studies of THC and its metabolites following the consumption of current, high-potency products readily available to consumers in states in which cannabis is legal. In this study, we used a proof-of-concept exercise to combine the population pharmacokinetic model (21) of dense plasma THC, 11-OH-THC, and THCCOOH concentrations (20) with sparse plasma THC, 11-OH-THC, and THCCOOH concentration data collected from subjects enrolled in an observational study of naturalistic administration of high-potency cannabis in Colorado (26). In this study, participants completed a baseline and an experimental mobile laboratory assessment that involved ad libitum administration of legal market cannabis flowers, thereby providing four blood samples for THC and metabolite analysis which thus resembled an FDA Phase III/IV clinical trial in that there were fewer samples per subject collected under conditions that were more real-life than Phase I/II trials. It is advantageous to combine dense phase I/II pharmacokinetic data from few subjects with sparse Phase III/IV pharmacokinetic data from a larger, more varied population in order to discern sources of inter-individual variability in pharmacokinetics. (27, 28)
Herein, we used the population pharmacokinetic model of THC and its 11-OH-THC and THCCOOH metabolites (21) as a Bayesian prior to analyze the sparse pharmacokinetic data of these compounds obtained from a larger group participating in an observational study of naturalistic administration of high-potency cannabis. (26) We anticipated that major sources of inter-individual variability of plasma THC, 11-OH-THC, and THCCOOH concentrations in this latter study would be the daily amount of THC typically consumed as well as the amount consumed during a single use ad libitum session involving a mobile laboratory. By constraining the pharmacokinetic model parameter estimates for each individual according to the Bayesian prior, chronic and single use THC doses were estimated by fitting the plasma drug/metabolite data to the population pharmacokinetic model. These dose estimates were compared by linear regression to questionnaire estimates of typical use (i.e., previous month) and the weighed cannabis smoked ad libitum during a mobile laboratory session. We hypothesized that estimates of THC exposure derived from plasma THC and metabolite concentrations would be significantly correlated to THC exposure, estimated by self-report questionnaire and by the weighed amount of cannabis flower during a single smoking session. Further, we hypothesized that the inclusion of covariates corresponding to questionnaire-derived data of typical cannabis consumption and weighed cannabis before and after a single use would significantly improve the performance of the population pharmacokinetic model, thus providing a validated method for combining all three established methods assessing cannabis exposure (i.e., self-report, weighed cannabis, and biometric measurement) into a unified assessment tool.
Methods
CONDUCT OF OBSERVATIONAL STUDY WITH NATURALISTIC ADMINISTRATION OF HIGH-POTENCY CANNABIS
The study that provided data for this pharmacokinetic analysis was approved by the University of Colorado IRB and legal counsel. Written informed consent was obtained from each participant. The primary outcomes, focused on the acute psychomotor effects after naturalistic administration of high potency products were published previously. (26) For the purposes of this pilot pharmacokinetic study, we confined subjects for these analyses to those who used inhalation as their sole or primary mode of cannabis consumption. Participants were recruited from advertisements posted in local dispensaries and from social media outlets and screened for drug abuse and medical and neuropsychiatric illness, as described previously.(3)
The study involved two appointments (Figure 1): a baseline assessment at the research facility and a second assessment in a mobile laboratory parked outside the subject’s residence. Federal restrictions did not allow research staff to handle or administer legal market cannabis. Therefore, subjects purchased their own and self-administered the legal market cannabis in their homes. Before their baseline assessment, subjects were asked to abstain from drinking alcohol or use cannabis that day. A blood sample was obtained for the measurement of THC and metabolites. To quantify the frequency and quantity of typical use, each subject completed the Marijuana Consumption Questionnaire (MCQ). (29) The MCQ includes questions about the frequency of typical cannabis use, strain typically used, as well as the amount typically used per day, using visual stimuli (pictures of 0.5 g and 0.25 g to more accurately estimate the amount typically used). (10)
Figure 1.

Experimental timeline for the observational study of cannabis users.
Upon completion of the baseline appointment, participants were randomly assigned to one of two strains of flower cannabis: either 16% or 24% THC content strain to test the hypothesis that cannabis potency affects psychomotor measures. (26) For the current analysis, the THC content of the strain was treated as one of many sources of THC dose variability, as noted below. As required by the State of Colorado, the THC potency of all products was labeled according to testing in an International Organization of Standards 17025-accredited laboratory. Subjects were instructed to purchase their typical quantity of the assigned cannabis from a local dispensary that agreed to assist in the study. The participants were not given any instructions regarding the amount they should use or the method of consumption. Instead, participants were asked to use their assigned cannabis strain as they normally would until their experimental session, which was held 5–7 days after the baseline assessment. A subset of subjects who indicated that they consumed THC by cigarettes or pipes were selected for this analysis to best align with our previous population PK model, based on controlled cigarette smoking, (21) and its application to these data.
To begin the second appointment, a second baseline blood sample was obtained in the mobile laboratory. Afterwards, the participants entered their residence, unaccompanied by study personnel, and used the assigned strain by cigarette or pipe without sharing (denoted “ad libitum smoking event”). Then, as soon as possible, they walked back to the mobile laboratory where a blood sample was immediately obtained, followed by another timed sample one hour later. Plasma THC, 11-OH-THC, and THCCOOH concentrations were measured with HPLC-MS/MS with a lower limit of quantitation of 0.4 ng/mL for each compound. (30) Additionally, the dried cannabis flower was weighed before and after the ad libitum smoking event to calculate after correction for the THC content, the amount of THC smoked.
PHARMACOKINETIC DATA ANALYSIS OF OBSERVATIONAL DATA
The pharmacokinetic analysis was performed using Phoenix NMLE 8.3 with the FOCE ELS algorithm (Certara, Princeton, NJ). The concentration data for THC, 11-OH-THC, and THCCOOH from the four plasma samples obtained from each of the 36 subjects were fitted with our prior experiment-based pharmacokinetic model. (21) In the absence of specific dosing details, the following assumptions were made for the purpose of pharmacokinetic modeling: (1) subjects had been using marijuana on a routine basis for several weeks and, thus, were at steady-state when the blood sample was obtained at the time of the baseline assessment, (2) there were seven days of typical, identical to pre-baseline, cannabis use between the baseline and at ad libitum administration event, (3) last use of cannabis was at 10 pm the night before a baseline blood draw, and (4) the smoking episode during the second appointment at subjects’ residences occurred over the amount of time calculated by the ‘burn rate’ of the laboratory study (20) (i.e., 900 mg/10 min) times the weight of the cannabis flower used ad libitum.
These data and dosing assumptions were modeled with our prior population pharmacokinetic model of THC and its metabolites (11-OH-THC and THCCOOH), based on data from the highly controlled (20) randomized, crossover (two doses) clinical trial with computer-paced smoking and multiple blood samples obtained for one week following each smoking event. (21) Model parameters (θj, theta, for model parameter j) were assumed to be log-normally distributed across the population with a central, typical value (θTV) allowing for assessment of between-subject variability (ηi,j, eta, for individual i and model parameter j) as follows:
| (1) |
The variance terms for between-subject variability, ω2, were fixed to the values for the elimination and conversion clearances for THC, 11-OH-THC, and THCCOOH that we previously estimated. (21) Since the sparse samples obtained from the subjects in the observational study were largely at steady-state and, therefore, contained little or no information regarding the distribution processes of THC or its metabolites, the volume of distribution and intercompartmental clearance estimates were fixed to the typical values from the prior study (21) in which there were ample data to describe the distribution kinetics. The ηi,j estimates for elimination and metabolism for each individual were constrained to fall within the estimated distributions of the previous trial. The residual within-subject error was calculated as the relative error. The daily, baseline, and steady-state THC consumption was arbitrarily assumed, for modeling purposes, to consist of two 51 mg THC cigarettes, smoked 12 hours apart with 25% bioavailability, and estimates of each individual’s typical daily dose were scaled to this assumed dose. A baseline bioavailability term, Fbaseline, was estimated for each individual with the assumptions that subjects were in steady state at recruitment and that there was no change in THC consumption in the seven days between recruitment and the smoking event at their residences. Therefore, steady-state solutions for all compartments at time zero were used in the modeling. Estimates of Fbaseline different than 1.0 indicate proportionally less or more daily THC consumption from an assumed standard daily dose with 25% bioavailability. A similar estimate of bioavailability for the ad libitum smoking events in subjects’ residences, Fresidence, as a proportion of an assumed standard single THC cigarette smoked in a paced manner. In addition, the time from beginning ad libitum smoking until the first post-smoking blood sample was obtained was estimated using a lag function, tlag.
THC and metabolite concentrations below the lower limit of quantitation (i.e., less than 0.4 ng/mL) were analyzed according to the M3 method of Beal (31) to include data outside the limits of quantitation. Interindividual variability parameters (ηj) with shrinkage values above 0.9, below 0.01, or negative were removed sequentially.(32)
CORRELATION OF QUESTIONNAIRE AND WEIGHED CANNABIS DATA TO PHARMACOKINETIC ESTIMATES
Regression analyses were performed to examine the relationships between the model estimates of cannabis use and those self-reported by the subjects. Additionally, linear regression was performed to examine the relationship between the estimated smoked amount and the weighed difference, corrected for percentage THC content of the strain smoked, between the cannabis at the beginning of the ad libitum smoking event and the residual upon return to the mobile laboratory.
INCORPORATION OF QUESTIONNAIRE AND WEIGHED DOSE DATA INTO THE POPULATION PHARMACOKINETIC MODEL
Potential covariate effects of self-report questionnaire data and weighed dose were added to the base model, centered on their composite means:
| (1) |
where tvθj is the population typical value (mean) for the parameter (Fbaseline and Fresidence) θi,j is the parameter estimate j of the ith individual, cov is the centered daily questionnaire or residence-event weighed amounts, sf is the value of covariate scaling factor, and η (eta) is a random variable describing the variance between individual θi,j and the population mean tvθj estimates.
Two covariates were tested: an estimate of daily THC consumption derived from the self-report questionnaire and the weighed dose for the single smoking event, corrected for the THC content of the strain used. These covariates were tested alone and then together such that a decrease in the objective function (−2 loglikelihood) of 6.63 (p<0.01 level for χ2) for adding each covariate to the model was required for inclusion and 13.26 (p<0.01 level for χ2) for both covariates.
A visual predictive check was performed by using the final model parameter estimates to simulate data for 300 virtual subjects and calculating their 5th, 50th, and 95th percentiles at all sampling times. The distributions of the simulated THC, 11-OH-THC, and THCCOOH concentrations were visually compared with the measured concentrations at each sampling time.
Results
PHARMACOKINETIC MODELING OF OBSERVATIONAL DATA
Thirty-six subjects were included from the larger 120 subject study (26), based on their cannabis consumption preference, and they had otherwise similar demographics: age 27.9±6.6 yrs., 44% female, and body weight 75.2±19.6 kg. Four blood samples were obtained from each (i.e., one at recruitment, one in the mobile lab prior to entering their residences, one immediately upon returning to the mobile lab after smoking and another one hour later, Figure 1). Thus, there could be 144 concentration measurements for each compound for pharmacokinetic analysis. There were 129 THC concentrations above the lower limit of quantitation, 86 for 11-OH-THC, and 139 for THCCOOH. The remaining samples, below the limit of quantitation, were included in the pharmacokinetic analyses per the description in the methods. Shrinkage values were below 0.6 for all parameters, therefore, no interindividual variability was removed.(32) The pharmacokinetic parameters estimated in the current study are reported in Table 1.
Table 1.
Cle = elimination clearance. Clthc->oh = metabolic clearance from THC to 11-OH-THC. Cloh->cooh = metabolic clearance from 11-OH-THC to THCCOOH. Fbaseline, Finterval, and Fresidence are the fraction of the assumed standard THC doses at recruitment, the interval before residential smoking, and in-residence smoking, respectively. CovMCQbaseline, CovMCQinterval, and CovTHC-WT are the scaling factors (sf: equation 1) for the self-report questionnaire daily doses (Fbaseline) and weighed dose (Fresidence), respectively.
| TYPICAL VALUE | ± | SEE | ω2 | ± | SEE | SHRINKAGE | ||
|---|---|---|---|---|---|---|---|---|
| THC | ||||||||
| Cle (L/min) Phase I Study | 0.72 | ± | 0.09 | 0.11 | ± | 0.004 | ||
| Cle (L/min) Current Study | 0.58 | ± | 0.07 | * | ||||
| 11-OH-THC | ||||||||
| Clthc->oh (L/min) Phase I Study | 0.36 | ± | 0.02 | 0.024 | ± | 0.3 | ||
| Clthc->oh (L/min) Current Study | 0.30 | ± | 0.08 | * | ||||
| THCCOOH | ||||||||
| ClOH->COOH (L/min) Phase I Study | 0.78 | ± | 0.05 | * | ||||
| ClOH->COOH (L/min) Current Study | 0.75 | ± | 0.20 | 0.03 | ± | 0.09 | 0.68 | |
| Cle (L/min) Phase I Study | 0.12 | ± | 0.01 | 0.11 | ± | 0.07 | ||
| Cle (L/min) Current Study | 0.08 | ± | 0.01 | 0.22 | ± | 0.08 | 0.18 | |
| THC DOSE PARAMETERS | ||||||||
| Time (min) from beginning ad libitum smoking until first blood sample | 14.0 | ± | 2.8 | |||||
| F baseline | 0.37 | ± | 0.13 | 0.62 | ± | 0.10 | 0.04 | |
| F residence | 0.43 | ± | 0.20 | 0.80 | ± | 0.23 | 0.07 | |
| CovMCQ baseline | 0.77 | ± | 0.08 | |||||
| CovTHC-WT residence | 0.40 | ± | 0.08 |
ω2 = inter-subject variability;
indicates ω2 was fixed to Phase I study value. SEE = standard error of the estimate.
PHARMACOKINETIC MODEL DIAGNOSTICS
The plots of observed versus final ‘post-hoc’ individual model predictions for THC, 11-OH-THC, and THCCOOH for each dose are presented in Figure 2. The conditional weighted residuals versus time and the predicted concentration relationships are presented in Figure 3.
Figure 2.
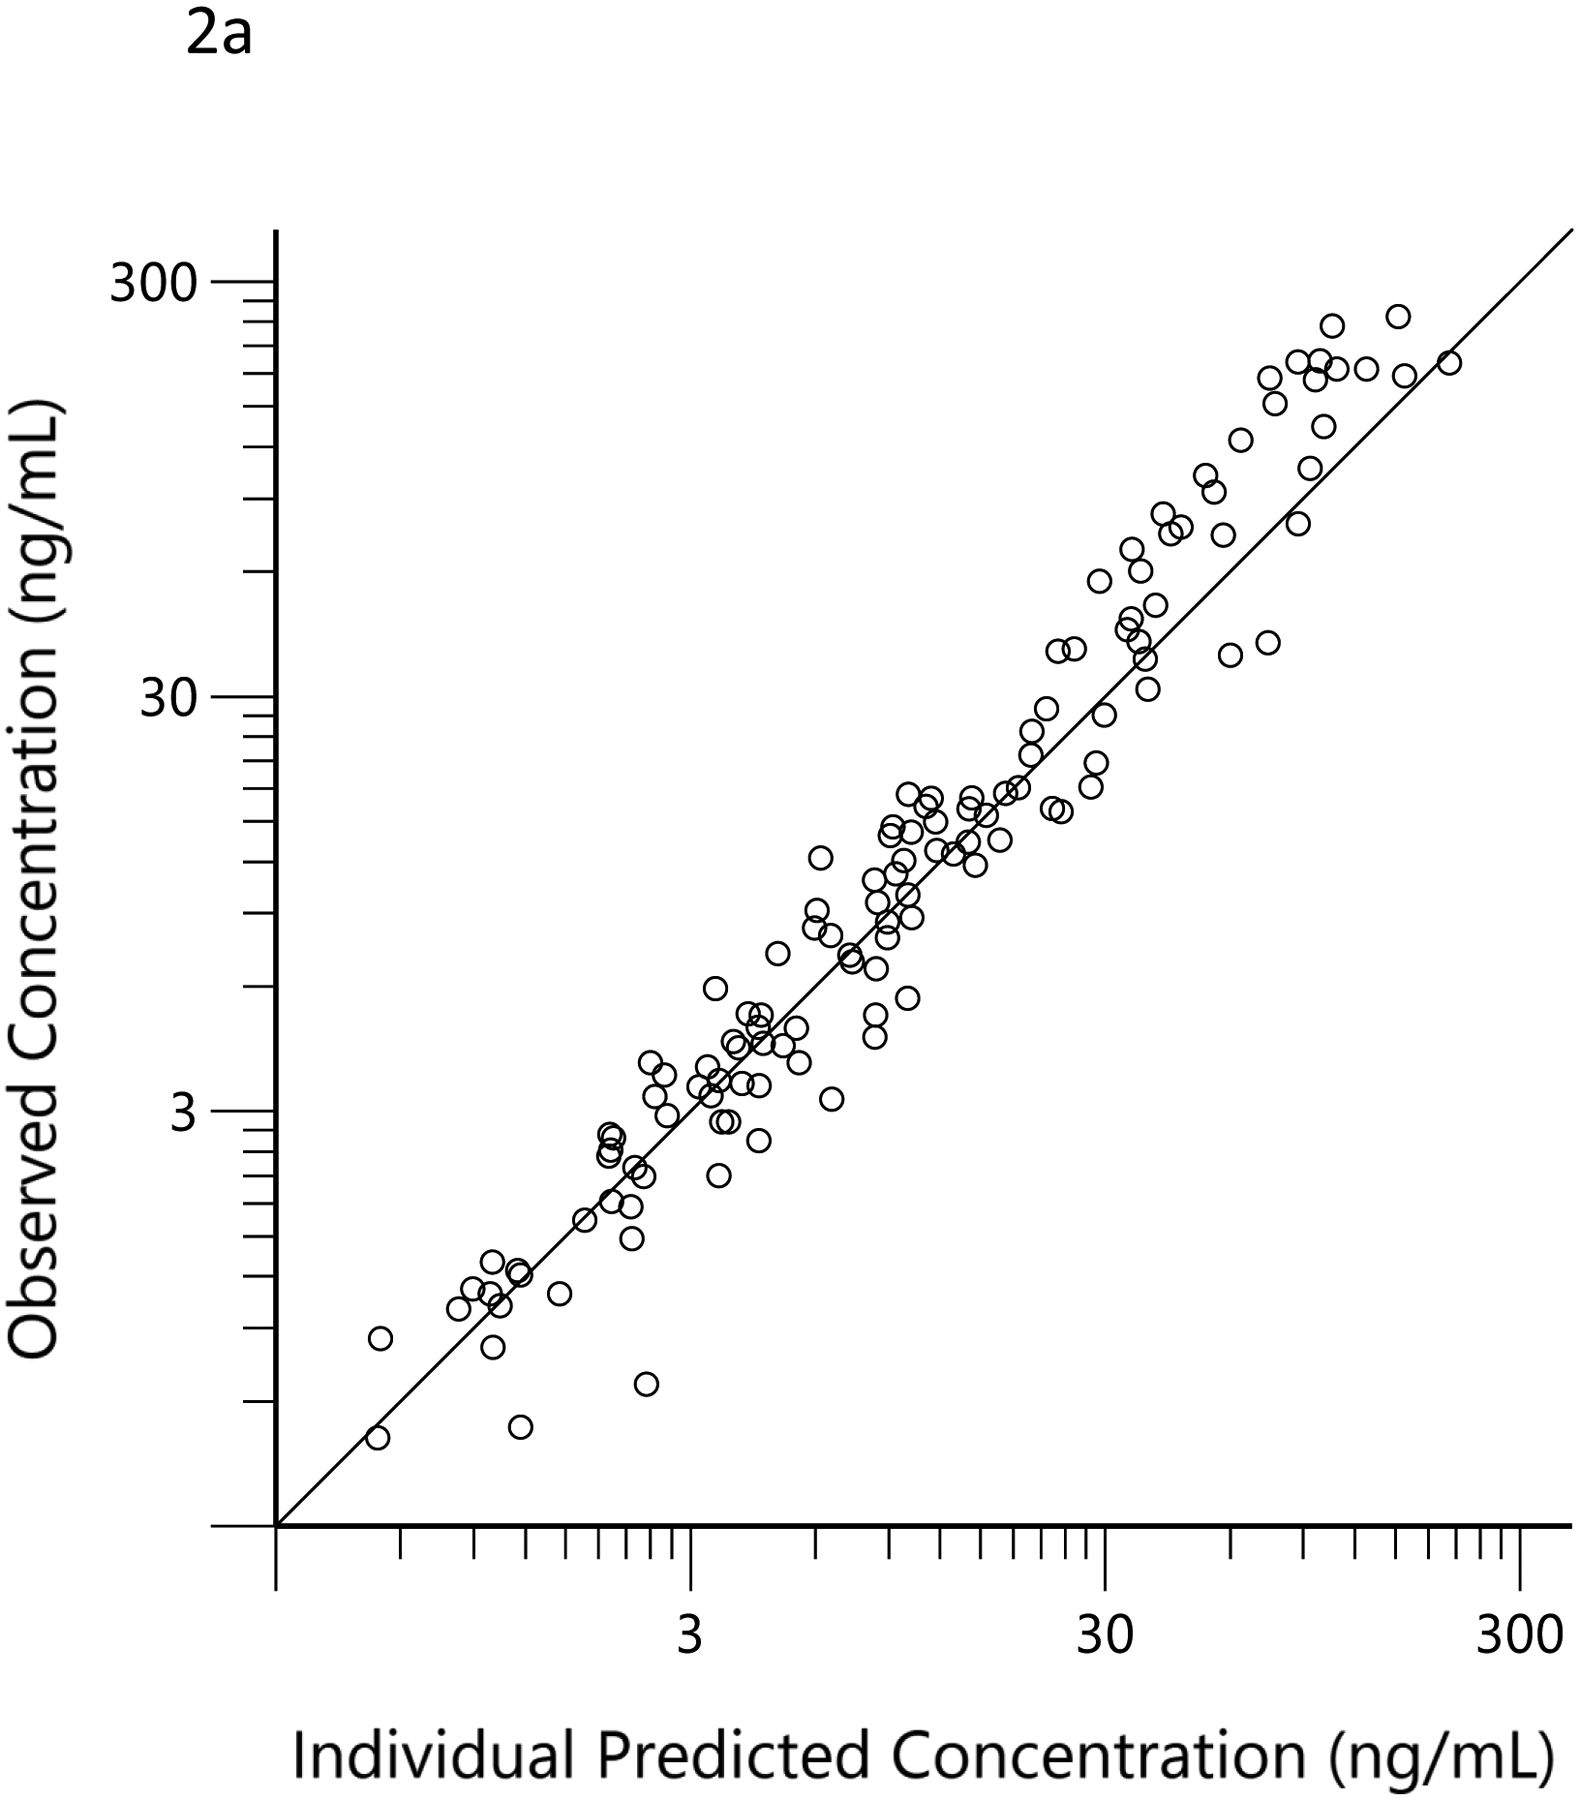
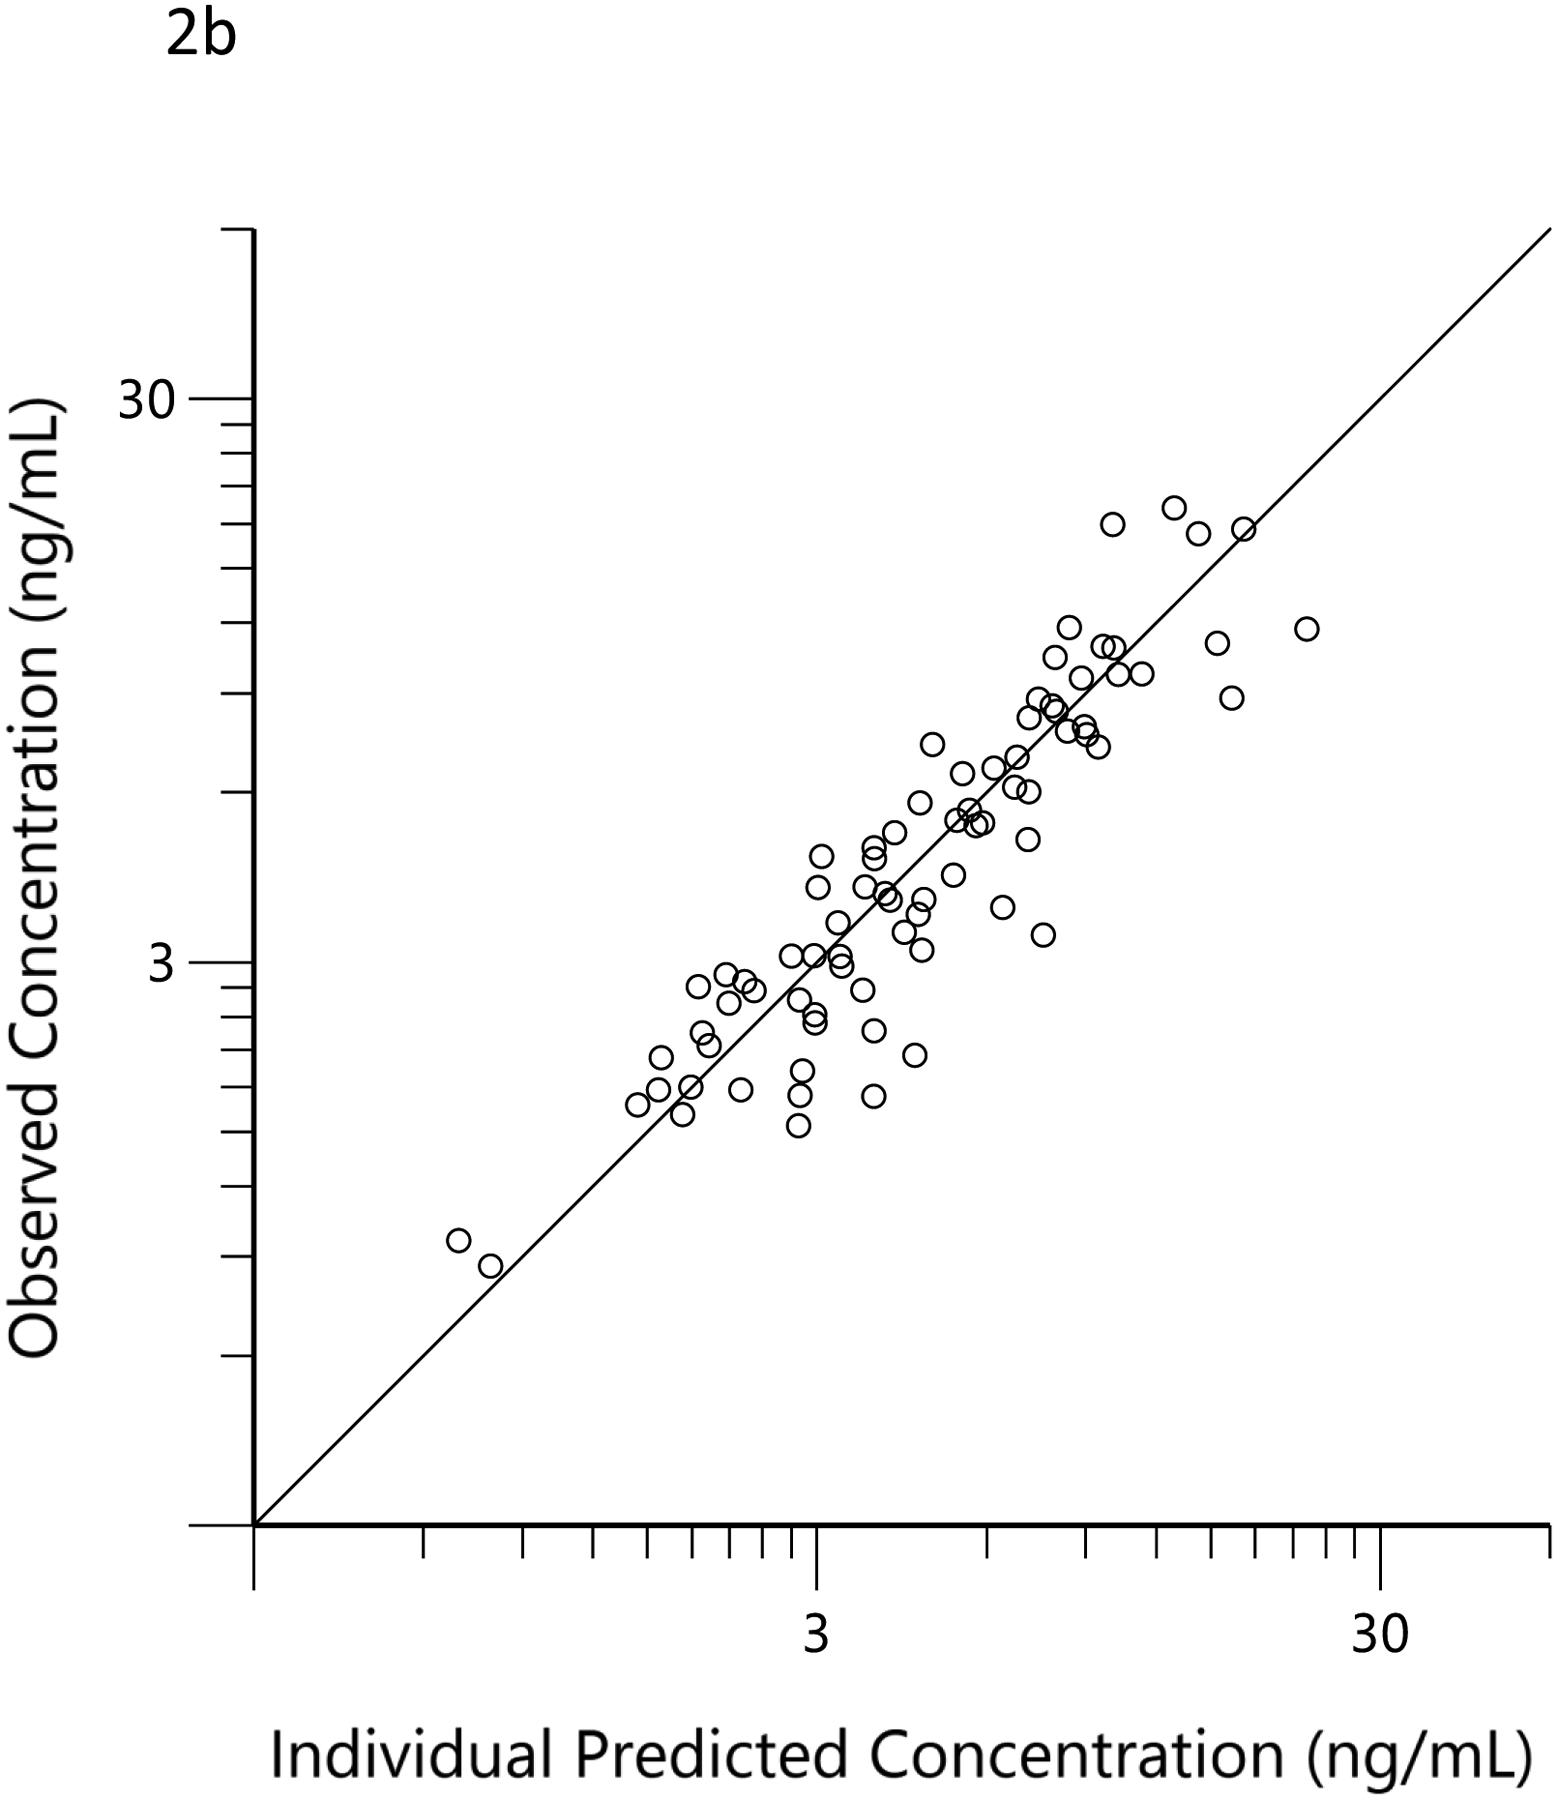
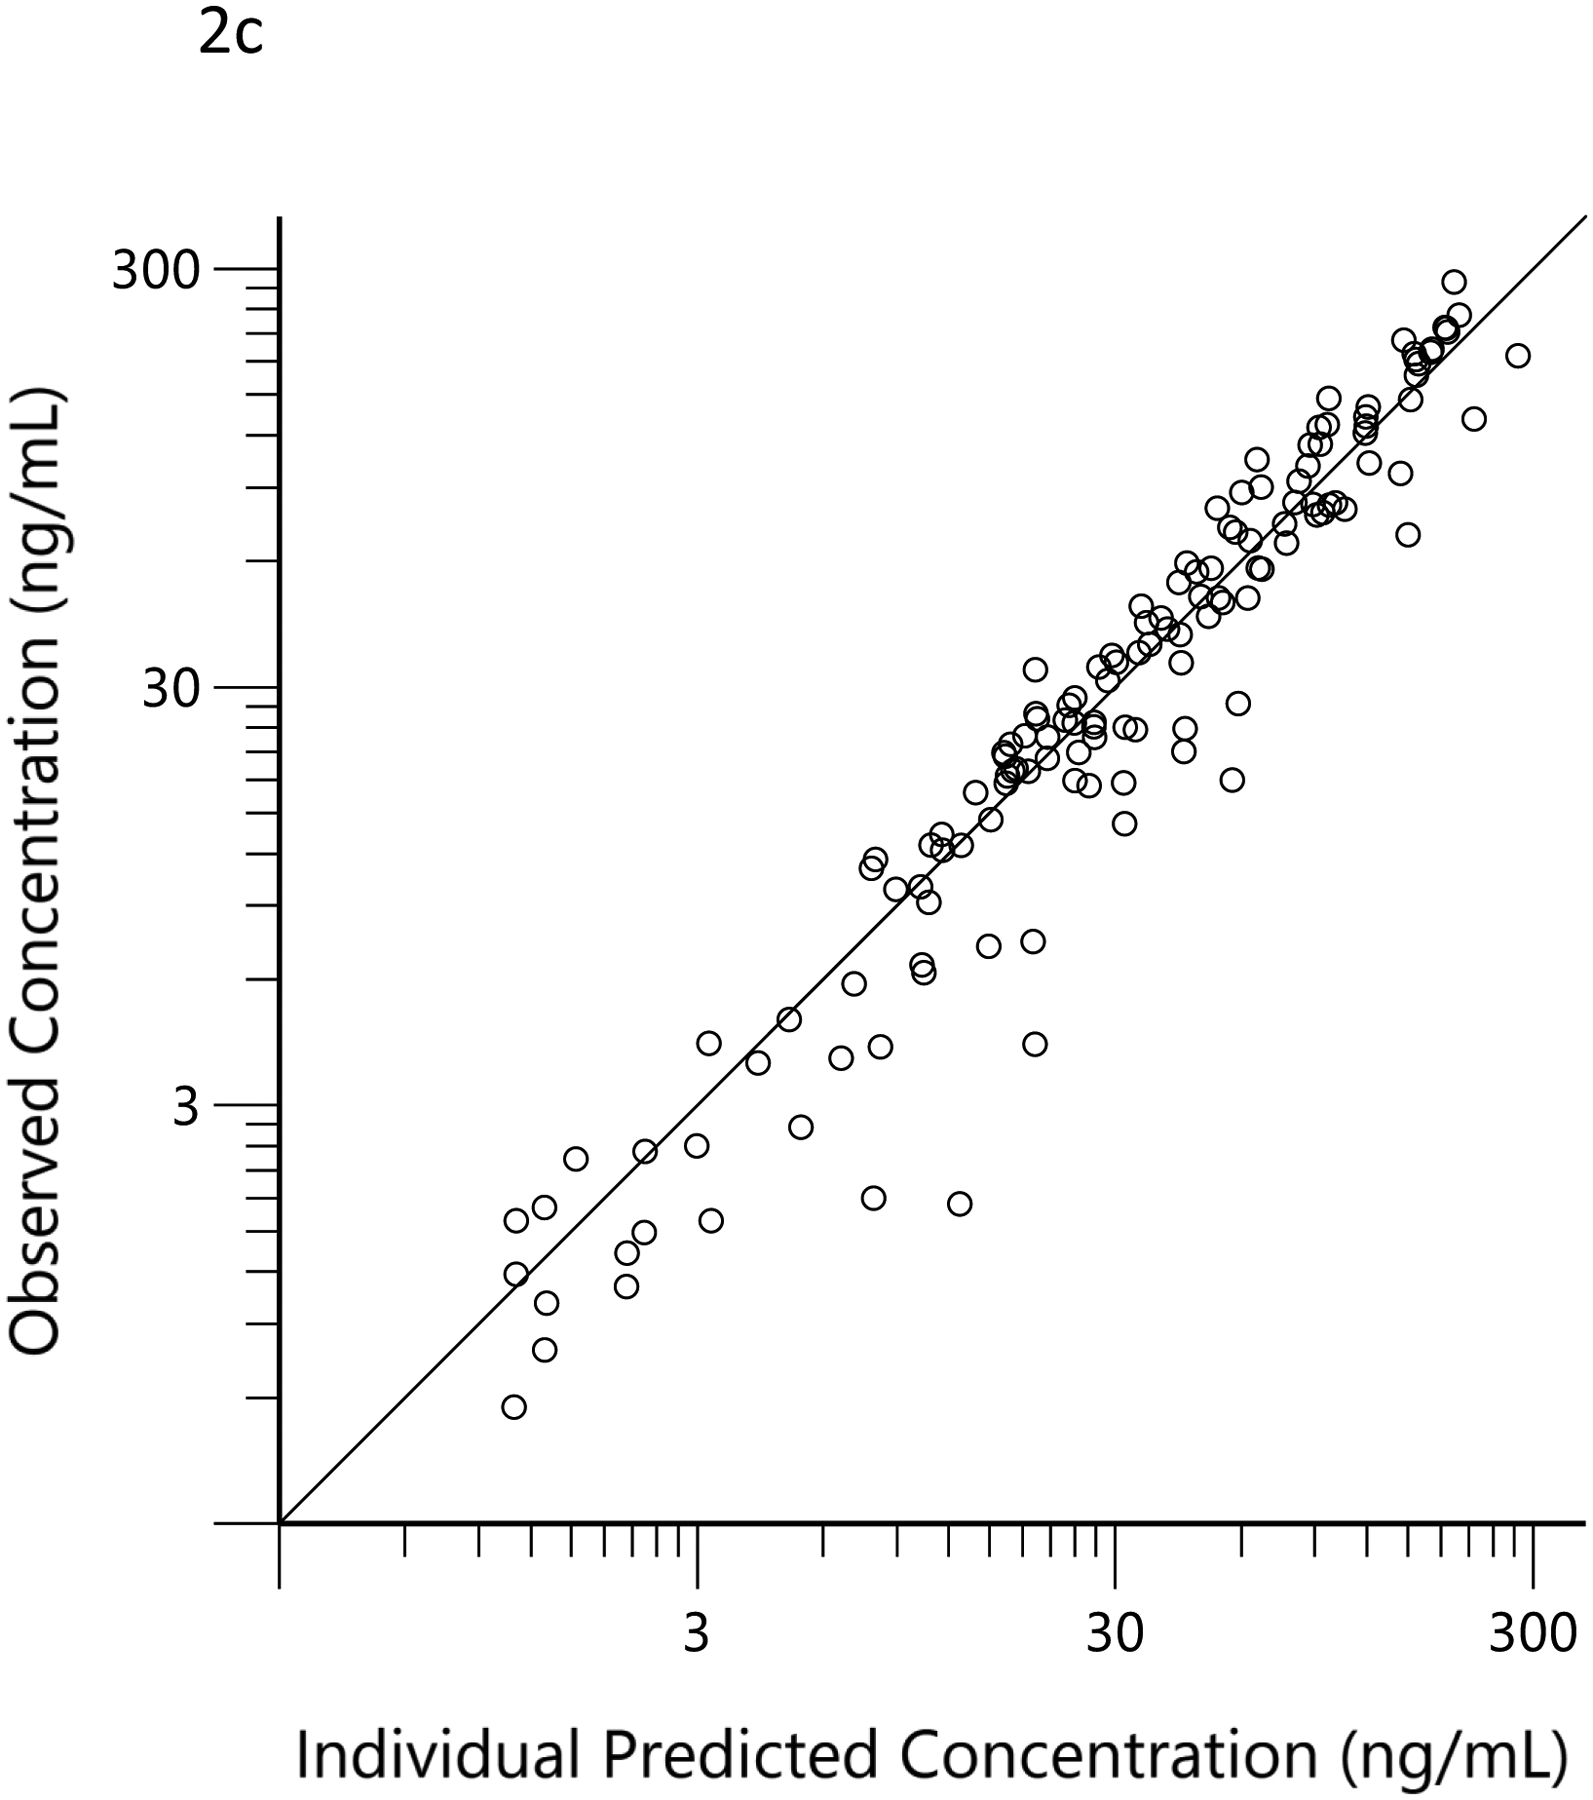
Observed (open circles) versus predicted THC (a), 11-OH-THC (b) and THCCOOH (c) concentrations for the ‘post hoc’ individual compartment models for the low and high doses. The black lines are the lines of identity.
Figure 3.
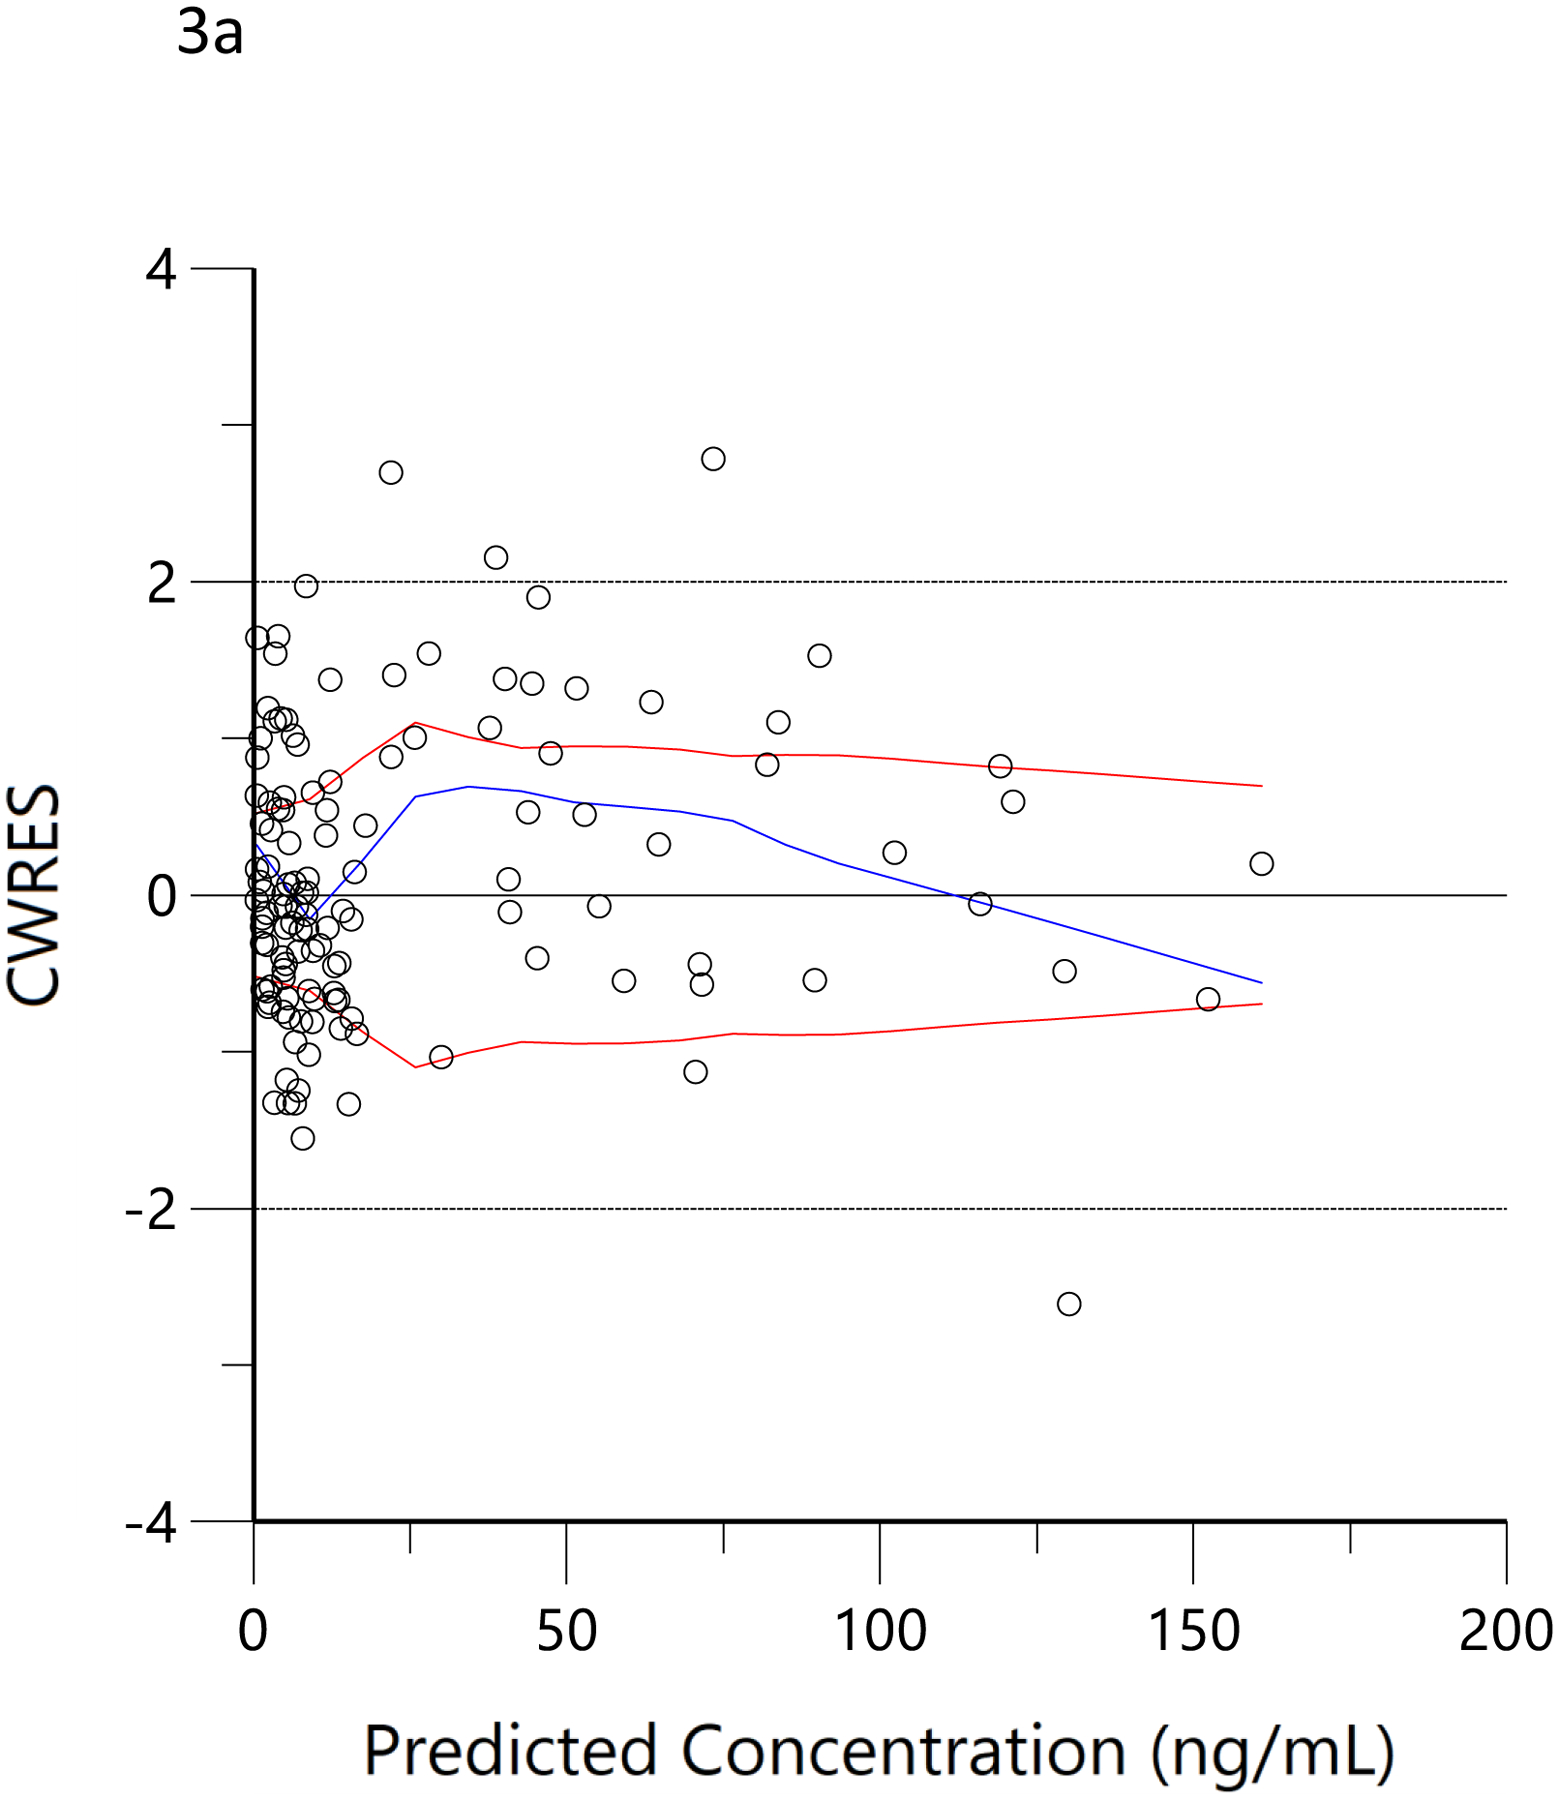
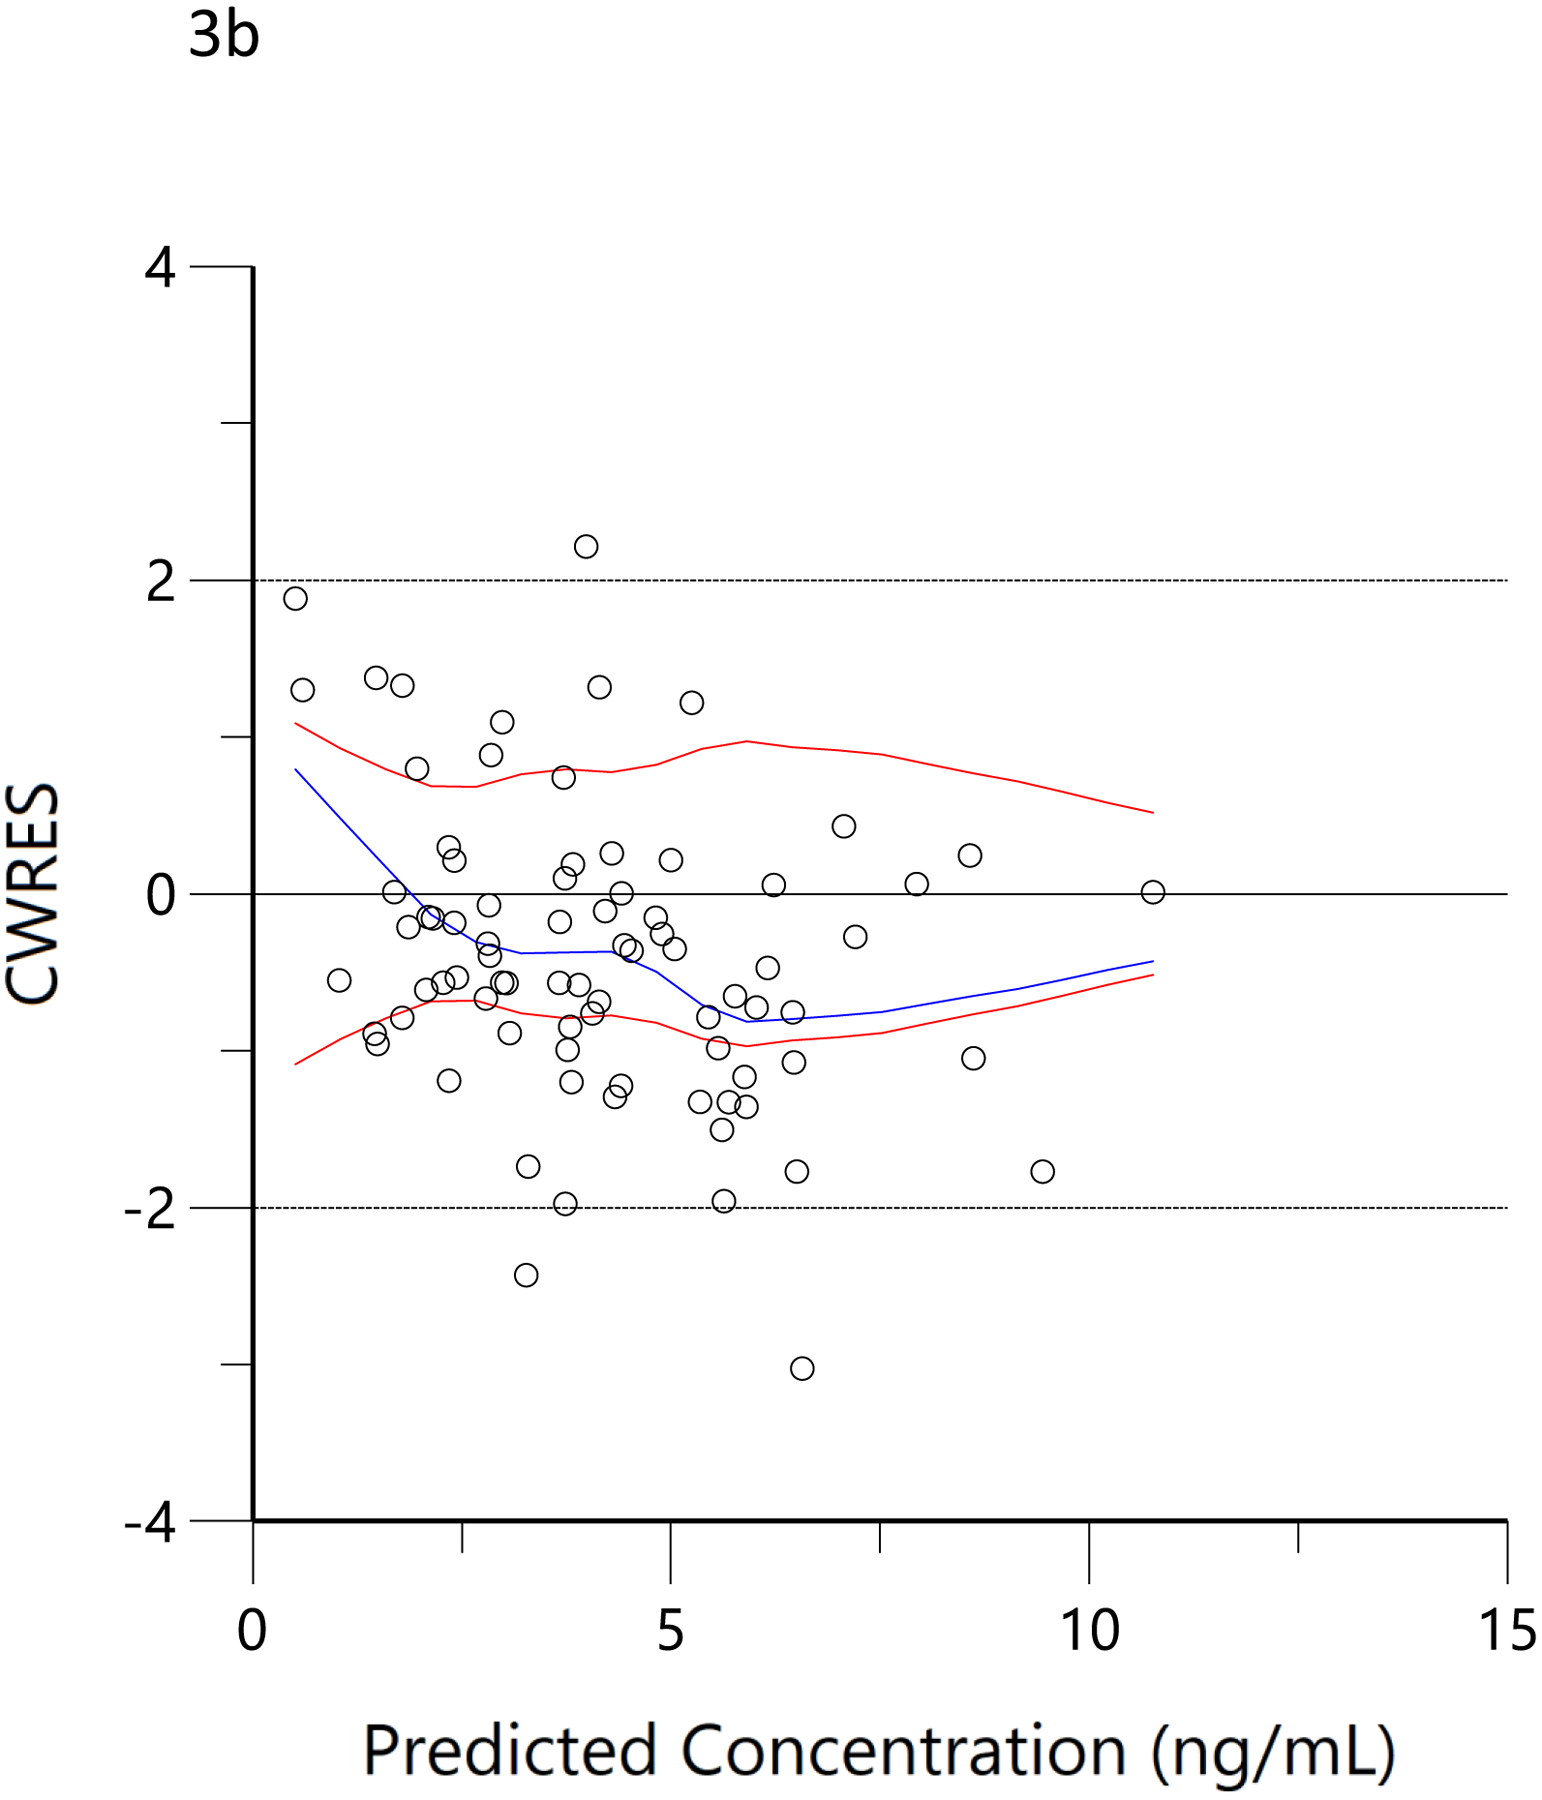
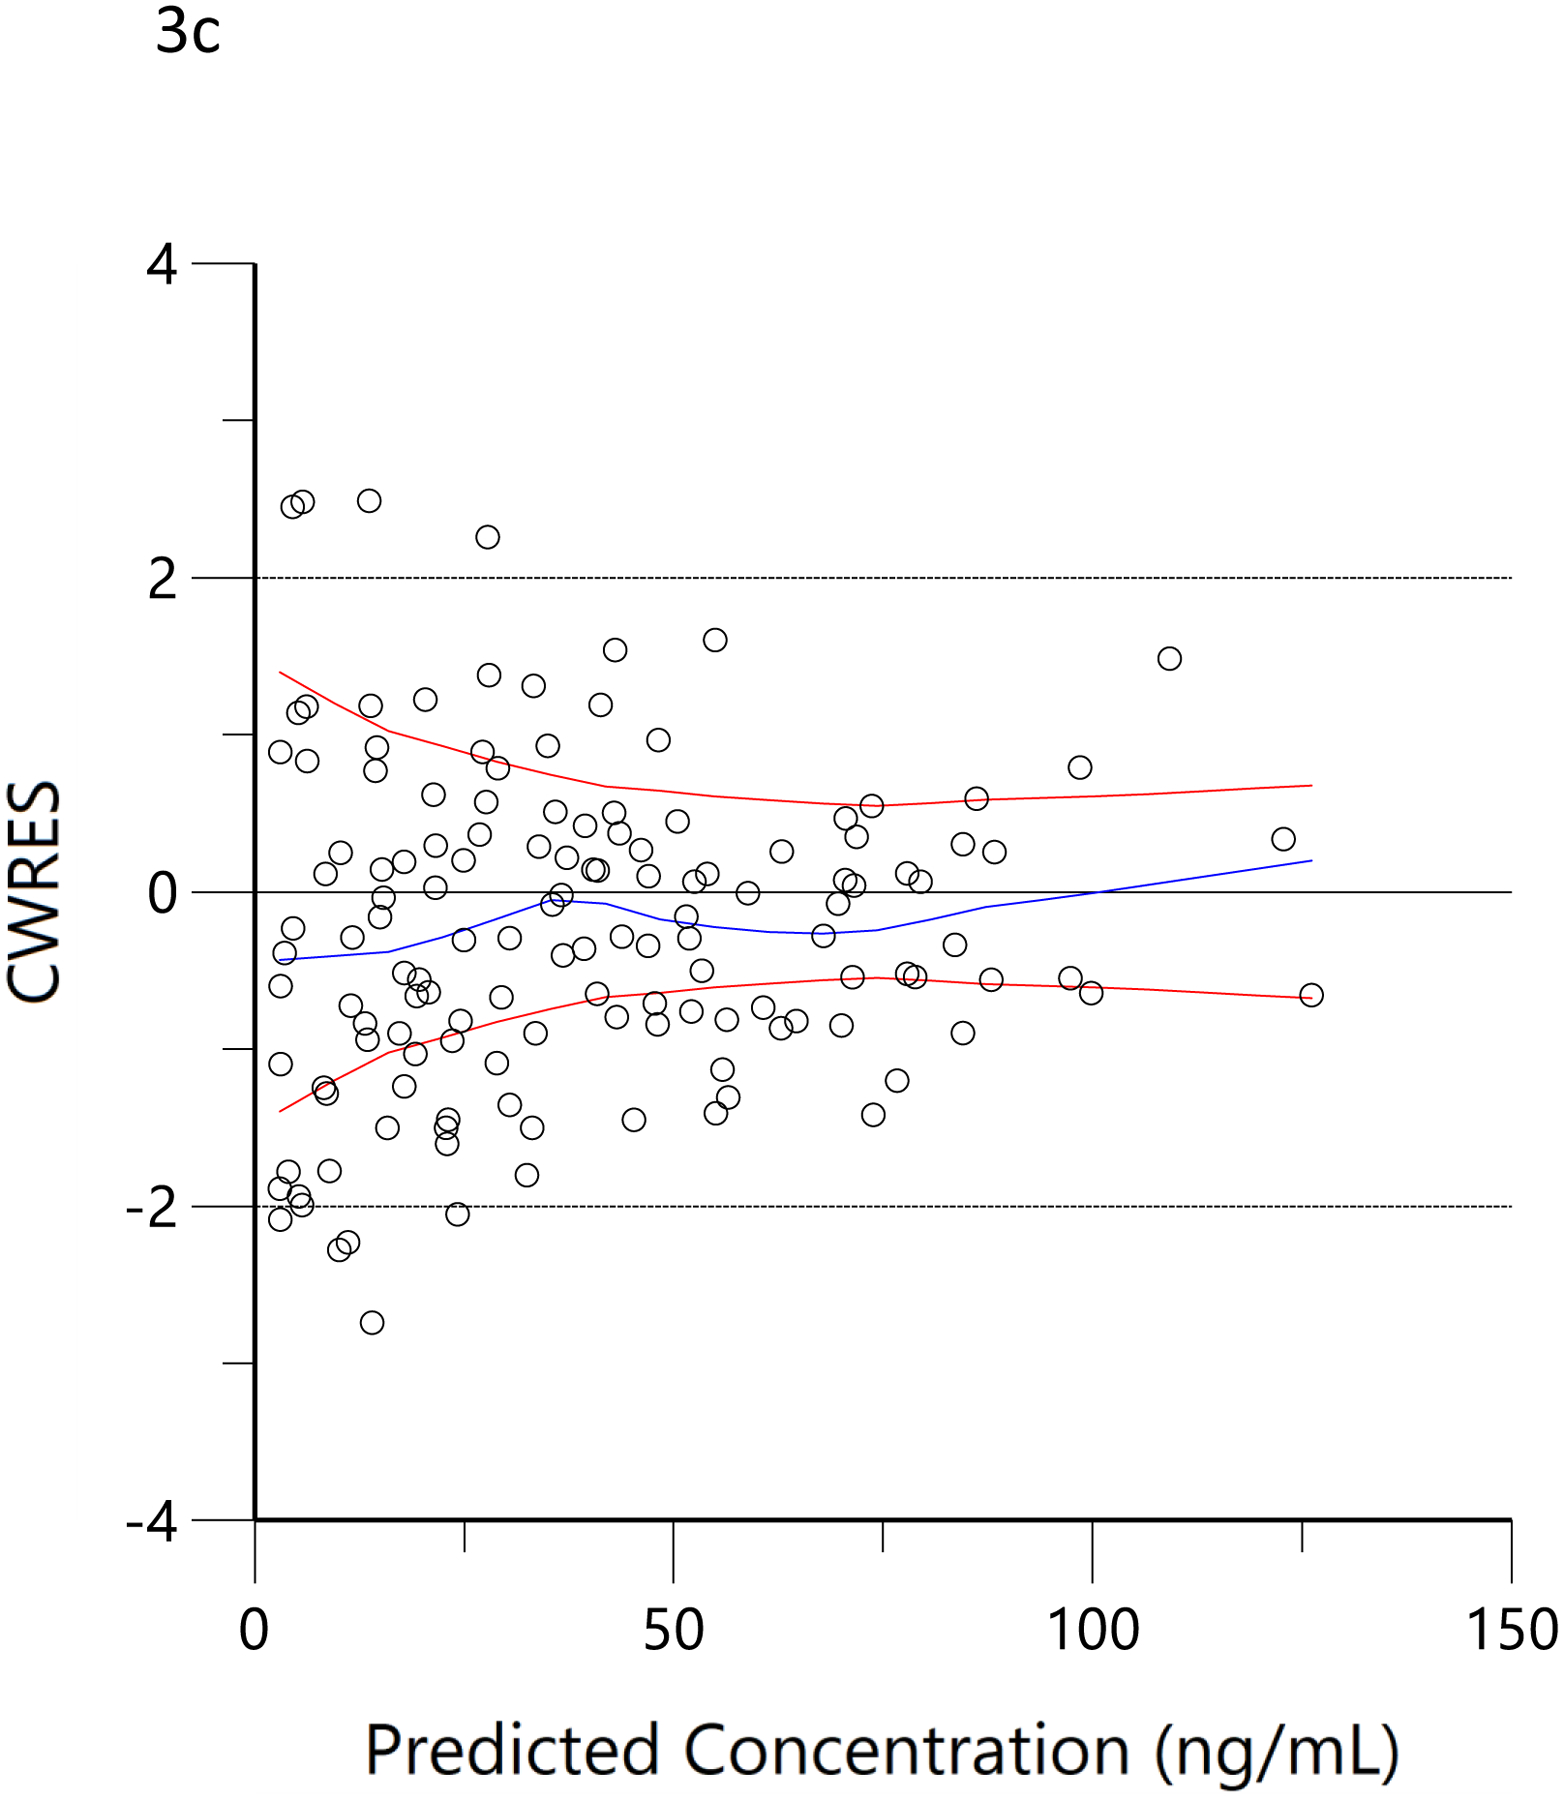
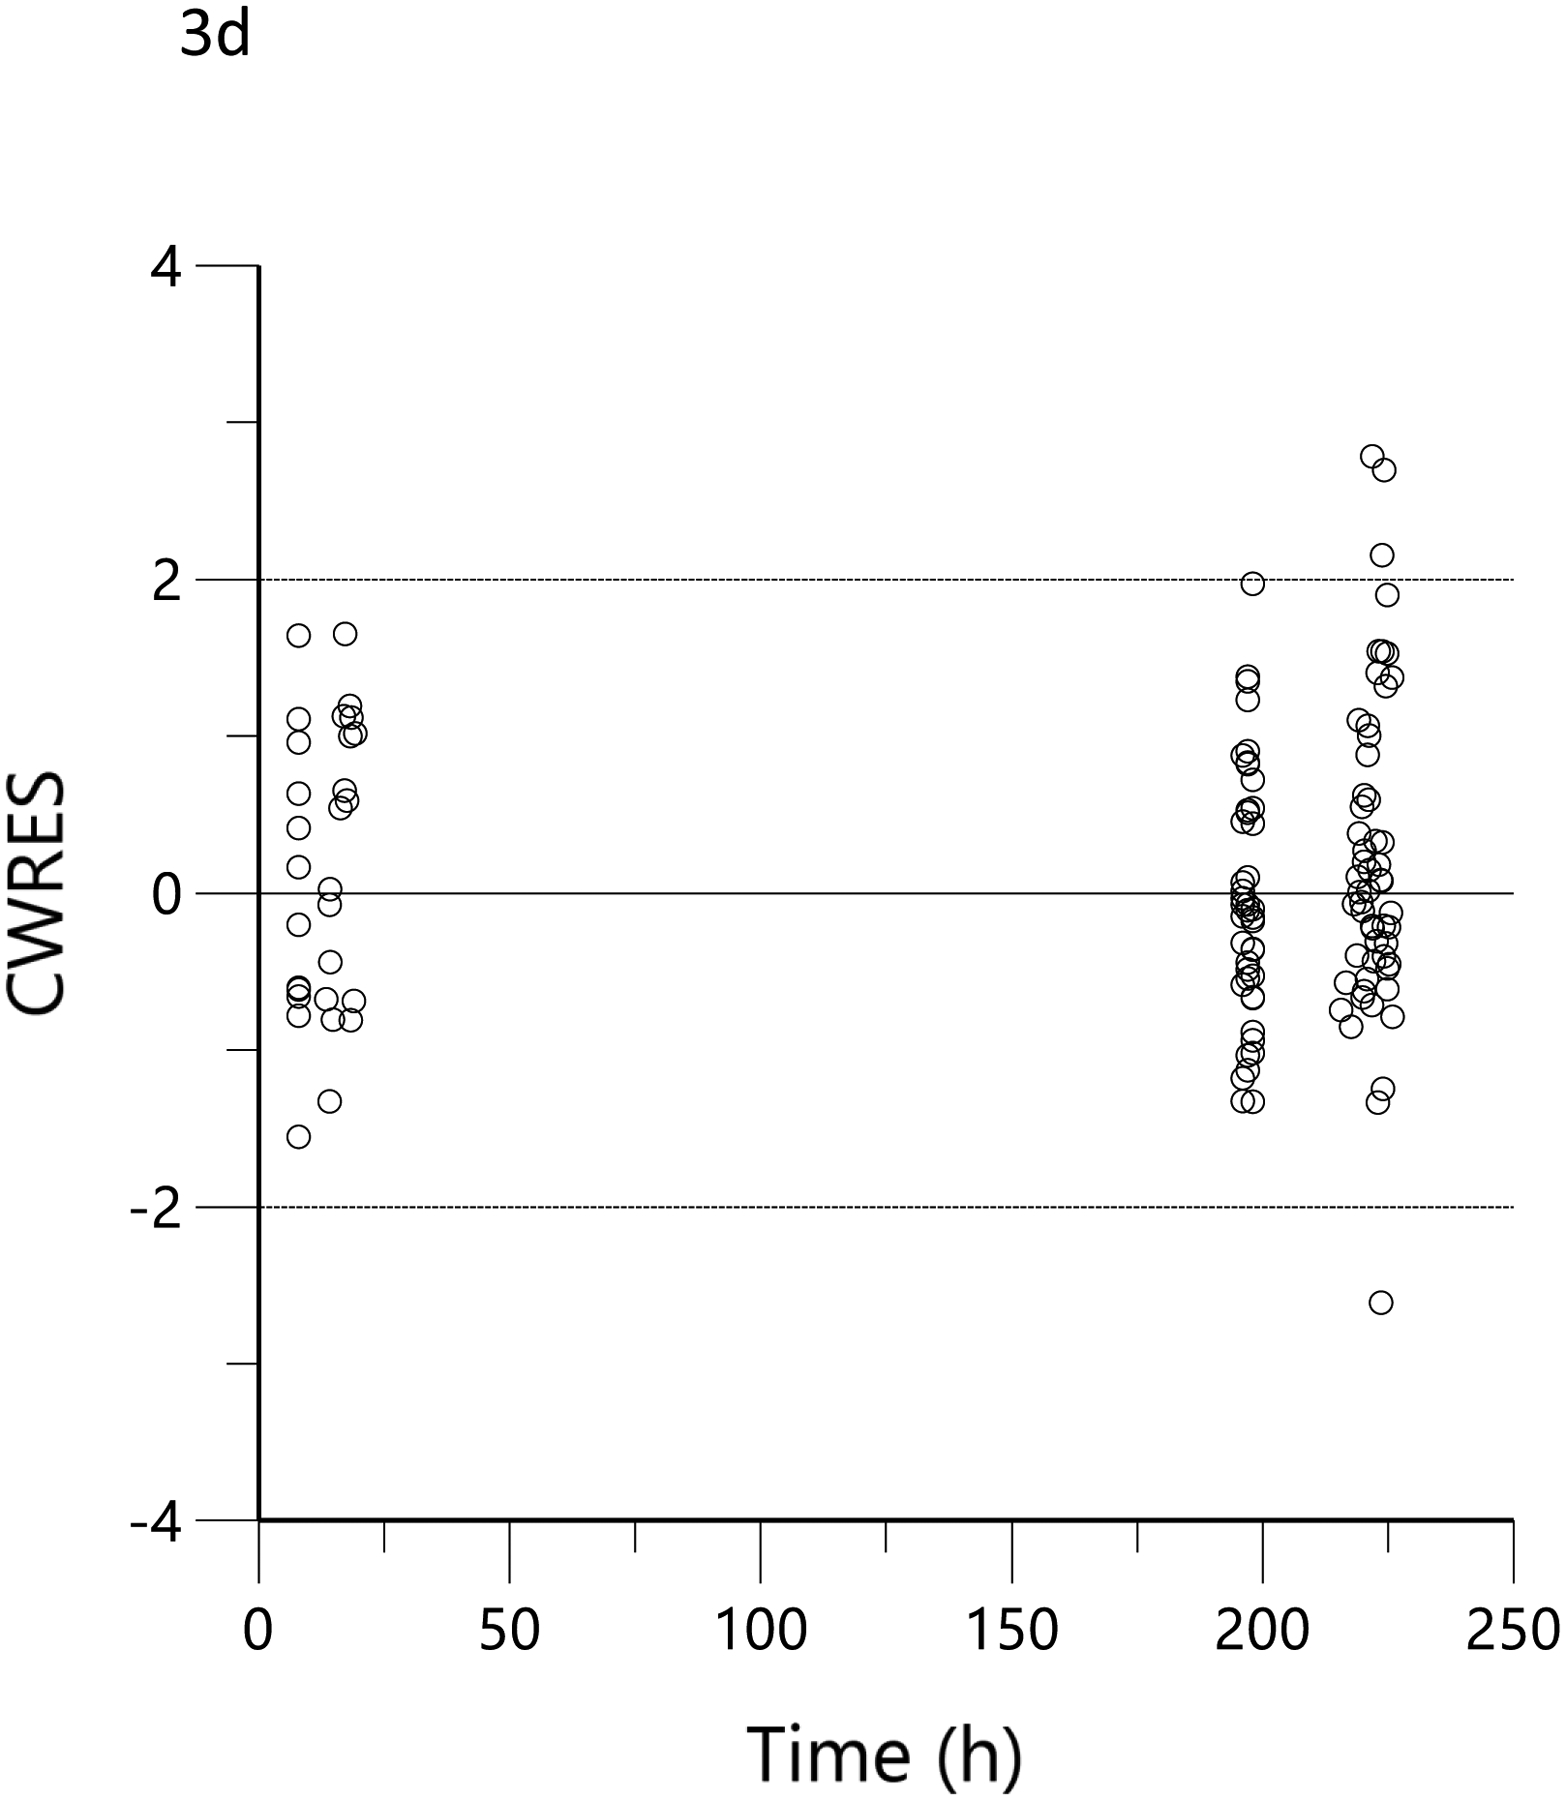
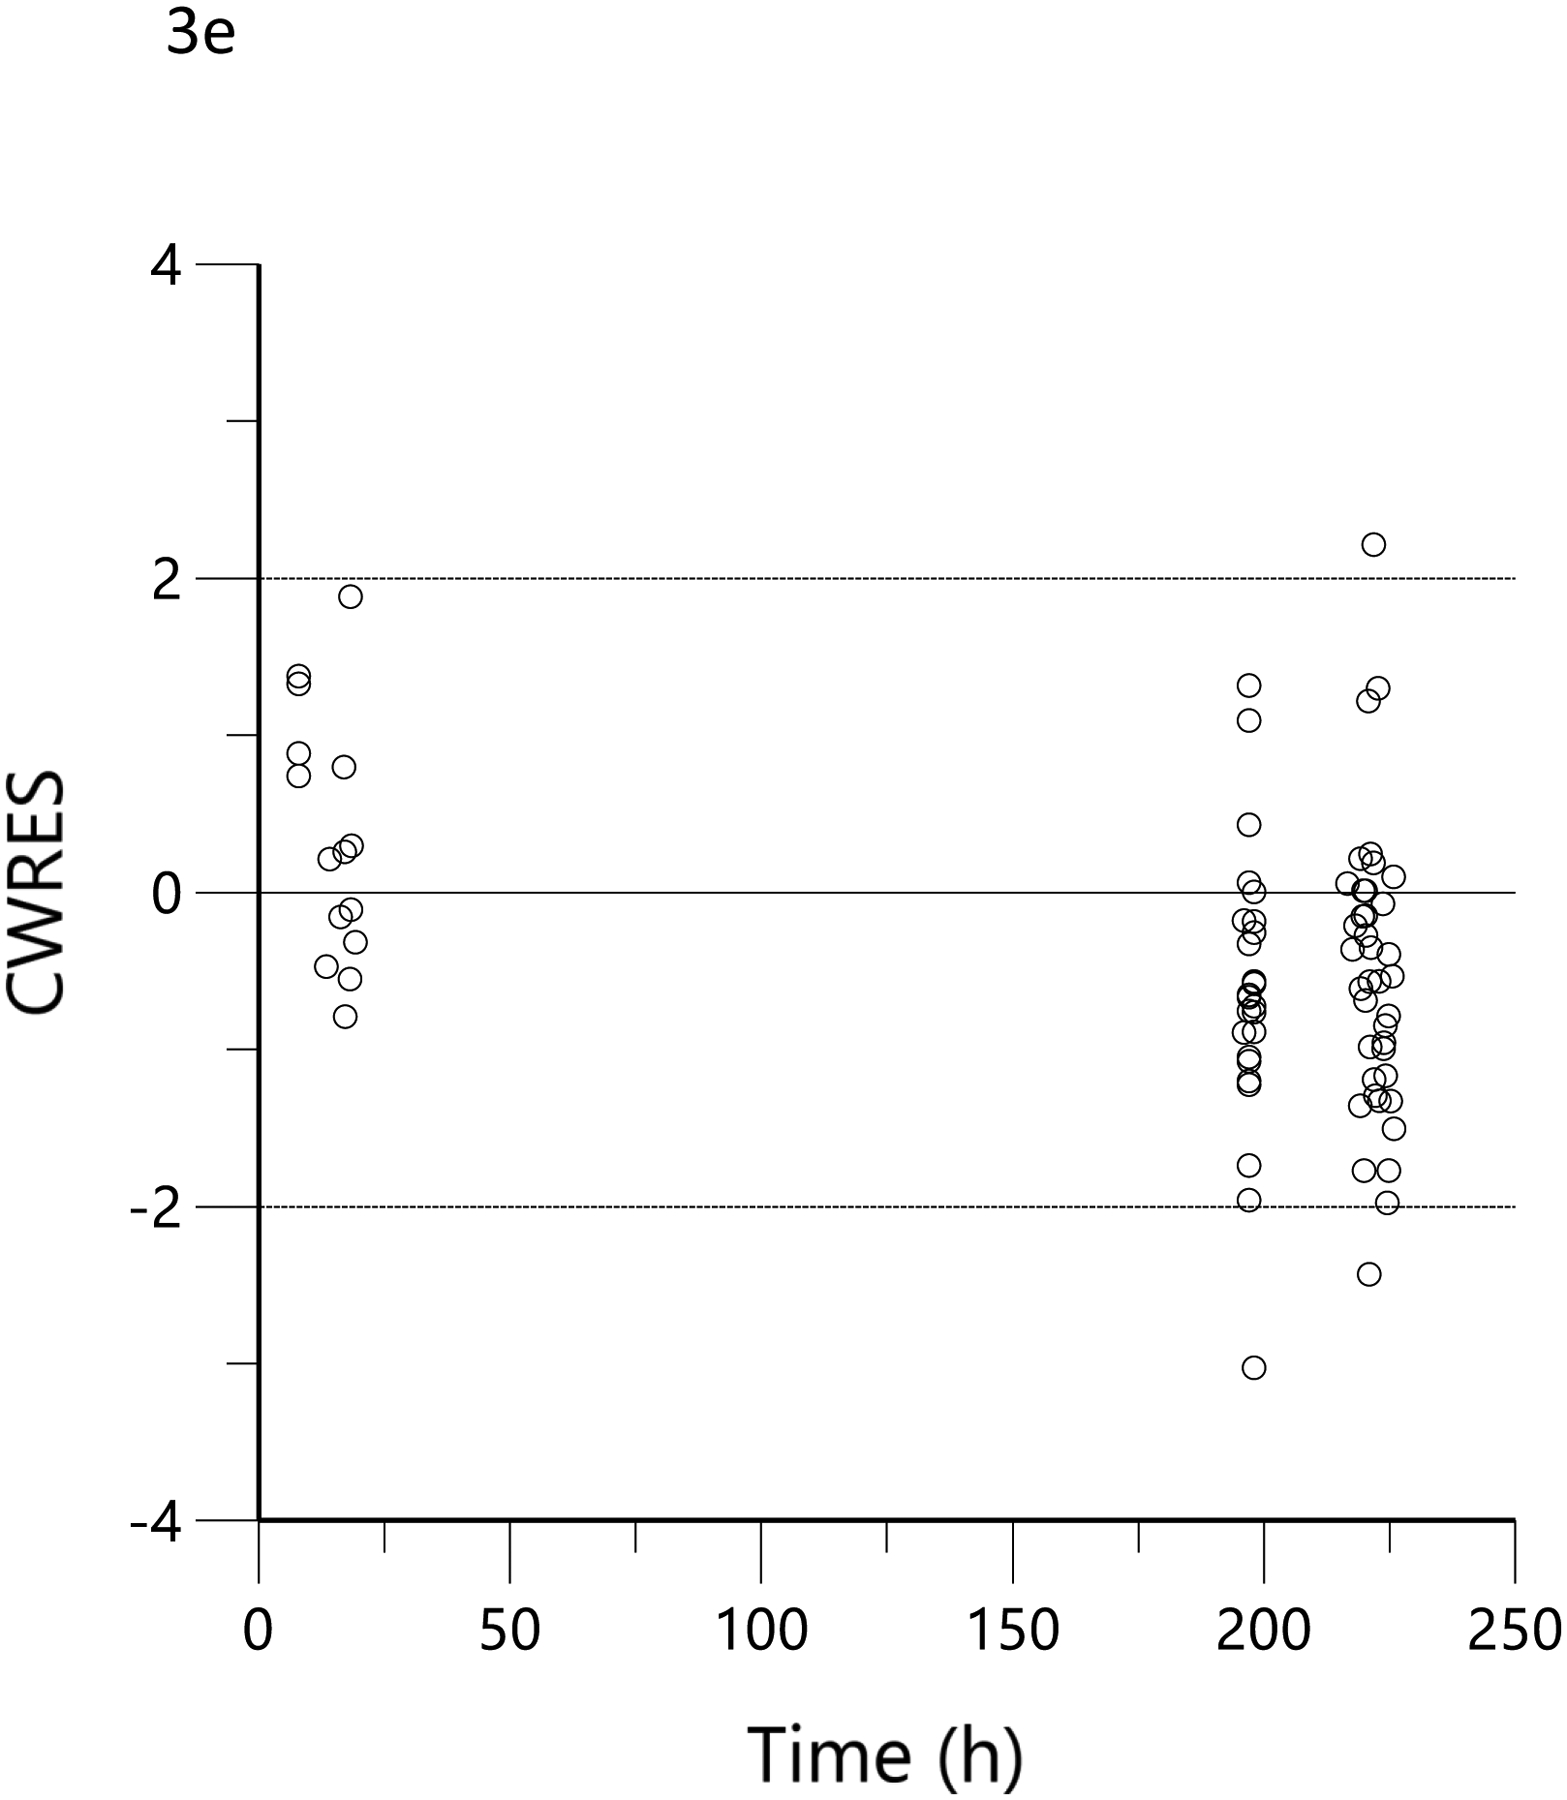
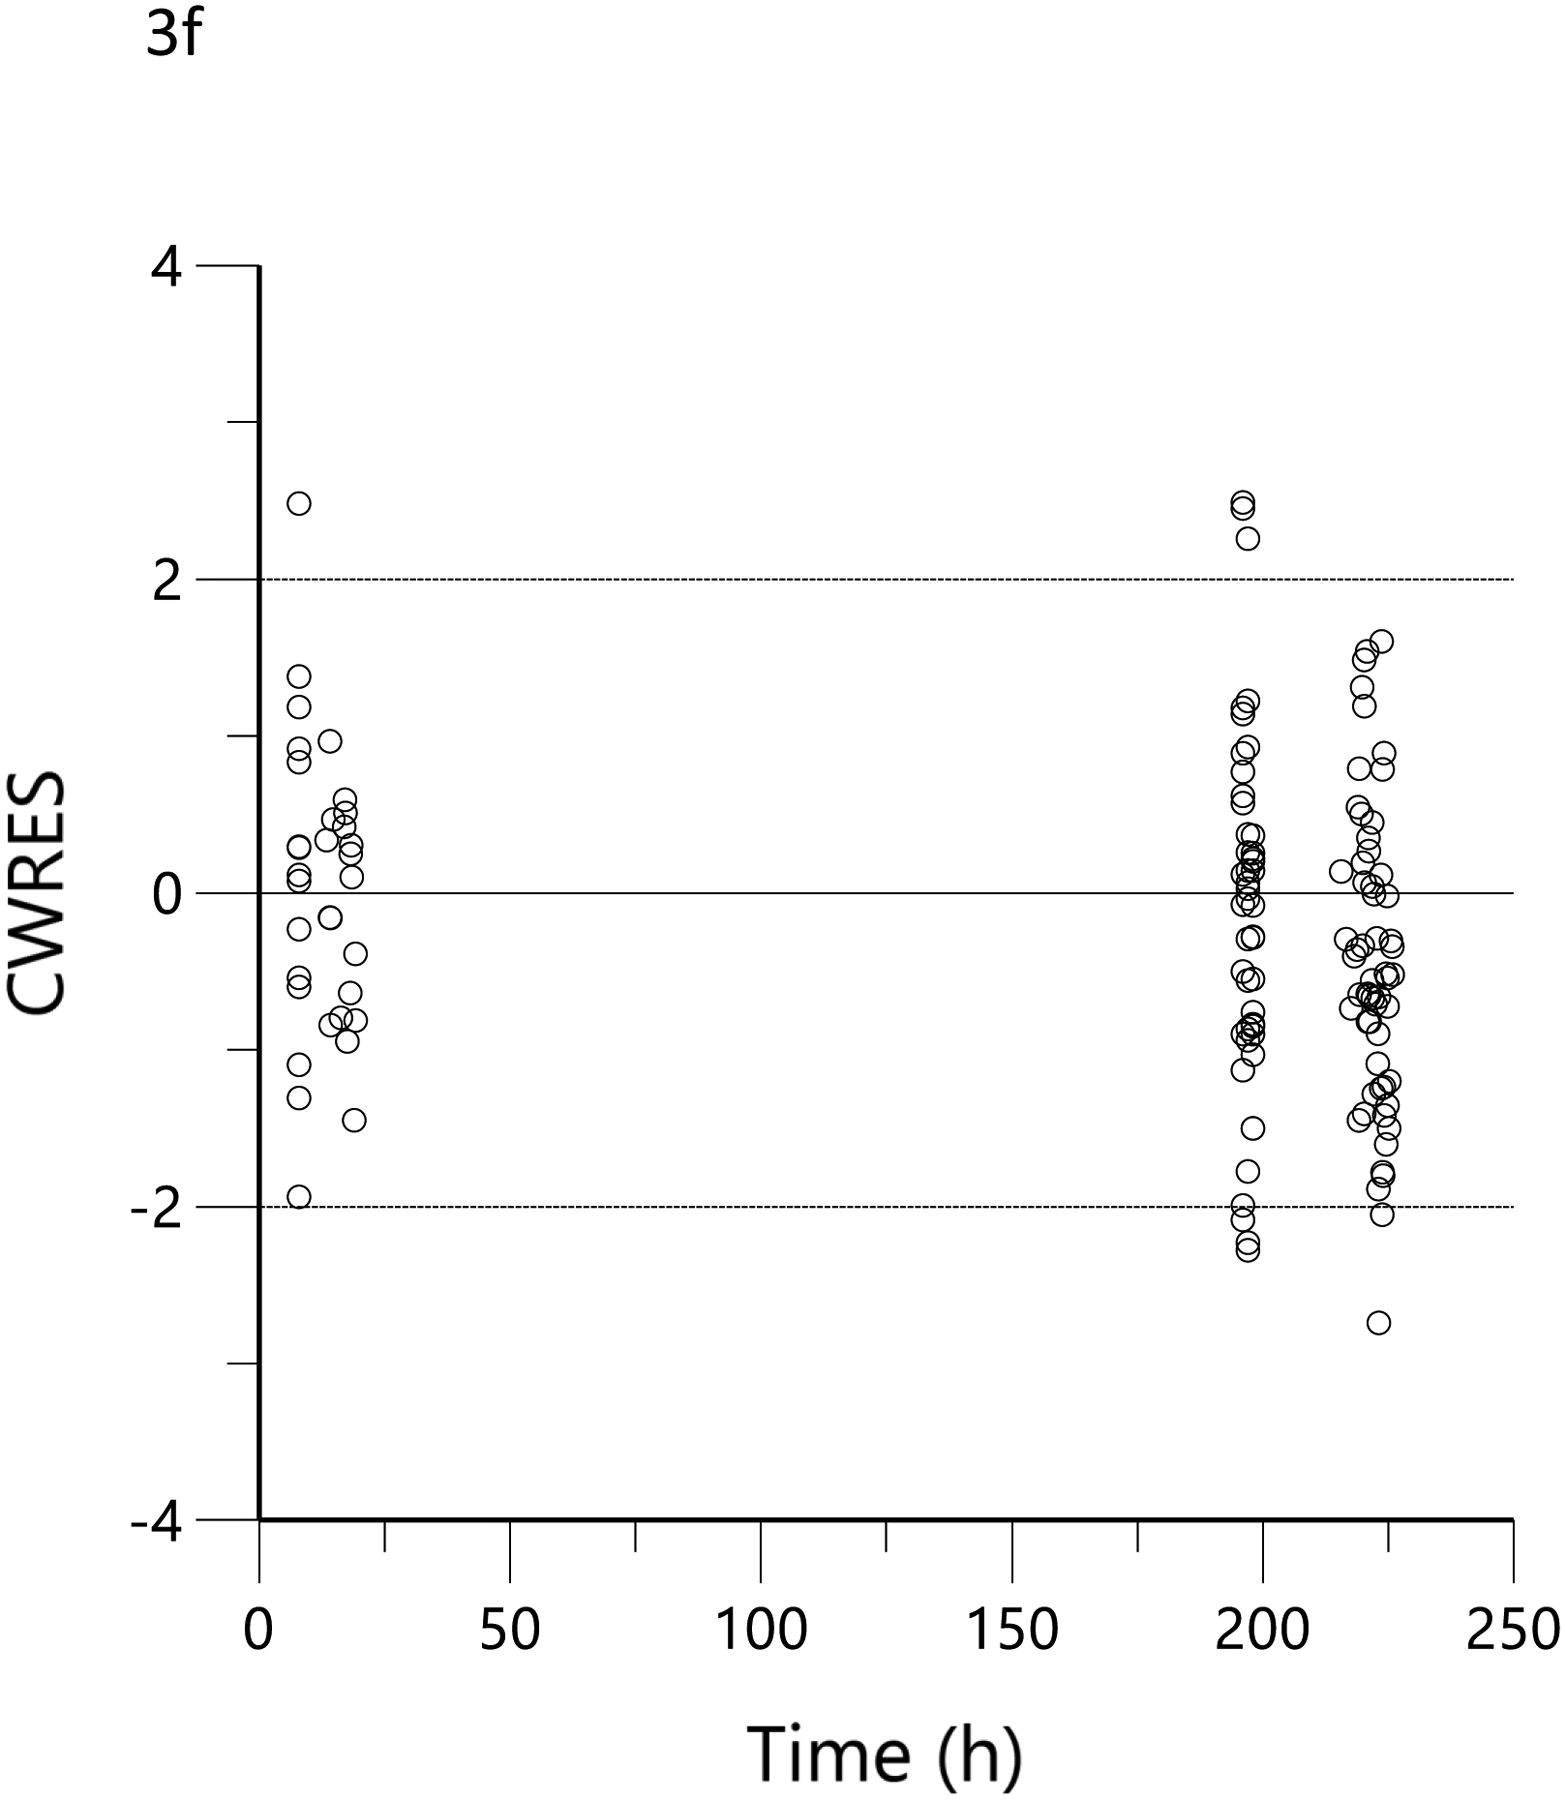
Conditional weighted residual (CWRES) versus predicted concentration for THC (a), 11-OH-THC (b) and THCCOOH (c) and versus time for THC (d), 11-OH-THC (e), and THCCOOH (f). Red lines are the locally weighted scatterplot smoothing (LOWESS) lines for the absolute residuals and its mirror. The blue line is the locally weighted scatterplot smoothing at the 50th percentile.
COMPARISON OF MODEL-ESTIMATED VERSUS QUESTIONNAIRE AND WEIGHED DOSES
The mean±SD individual predicted bioavailable daily consumption at (1) recruitment (i.e., Fbaseline) was 21.3.±21.8 mg, and for the one-week interval between recruitment and the ad libitum smoking event and (2) the bioavailable amount smoked during the residence smoking event (i.e., Fresidence) was 7.2±6.8 mg. The time between the start of ad libitum smoking and the first blood sample collected in the mobile lab was estimated to be 14.0±2.8 min, and the calculated duration of smoking was 3.01±2.44 min. In addition, the MCQ-predicted daily THC consumption at baseline (corrected for assumed bioavailability of 25%) was 22.6±24.1 mg and the THC at ad libitum dose, based on the weight and bioavailability of the product burned, was 13.9±11.1 mg for all subjects, while it was 12.1±9.8 mg in the 16% THC group (n=18) and 15.7±12.3 mg in the 24% THC group (n=18) (p=0.43).
The subjects’ reported typical consumption at baseline, based on the MCQ, were plotted against the daily consumption estimated by the model based on measured THC, 11-OH-THC, and THCCOOH plasma concentrations at the time of enrollment. Figure 4a shows the linear regression relationship of model-estimated daily dose versus typical use obtained by MCQ. The correlation coefficient was 0.79 (R2=0.62, p<0.05), the slope was 0.86, indicating good agreement between the MCQ estimate of dose and the pharmacokinetic-model estimated dose. To further assess the agreement between these two methods of estimating an individual’s THC exposure or daily dose, Bland-Altman analysis was employed to evaluate the limits of agreement by plotting the differences between the measurements against their means. (33) Figure 4b shows the Bland-Altman plot for the MCQ and PK estimates of the daily dose. Note that there is only a very small positive bias relative to the MCQ estimate and a clear trend of this bias with increasing values. Figure 4c displays the same data as Figure 4b but plotted as a percentage of the differences. The mean difference (bias) was −5.0% with near-uniform scatter for all values. Both Bland-Altman plots indicated that estimates of daily dose for smokers of cannabis were similar, whether using a detailed questionnaire or a population pharmacokinetic model. Figure 4d shows the linear regression of the relationship between the model-estimated dose for the ad libitum residence smoking event and the THC consumption calculated from the weighed difference of the cannabis product before and after smoking. The correlation coefficient was 0.71 (R2=0.5, p<0.05) with a slope of 1.3, indicating that the predicted bioavailability dose was less than would be assumed from the weight of the smoked cannabis. A further examination of the agreement between these two methods by Bland-Altman analysis is displayed in Figure 4e and Figure 4f. There is both a positive bias of the weighed versus PK-estimated dose and a clear proportional trend (33) with increasing bias for larger doses (Figure 4e). Figure 4f indicates that the mean bias (difference) was 65.7%.
Figure 4.
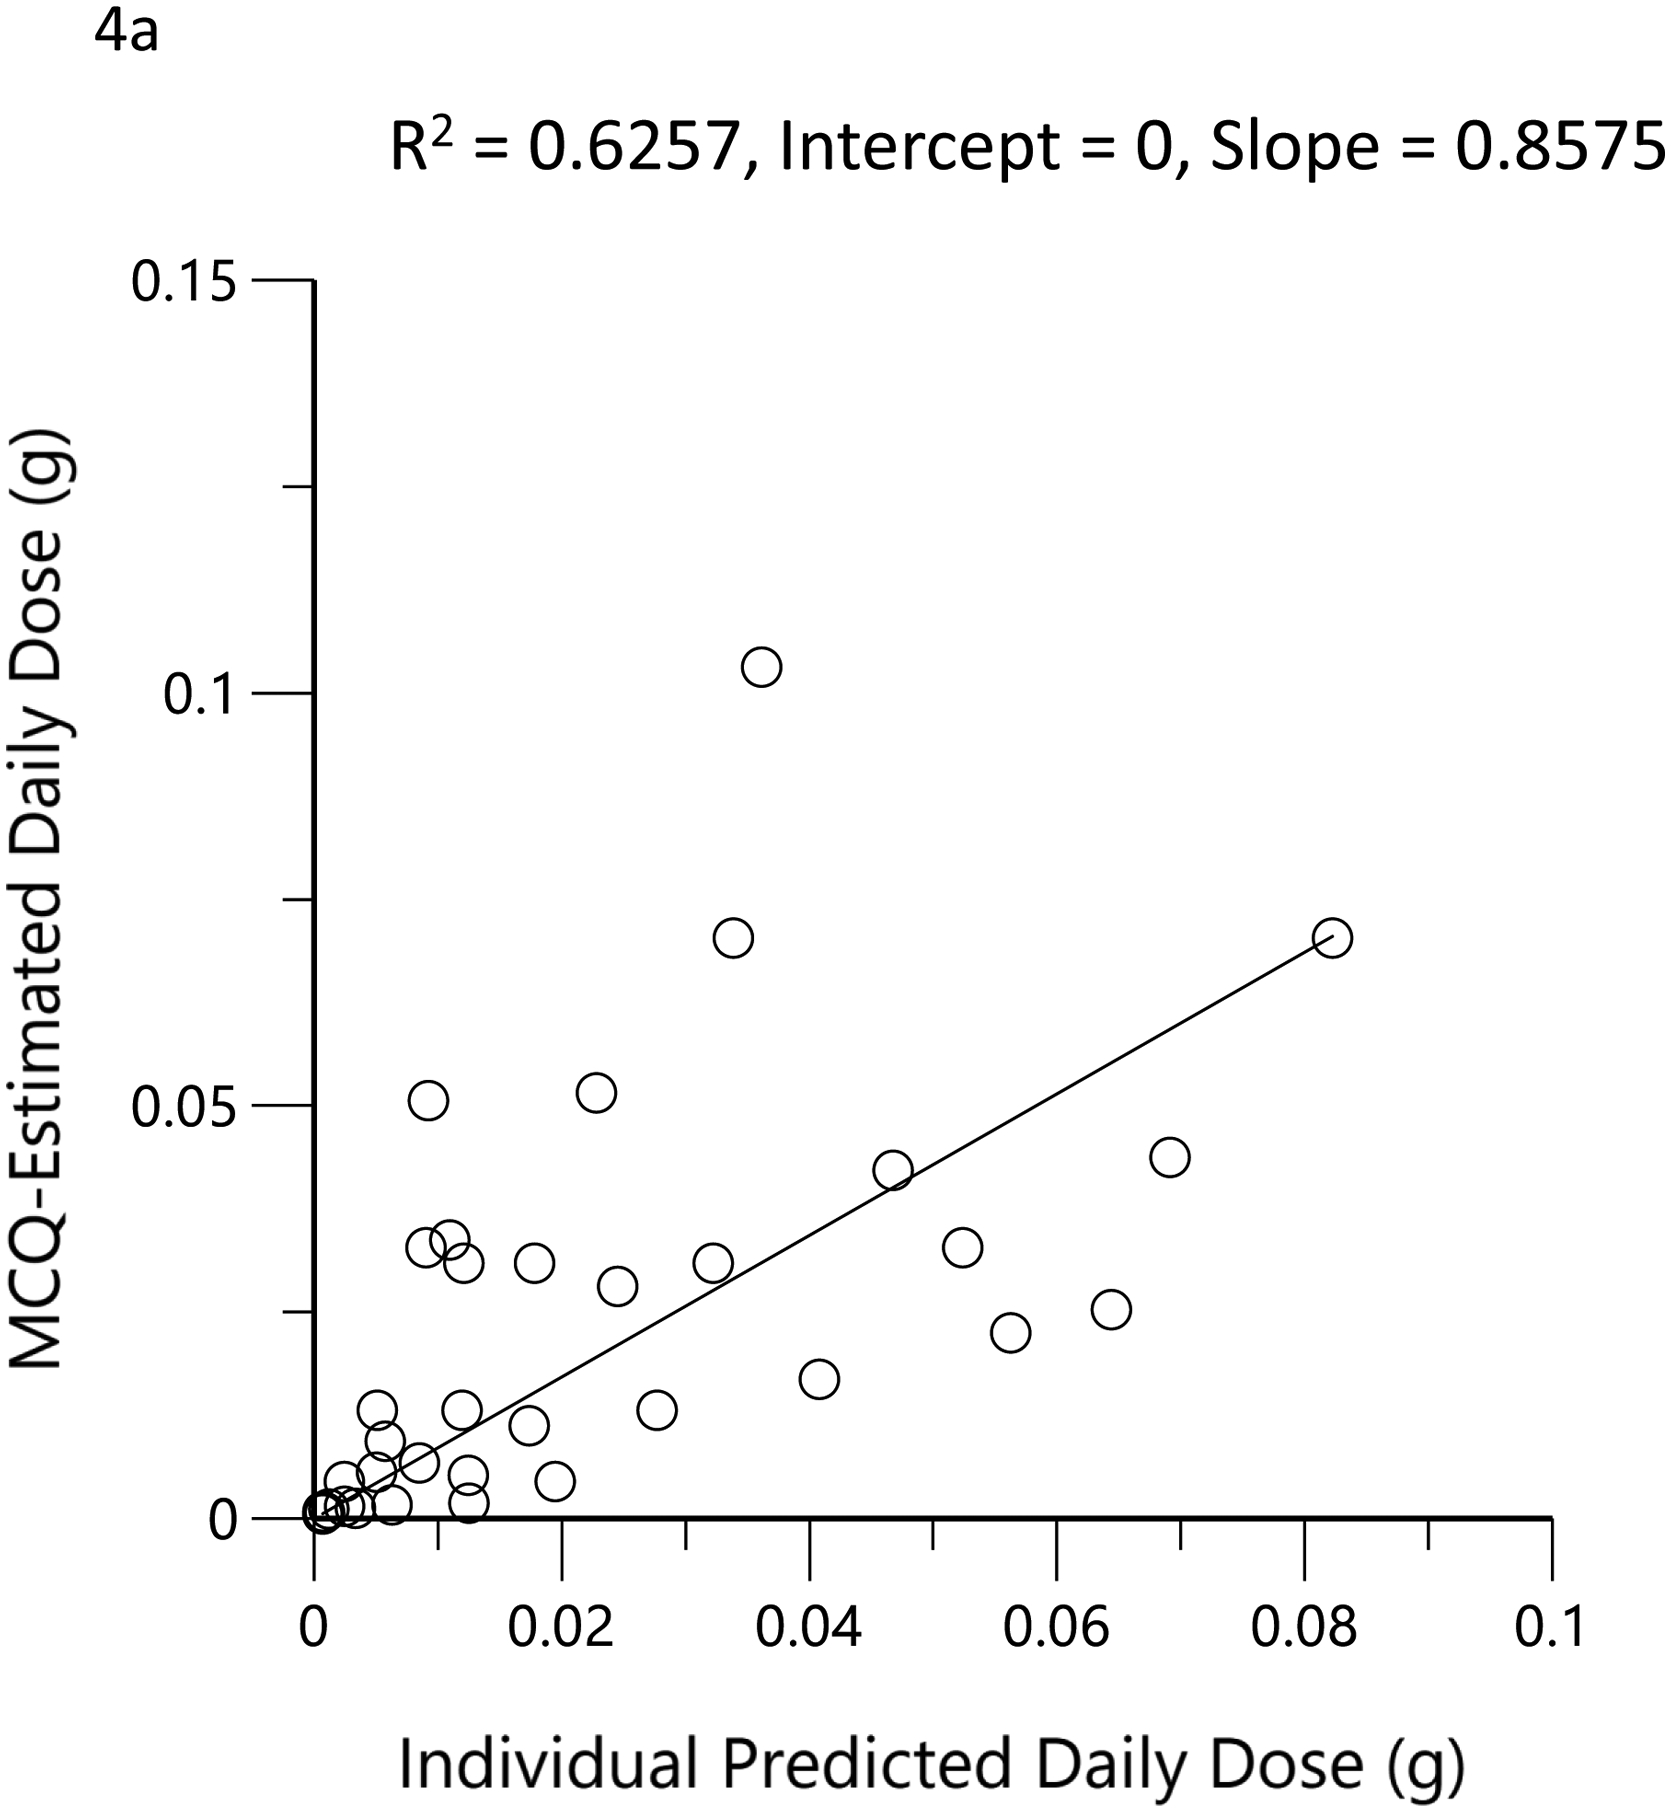
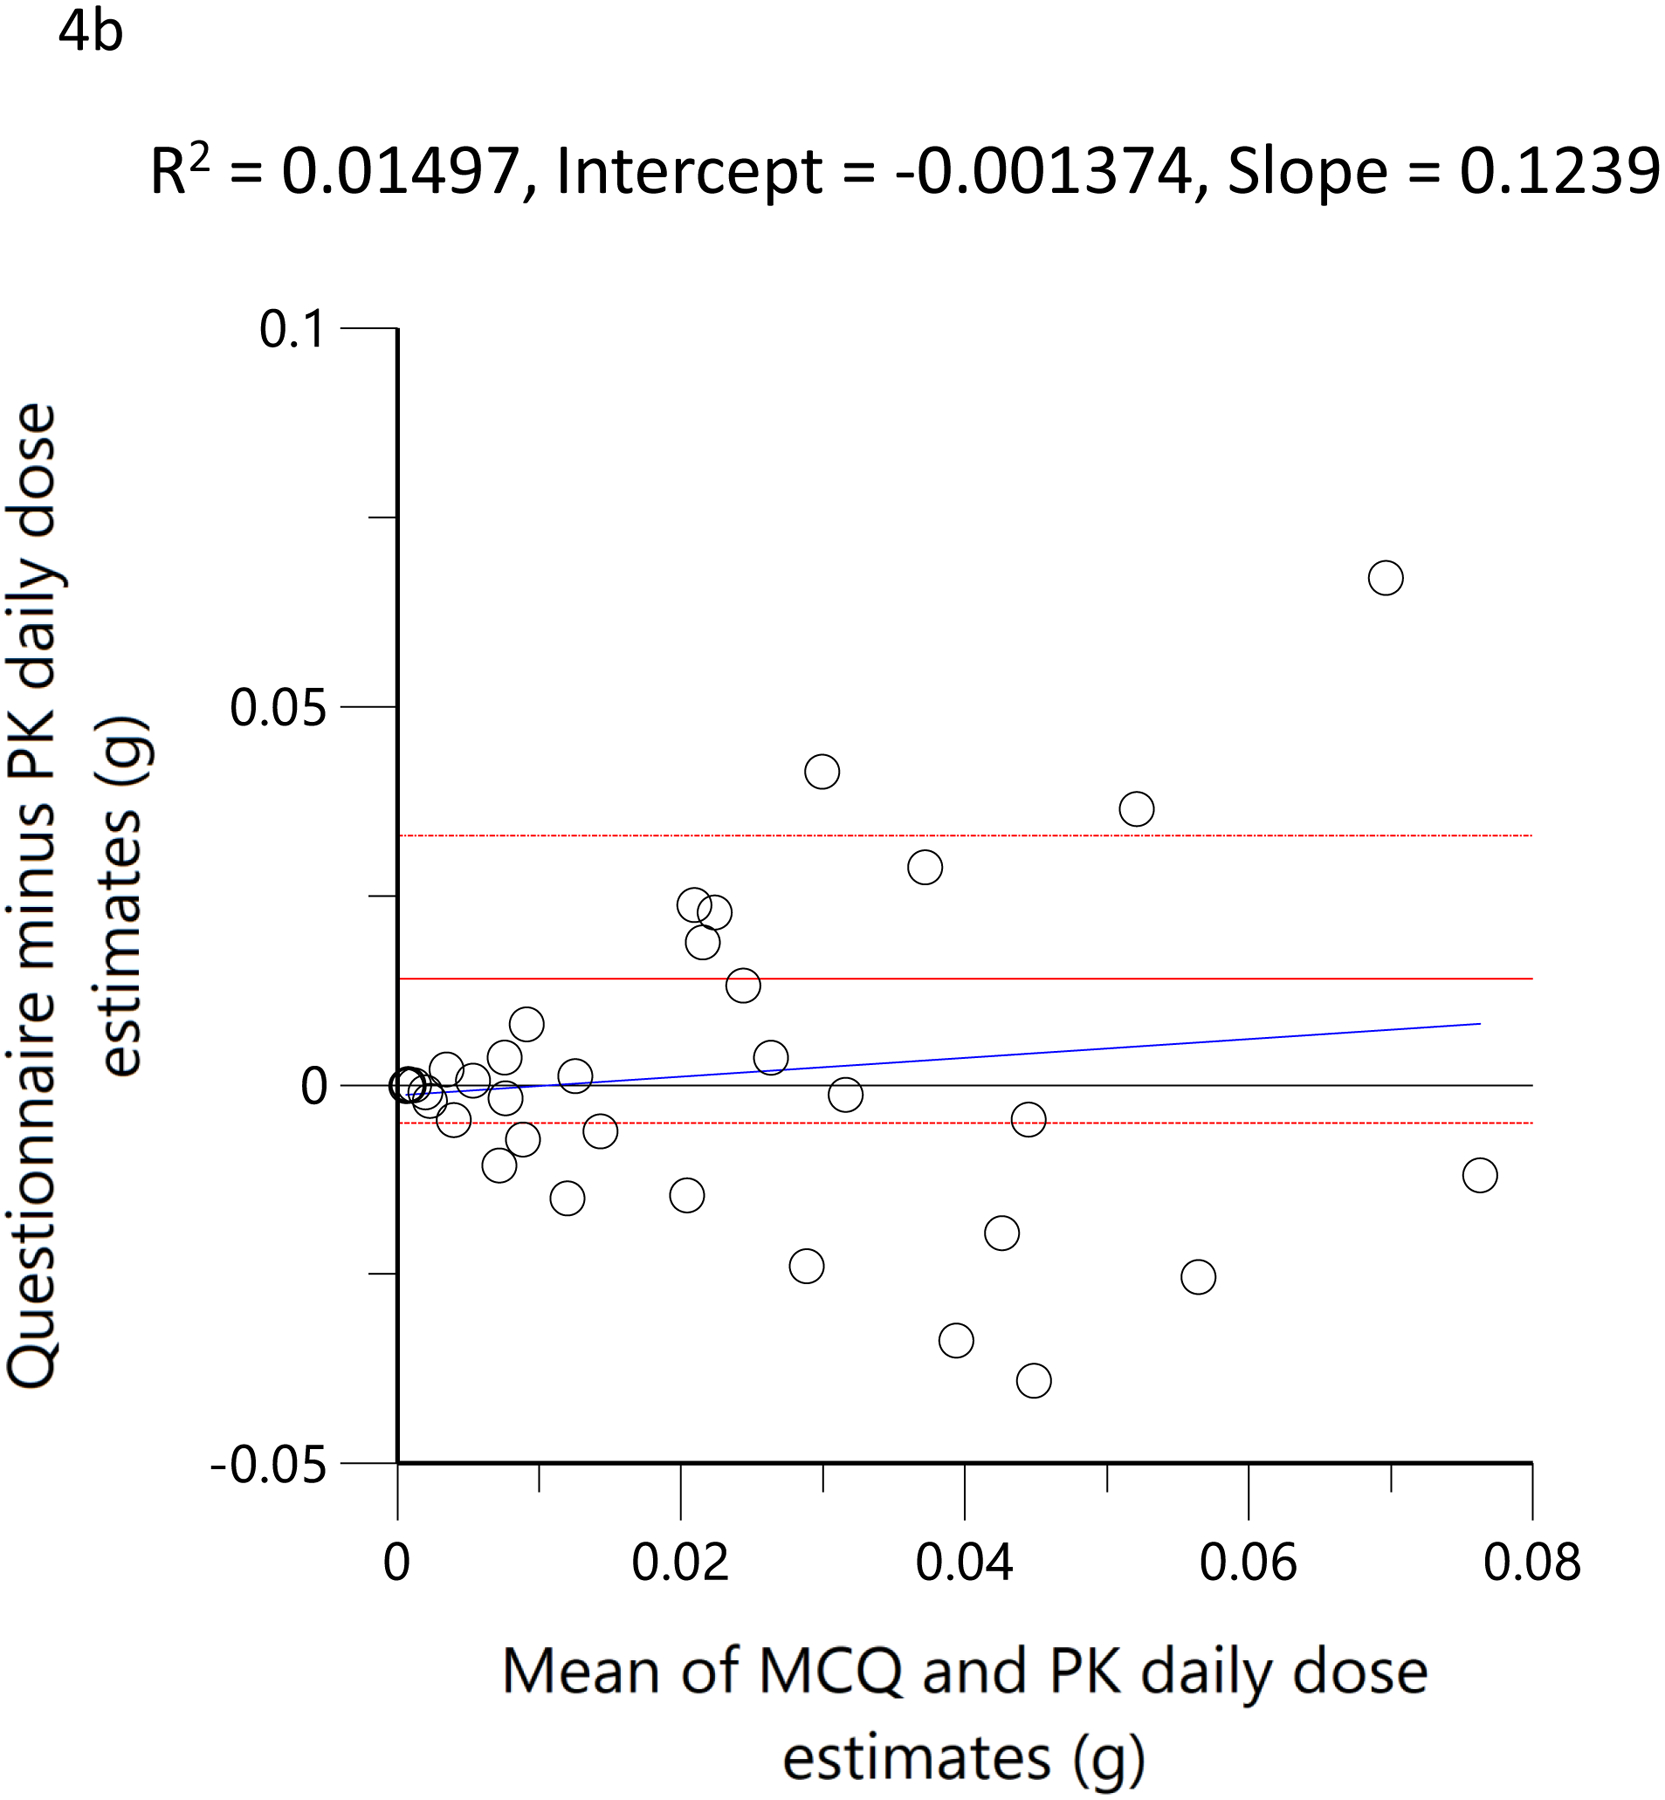
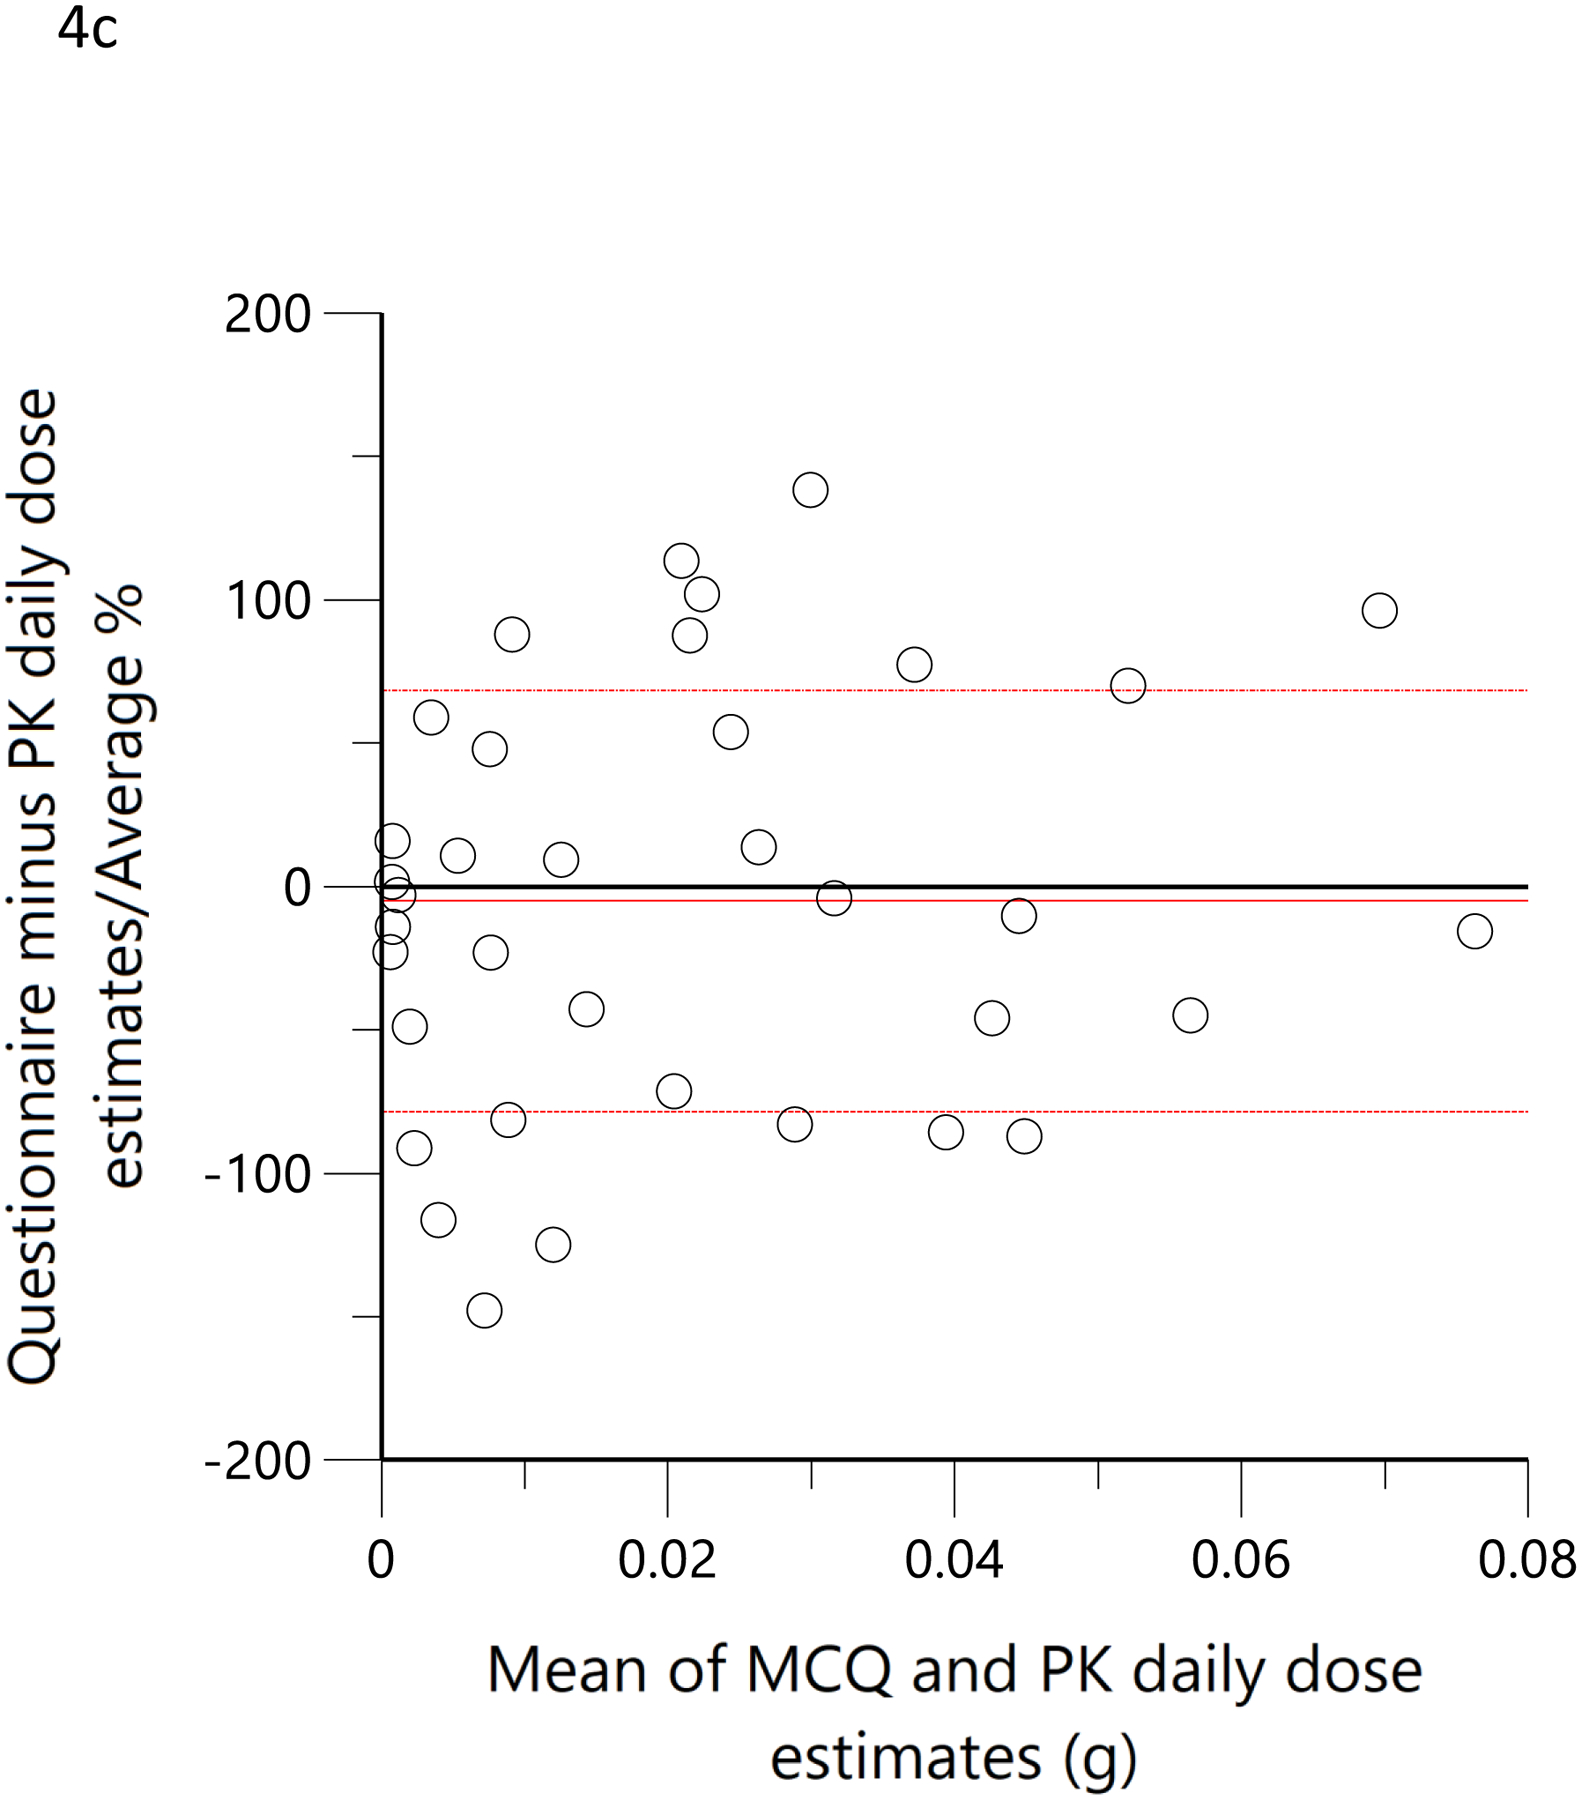
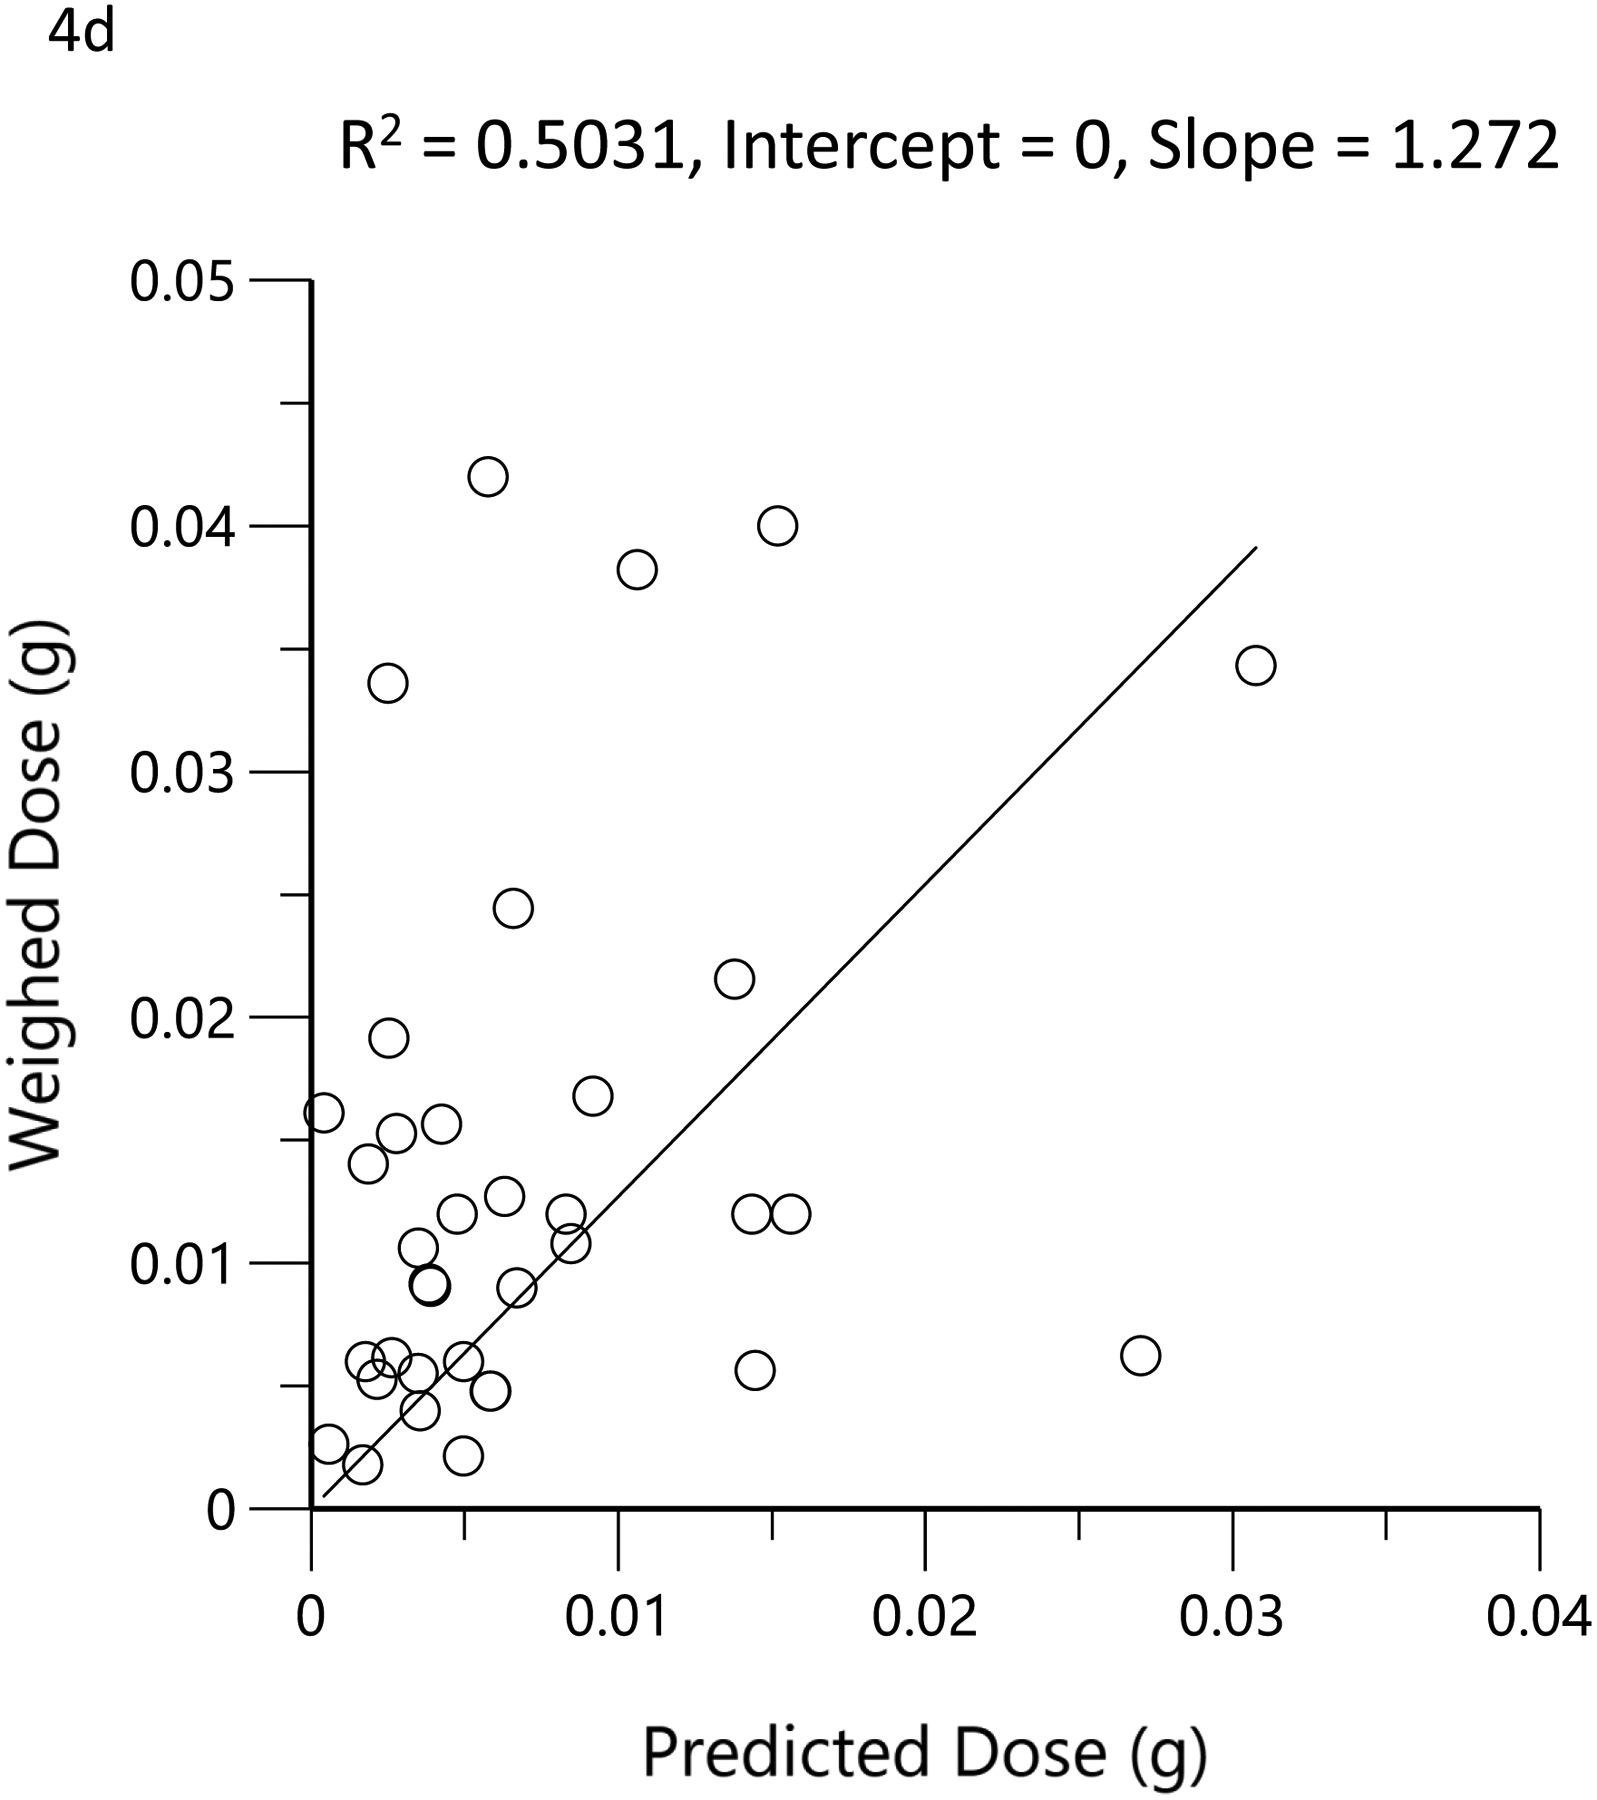
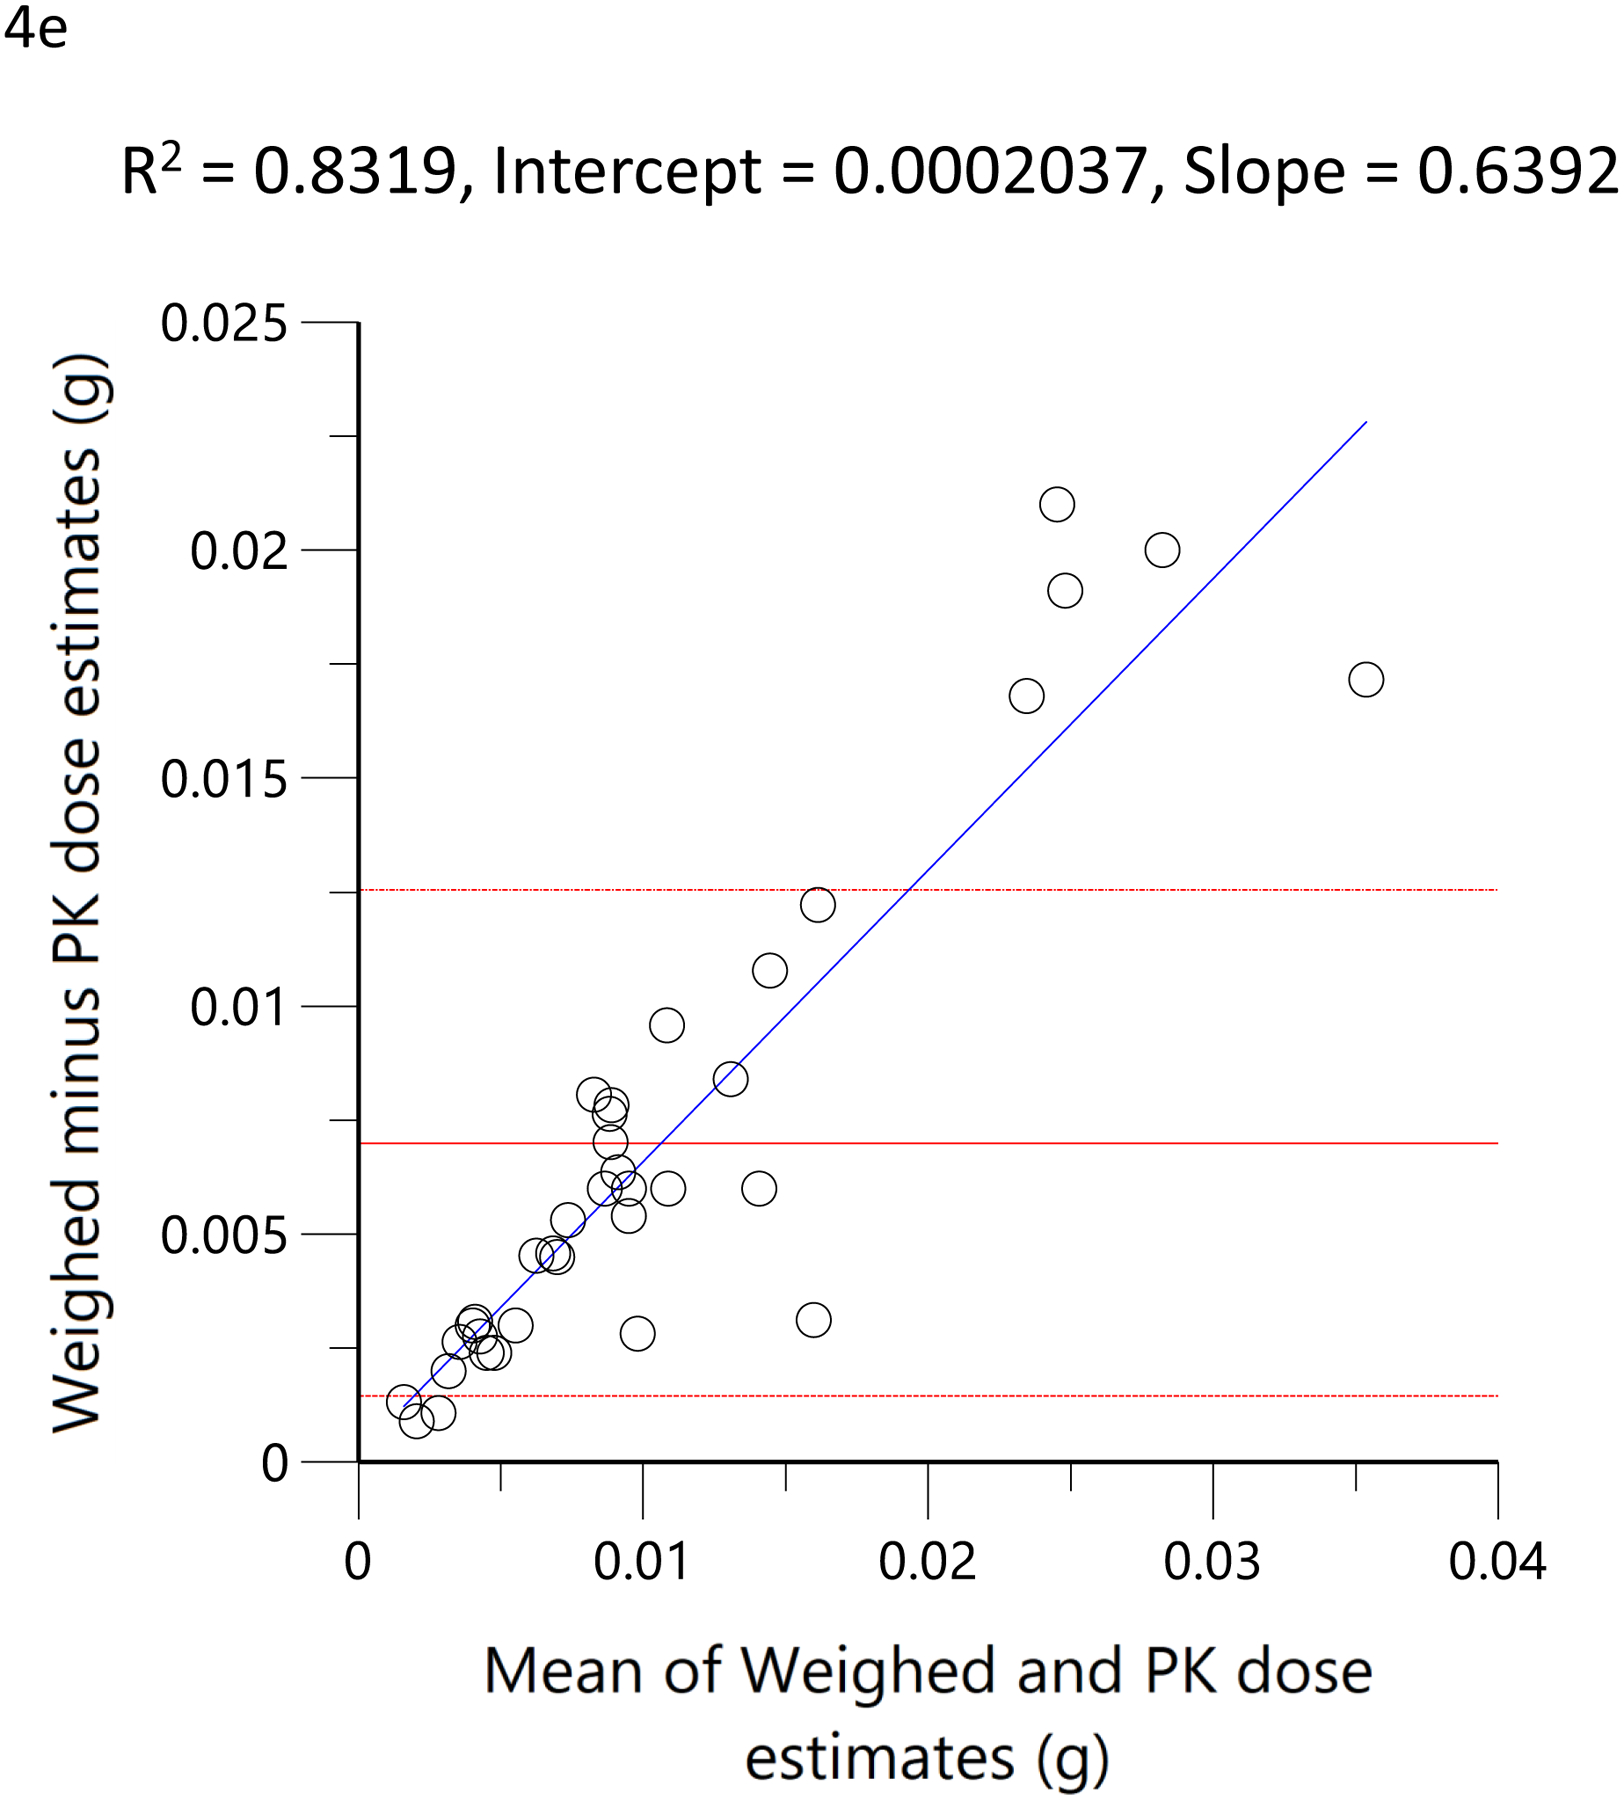
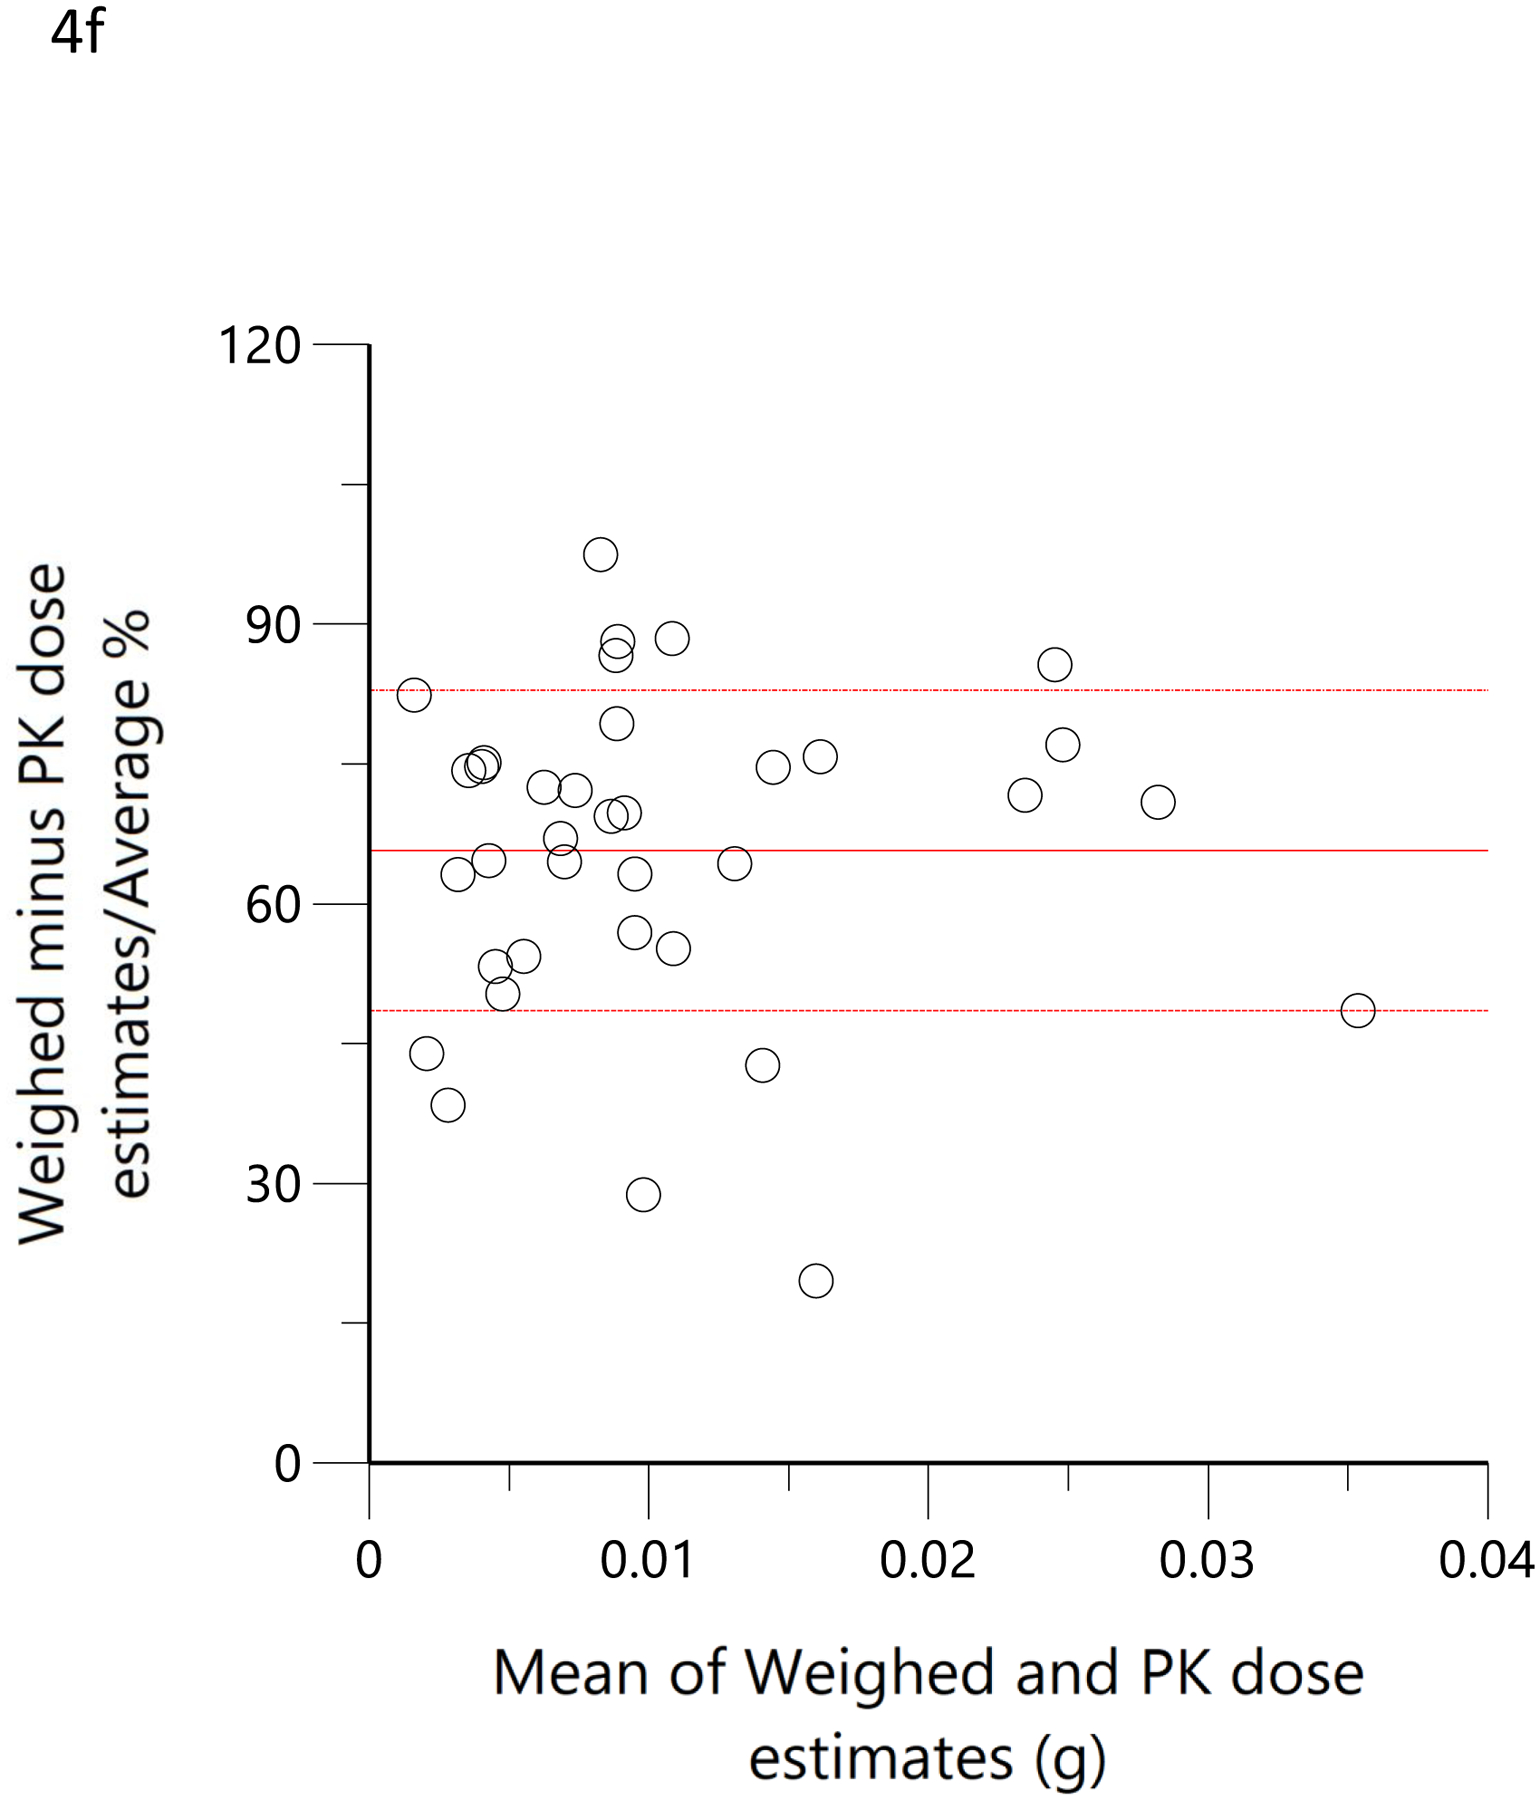
Scatterplots (open circles) of (a) each individual’s model-predicted daily THC dose (g/day) versus their cannabis consumption questionnaire (MCQ)-derived daily THC dose (g/day), (d) THC dose (g) during the ‘in home’ smoking event versus the THC dose (g), calculated as the difference between the weighed amount of cannabis to be consumed (corrected for the assigned THC content) and the weight of the remaining cannabis product brought back to the mobile lab. The black lines are the linear regressions. Bland-Altman plots of differences between MCQ- and PK-estimated doses versus the mean of the two estimates (b). The solid red line is the mean difference with the dotted red lines as standard deviation. The blue line is the regression of the differences versus the means. (c) Differences expressed as percentages of the estimated values versus the mean of the two estimates. The solid red line is the mean difference (bias) with the dotted red lines as standard deviation. Bland-Altman plots of differences between weighed amount- and PK-estimated doses versus the mean of the two estimates (e). The solid red line is the mean difference with the dotted red lines as standard deviation. The blue line is the regression of the differences versus the means. (f) Differences expressed as percentages of the estimated values versus the mean of the two estimates (f). The solid red line is the mean difference (bias) with the dotted red lines as standard deviation.
INCORPORATING QUESTIONNAIRE AND WEIGHED DOSE INTO THE POPULATION PHARMACOKINETIC MODEL
The −2 log-likelihood for the final model prior to the introduction of the covariates for estimated dose was 2497 and was 2436 and 2470 after inclusion of the self-report and weighed dose, respectively, and separately, on the estimates of Fbaseline and Fresidence. Thus, each covariate alone well-exceeded the decrease of 6.63 statistical requirement at the p<0.01 level for their inclusion as covariates in the model. Taken together, the −2 log-likelihood was 2432, which also exceeded the decrease of the 13.26 statistical requirement at the p<0.01 level for inclusion of both covariates. The addition of the questionnaire data as a covariate for Fbaseline reduced its interindividual variability (ω2) from 1.81±0.47 to 0.62±0.10. Likewise, the addition of the covariate for weighed dose reduced the interindividual variability (ω2) of Fresidence from 0.91±.23 to 0.80±0.23. The mean model-estimated, bioavailable THC dose for the ad libitum residence smoking event was 28.3 mg and the mean weighed dose was 55.7 mg, corresponding to an estimated 14% bioavailability of the ‘burned’ cannabis during ad libitum use as opposed to approximately 25% bioavailability estimated from controlled trials with witnessed and computer-paced smoking of low THC content cannabis. (21, 25) The PK model-estimated typical daily THC dose in the current group of users, using the population pharmacokinetic model of the observational data, including the covariates for the MCQ and weighed dose data, at baseline was 85.1 mg/day, assuming steady-state and 25% bioavailability. These mean population pharmacokinetic-derived estimates are approximately 94% of the mean daily THC consumption (i.e., 90.4 mg) derived from the MCQ at recruitment. The visual predictive checks were performed as described and are presented in Figure 5.
Figure 5.
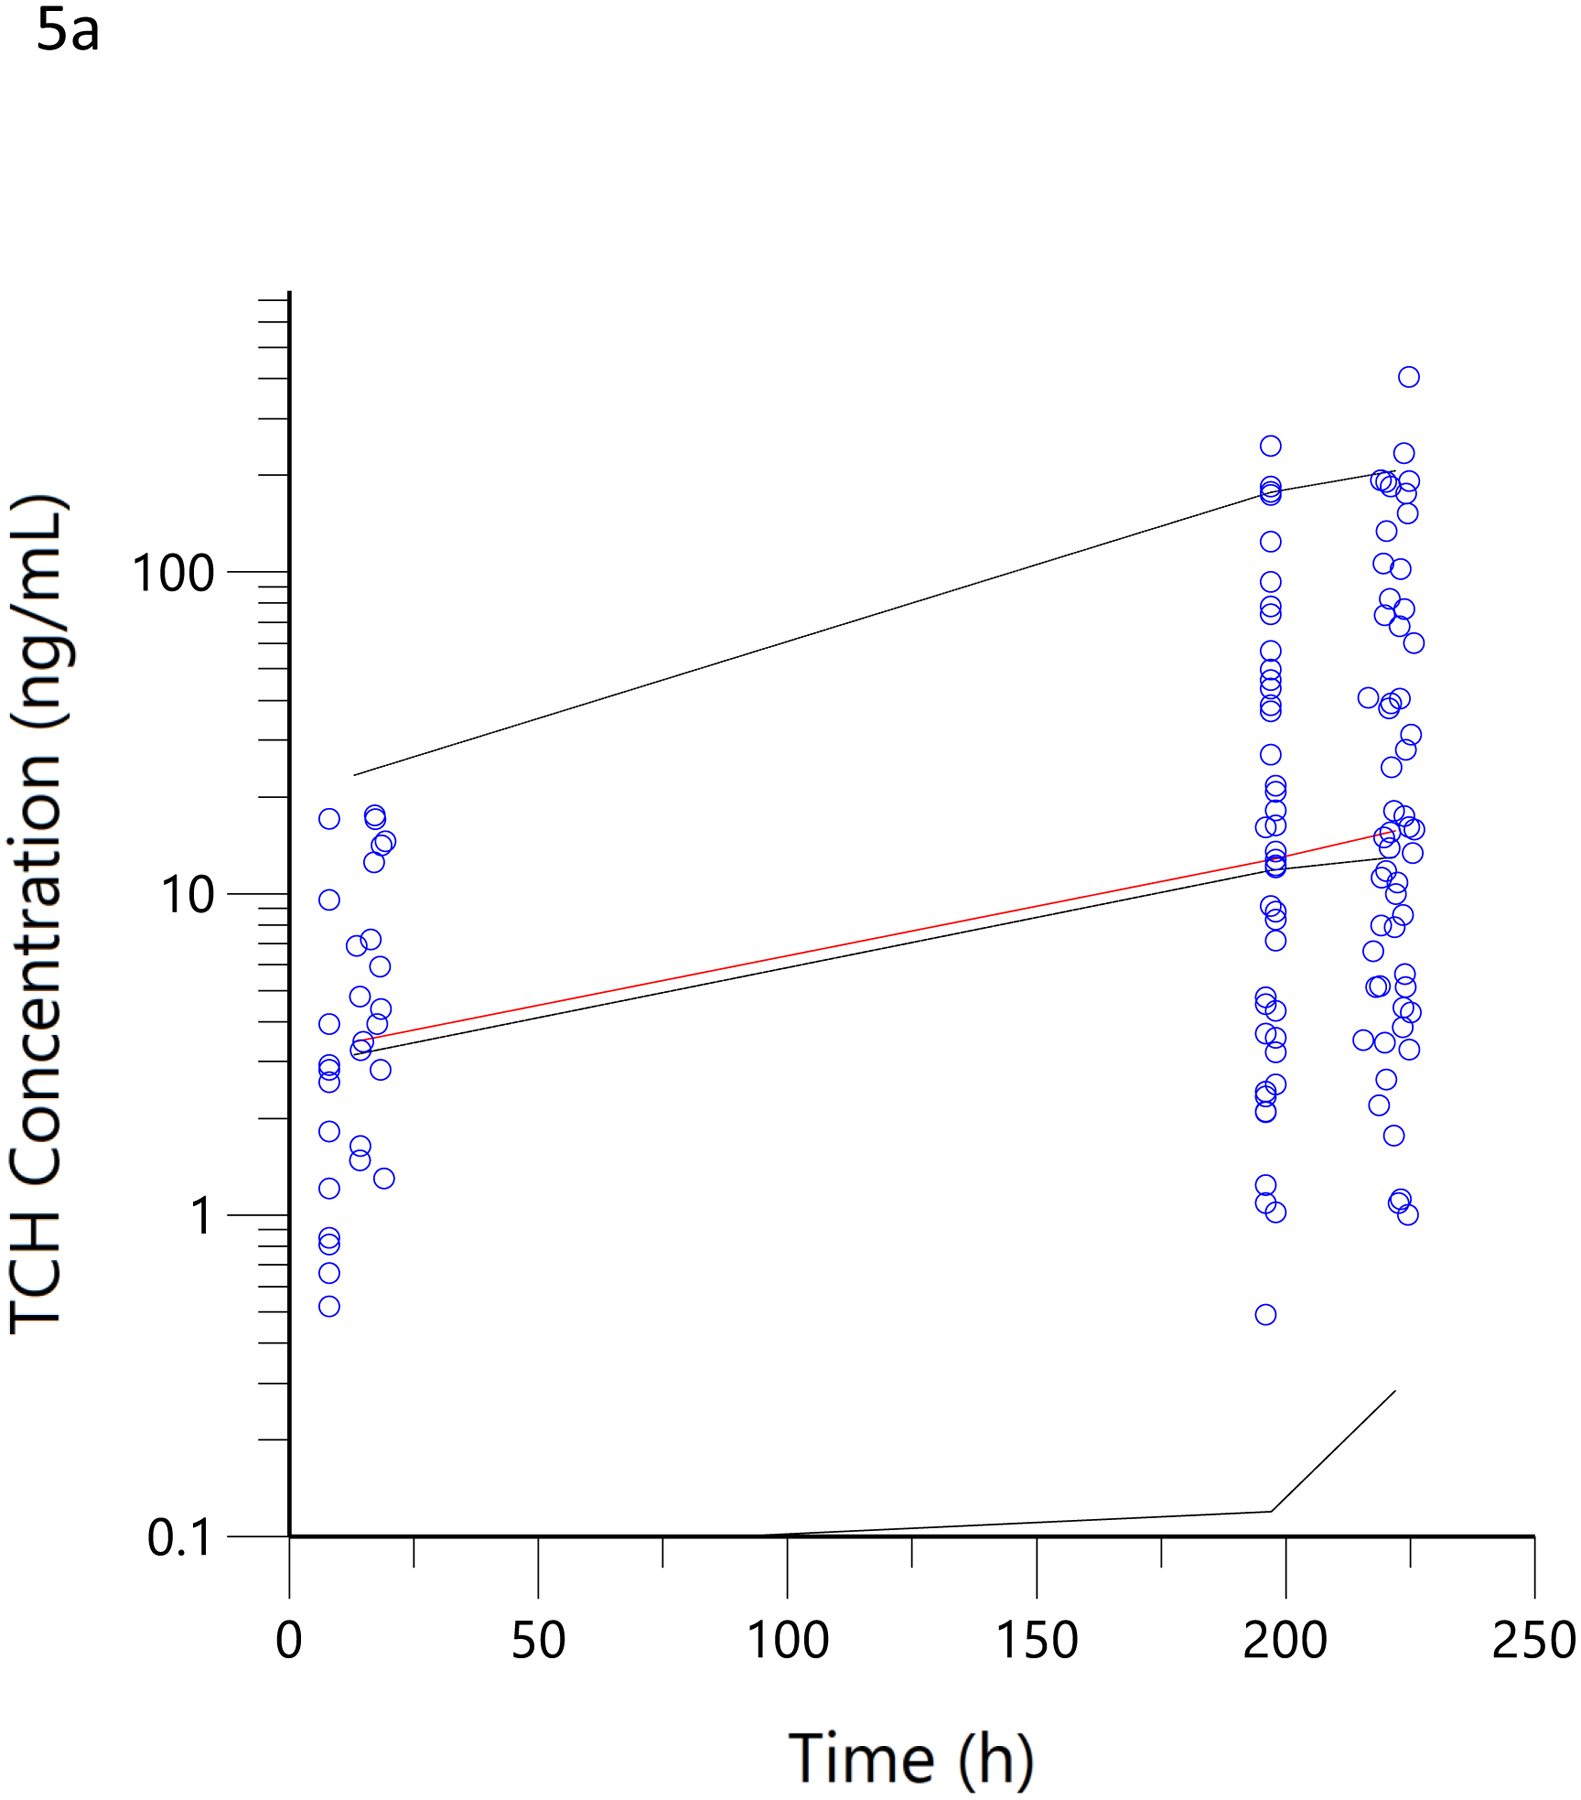
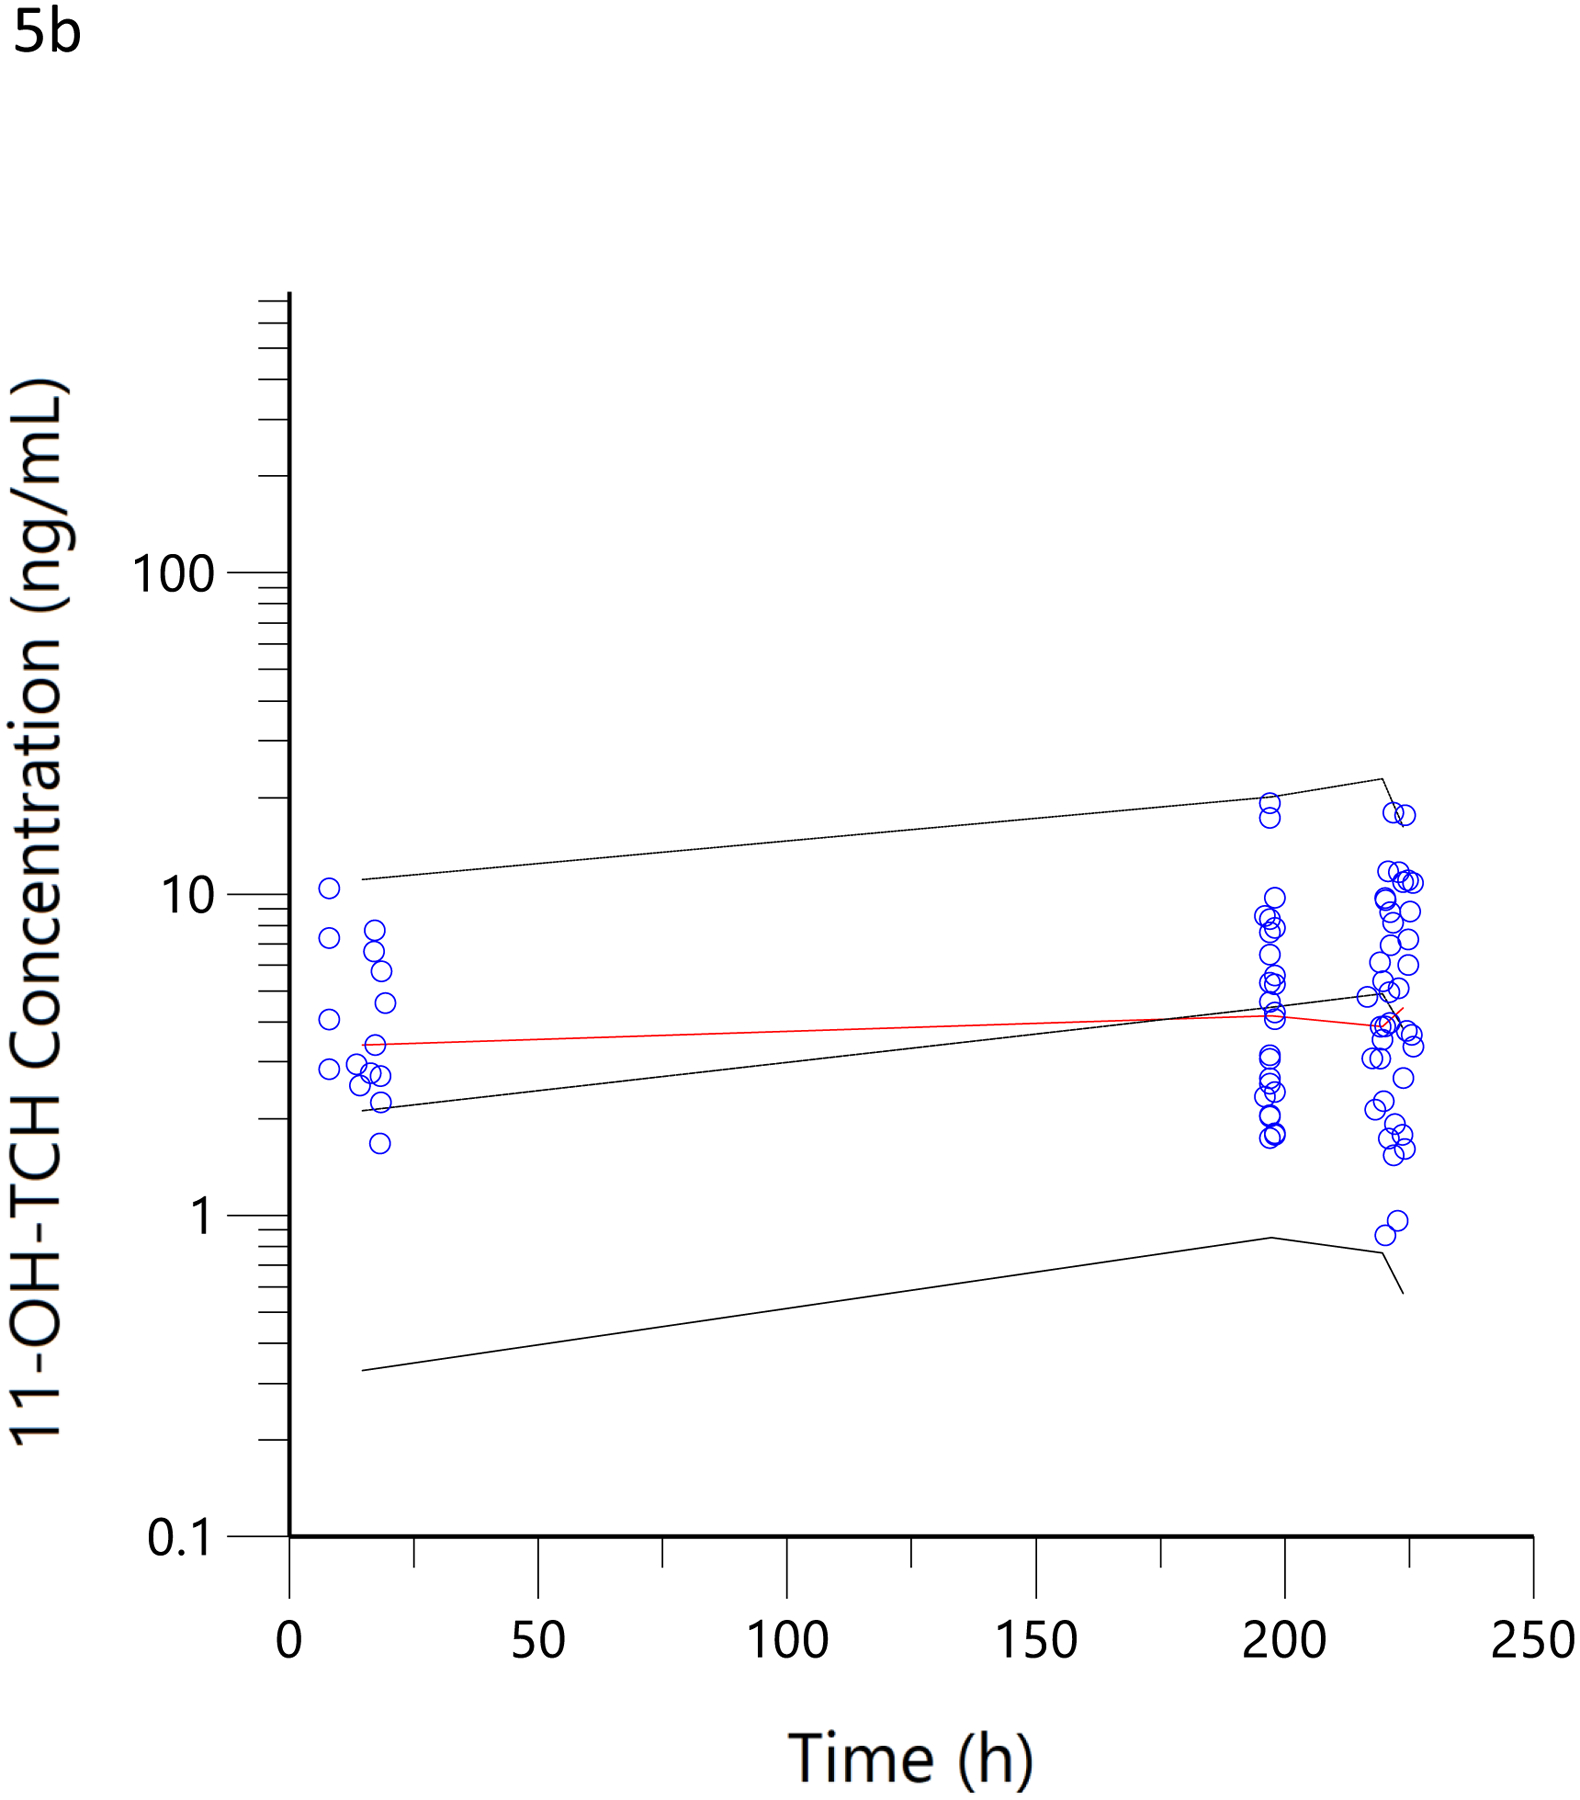
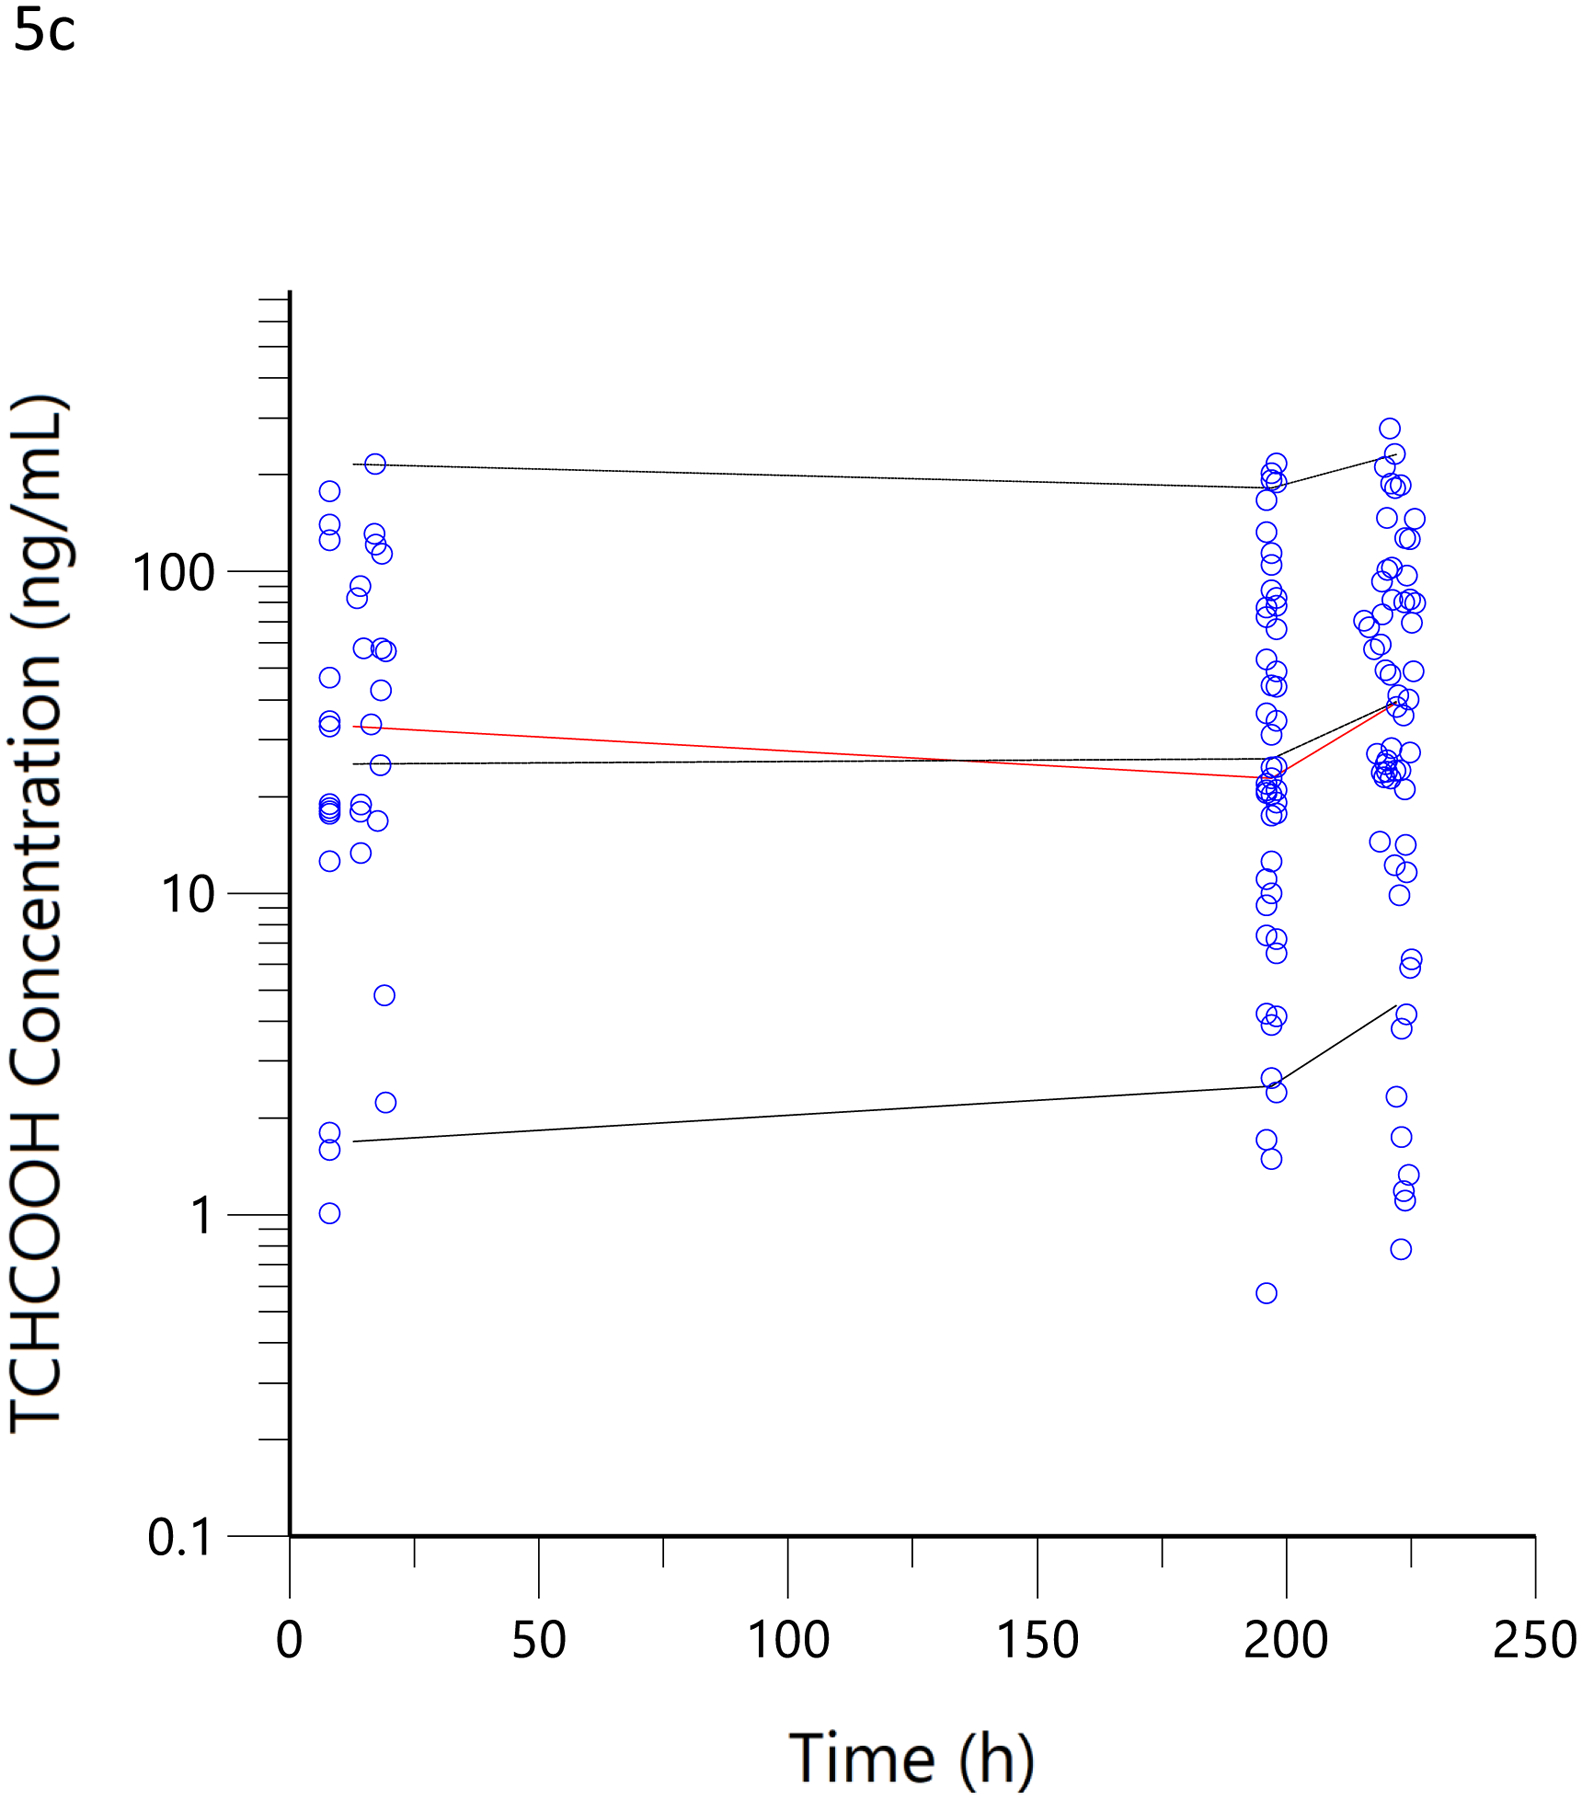
Visual predictive checks. The blue circles represent the observed data for THCCOOH (a), 11-OH-THC (b) and THC (c) concentrations for the low and high doses. The black lines represent the 95th, 50th, and 5th percentiles of the simulated concentrations at each time point.
Discussion
The aim of the current study was to use a previously reported population pharmacokinetic model of THC and its 11-OH-THC and THCCOOH metabolites, determined from data obtained from low-potency cannabis (1.75% and 3.55%), to estimate THC exposure in a population of regular high potency (16% and 24%) cannabis users from their sparse THC and metabolite concentration data obtained in a naturalistic, observational study. Additionally, we aimed to examine the relationships between pharmacokinetic model-estimated doses and those estimated from both self-report questionnaires and the weight of consumed cannabis flowers. Finally, we tested the feasibility of including a self-report questionnaire and weighed cannabis flower data as covariates in a comprehensive population pharmacokinetic model of THC and its metabolites.
The concentration versus time data for THC, 11-OH-THC, and THCCOOH obtained in the 36 subjects of this observational study were well characterized by the pharmacokinetic model (Figures 2 and 3). Additionally, the estimated elimination and metabolite production clearances estimated in the current study did not differ substantially from those estimated from the earlier clinical trial (Table 1). (21) This suggests that pharmacokinetic principles, determined in a carefully conducted, data-rich clinical trial, can be applied to sparse data from an observational study and that the pharmacokinetic model parameters of THC and its metabolites fall within a predictable range across individuals. This consistency of THC and metabolite pharmacokinetic parameter estimates is similar to that seen with anesthetic drugs (e.g., propofol and ketamine), which are also highly lipid soluble and have high clearance mediated by hepatic metabolism. (34–36) While the assumed dose (51 mg) had no influence on the results of the modeling, the assumed frequency of dosing (i.e., every 12 h daily dose and 3 min ad libitum smoking) may have a minor influence on the concentration versus time profiles and, thus, the scaling factors related to each individual’s dose estimates.
In this study, the interindividual variability (ω2) for the clearances was constrained to those observed in the previous population pharmacokinetic analysis of THC and its metabolites, while the dose estimates were unconstrained in their potential variability. In this way, most of the variability in the plasma THC, 11-OH-THC, and THCCOOH concentrations was accounted for in the high variances of the dose estimates (Table 1), and not in the pharmacokinetic parameter estimates. The high variability of the pharmacokinetic-predicted daily doses (SD% = 104%) was very similar to the self-reported estimated daily doses (SD% = 80%), suggesting that a modeling approach in which the self-reported dose is allowed to account for high variability in drug and metabolite concentrations in an uncontrolled observational study is reasonable. Using a population pharmacokinetic model to estimate typical, chronic daily doses from a single blood sample allows a more direct comparison to self-report questionnaires, as both methods estimate dose per day. Previous studies correlated biometric measurements and self-reported cannabis use and found a correlation coefficient of approximately 0.49. (15, 37) Using a model-based approach, we found a correlation coefficient between THC doses estimated by pharmacokinetic and MCQ to be 0.79 (Figure 4a). Compared with these previous studies, we found little or no over-prediction of THC consumption from the questionnaire compared to a biometric technique when a population pharmacokinetic model was used with questionnaire data included as a covariate. These results were based on a subset of cannabis users who indicated smoking as their nearly exclusive means of use, so extrapolation to oral products will require further pharmacokinetic model development as oral ingestion reduces bioavailable THC by a factor of ten. (25) Further improvement in the agreement between model-based and questionnaire-based estimates (Figures 4b and 4c) is expected with fewer pharmacokinetic modeling assumptions, such as time since last dose, and incorporation of relevant dose-related events, such as the number of puffs or methods of smoking, in future studies.
In a more objective comparison, we examined the correlation of pharmacokinetic-estimated THC dose smoked during the residence smoking event with that obtained by taking the difference of the pre- and post-smoking cannabis weight, adjusted for the THC potency of the product. Here, the correlation coefficient was 0.71 (Figure 4d). This was no better than the comparison between the pharmacokinetic-estimated daily dose and MCQ (Figure 4a), despite the expectation that it would be better as the used cannabis was weighed on site and the time of smoking was known to be within a few minutes. A slope of 1.3 corresponds to a smoking bioavailability of 14% in these regular users of high-potency cannabis, which is consistent with the 18% estimate for frequent users (38), 23% in heavy users(39) and 18.4–27.8% in vaporized THC inhaled in a controlled laboratory setting with the use of noseclips (25). While none of these previous studies used high-potency cannabis, such as the 16% and 24% THC content used by our subjects, nor a naturalistic setting in which comfort and privacy may influence inhalation efficiency, our results suggest that dose is titrated and efficiency is roughly equivalent between laboratory and naturalistic settings. Given that nearly 100% of a single breath of heated aerosolized drug is bioavailable (40), we can speculate that 70–85% burned cannabis flower is lost to sidestream smoke. The Bland-Altman analysis demonstrated a clear proportional bias (figures 4e and 4f) (33), suggesting decreasing bioavailability (i.e., smoking efficiency) with increasing doses. Surprisingly, the mean plasma THC concentrations were lower in the hour after smoking (figure 5c) in this naturalistic study (with 16% and 24% THC content) than in the clinical trial (with 1.75% and 3.55% THC content). (21) Thus, the Bland-Altman analysis and plasma THC concentrations suggest a tendency to titrate dose among cannabis smokers.
Further study of this model-based approach with larger sample sizes and testing for the predictive performance of the model is warranted, specifically, the number of subjects with dense biometric data should be increased beyond the six subject study (21) used in the current study in order to better characterize the true inter-individual variability of the metabolic clearances of THC and its metabolites and whether genetic factors may account for these differences. Additionally, genetics and methods of smoking in sparse data, observational studies, which can more easily expand the size of a studied population, should be incorporated in larger population pharmacokinetic modeling efforts. This model-based approach for estimation of daily THC dose could also be extended to THC concentration determinations in matrices other than blood/plasma such as saliva, (41) meconium, (42) and milk (43).
In conclusion, we demonstrated a methodology for inclusion of questionnaire-estimated daily cannabis use and weighed dose data in population pharmacokinetic modeling. Including these data improved the model fit of the data. This improved accuracy of estimating THC exposure, achieved by combining biometric (i.e., plasma or blood THC and metabolite concentrations) and questionnaire data, demonstrated that smoking high potency cannabis in a naturalistic setting results in similar bioavailability compared to smoking low potency cannabis in a clinical research setting. However, the total bioavailable dose of THC used in this naturalistic setting was generally less than the bioavailable dose consumed using low-potency cannabis in a laboratory setting.
Acknowledgements
Clinical studies were completed and plasma concentration measurements were funded by the National Institutes of Health (DA044131 and DA039707).
Disclosure of funding
C.S.: Department of Anesthesiology
C.B.: National Institutes of Health (DA044131)
K.H.: National Institutes of Health (DA039707)
M.A.H.: none
J.K.: Department of Anesthesiology
U.C.: Department of Anesthesiology
T.K.H.: Department of Anesthesiology, DoD (DHA) DR081416
Footnotes
No conflicts of interest.
References
- 1.Degenhardt L, Ferrari AJ, Calabria B, et al. The global epidemiology and contribution of cannabis use and dependence to the global burden of disease: results from the GBD 2010 study. PLoS One. 2013;8(10):e76635. [DOI] [PMC free article] [PubMed] [Google Scholar]
- 2.G. B. D. Alcohol; Drug Use C. The global burden of disease attributable to alcohol and drug use in 195 countries and territories, 1990–2016: a systematic analysis for the global burden of disease study 2016. Lancet Psychiatry. 2018;5(12):987–1012. [DOI] [PMC free article] [PubMed] [Google Scholar]
- 3.Bidwell LC, Mueller R, YorkWilliams SL, Hagerty S, Bryan AD, Hutchison KE. a novel observational method for assessing acute responses to cannabis: preliminary validation using legal market strains. Cannabis Cannabinoid Res. 2018;3(1):35–44. [DOI] [PMC free article] [PubMed] [Google Scholar]
- 4.Castaneto MS, Gorelick DA, Desrosiers NA, Hartman RL, Pirard S, Huestis MA. Synthetic cannabinoids: epidemiology, pharmacodynamics, and clinical implications. Drug Alcohol Depend. 2014;144:12–41. [DOI] [PMC free article] [PubMed] [Google Scholar]
- 5.Haney M, Malcolm RJ, Babalonis S, et al. Oral cannabidiol does not alter the subjective, reinforcing or cardiovascular effects of smoked cannabis. Neuropsychopharmacology. 2016;41(8):1974–1982. [DOI] [PMC free article] [PubMed] [Google Scholar]
- 6.Lundqvist T Cognitive consequences of cannabis use: comparison with abuse of stimulants and heroin with regard to attention, memory and executive functions. Pharmacol Biochem Behav. 2005;81(2):319–330. [DOI] [PubMed] [Google Scholar]
- 7.Fernandez-Ruiz J, Galve-Roperh I, Sagredo O, Guzman M. Possible therapeutic applications of cannabis in the neuropsychopharmacology field. Eur Neuropsychopharmacol. 2020. [DOI] [PubMed] [Google Scholar]
- 8.Desrosiers NA, Ramaekers JG, Chauchard E, Gorelick DA, Huestis MA. Smoked cannabis’ psychomotor and neurocognitive effects in occasional and frequent smokers. J Anal Toxicol. 2015;39(4):251–261. [DOI] [PMC free article] [PubMed] [Google Scholar]
- 9.Gorelick DA, Goodwin RS, Schwilke E, et al. Tolerance to effects of high-dose oral delta9-tetrahydrocannabinol and plasma cannabinoid concentrations in male daily cannabis smokers. J Anal Toxicol. 2013;37(1):11–16. [DOI] [PMC free article] [PubMed] [Google Scholar]
- 10.Martin-Willett R, McCormick Z, Newman W, Larsen LD, Ortiz Torres MA, Bidwell LC. The transformation of a gold standard in-person substance use assessment to a web-based, REDCap integrated data capture tool. J Biomed Inform. 2019;94:103186. [DOI] [PMC free article] [PubMed] [Google Scholar]
- 11.Robinson SM, Sobell LC, Sobell MB, Leo GI. Reliability of the timeline followback for cocaine, cannabis, and cigarette use. Psychol Addict Behav. 2014;28(1):154–162. [DOI] [PubMed] [Google Scholar]
- 12.Norberg MM, Mackenzie J, Copeland J. Quantifying cannabis use with the timeline followback approach: a psychometric evaluation. Drug Alcohol Depend. 2012;121(3):247–252. [DOI] [PubMed] [Google Scholar]
- 13.Smith MJ, Alden EC, Herrold AA, et al. Recent self-reported cannabis use is associated with the biometrics of delta-9-tetrahydrocannabinol. J Stud Alcohol Drugs. 2018;79(3):441–446. [DOI] [PMC free article] [PubMed] [Google Scholar]
- 14.Donovan DM, Bigelow GE, Brigham GS, et al. Primary outcome indices in illicit drug dependence treatment research: systematic approach to selection and measurement of drug use end-points in clinical trials. Addiction. 2012;107(4):694–708. [DOI] [PMC free article] [PubMed] [Google Scholar]
- 15.Hjorthoj CR, Fohlmann A, Larsen AM, Arendt M, Nordentoft M. Correlations and agreement between delta-9-tetrahydrocannabinol (THC) in blood plasma and timeline follow-back (TLFB)-assisted self-reported use of cannabis of patients with cannabis use disorder and psychotic illness attending the CapOpus randomized clinical trial. Addiction. 2012;107(6):1123–1131. [DOI] [PubMed] [Google Scholar]
- 16.Huestis MA, Henningfield JE, Cone EJ. Blood cannabinoids. II. Models for the prediction of time of marijuana exposure from plasma concentrations of delta 9-tetrahydrocannabinol (THC) and 11-nor-9-carboxy-delta 9-tetrahydrocannabinol (THCCOOH). J Anal Toxicol. 1992;16(5):283–290. [DOI] [PubMed] [Google Scholar]
- 17.Brooks KM, Anderson PL. Pharmacologic-based methods of adherence assessment in HIV prevention. Clin Pharmacol Ther. 2018;104(6):1056–1059. [DOI] [PMC free article] [PubMed] [Google Scholar]
- 18.FDA. Guidance for industry on population pharmacokinetics; availability. Food and Drug Administration, HHS. Notice. Fed Regist. 1999;64(27):6663–6664. [PubMed] [Google Scholar]
- 19.European Medicines Agency, Committee for medicinal products for human use. Guideline on reporting the results of population pharmacokinetic analyses. https://www.ema.europa.eu/en/documents/scientific-guideline/guideline-reporting-results-population-pharmacokinetic-analyses_en.pdf. Published June 21, 2007. Accessed September 13, 2021.
- 20.Huestis MA, Henningfield JE, Cone EJ. Blood cannabinoids. I. Absorption of THC and formation of 11-OH-THC and THCCOOH during and after smoking marijuana. J Anal Toxicol. 1992;16(5):276–282. [DOI] [PubMed] [Google Scholar]
- 21.Sempio C, Huestis MA, Mikulich-Gilbertson SK, Klawitter J, Christians U, Henthorn TK. Population pharmacokinetic modeling of plasma Delta9-tetrahydrocannabinol and an active and inactive metabolite following controlled smoked cannabis administration. Br J Clin Pharmacol. 2020;86(3):611–619. [DOI] [PMC free article] [PubMed] [Google Scholar]
- 22.Desrosiers NA, Himes SK, Scheidweiler KB, Concheiro-Guisan M, Gorelick DA, Huestis MA. Phase I and II cannabinoid disposition in blood and plasma of occasional and frequent smokers following controlled smoked cannabis. Clin Chem. 2014;60(4):631–643. [DOI] [PubMed] [Google Scholar]
- 23.Karschner EL, Darwin WD, Goodwin RS, Wright S, Huestis MA. Plasma cannabinoid pharmacokinetics following controlled oral delta9-tetrahydrocannabinol and oromucosal cannabis extract administration. Clin Chem. 2011;57(1):66–75. [DOI] [PMC free article] [PubMed] [Google Scholar]
- 24.Newmeyer MN, Swortwood MJ, Barnes AJ, Abulseoud OA, Scheidweiler KB, Huestis MA. Free and glucuronide whole blood cannabinoids’ pharmacokinetics after controlled smoked, vaporized, and oral cannabis administration in frequent and occasional cannabis users: identification of recent cannabis intake. Clin Chem. 2016;62(12):1579–1592. [DOI] [PubMed] [Google Scholar]
- 25.Heuberger JA, Guan Z, Oyetayo OO, et al. Population pharmacokinetic model of THC integrates oral, intravenous, and pulmonary dosing and characterizes short- and long-term pharmacokinetics. Clin Pharmacokinet. 2015;54(2):209–219. [DOI] [PubMed] [Google Scholar]
- 26.Bidwell LC, Ellingson JM, Karoly HC, et al. Association of naturalistic administration of cannabis flower and concentrates with intoxication and impairment. JAMA Psychiatry. 2020. [DOI] [PMC free article] [PubMed] [Google Scholar]
- 27.Desai A, Kovanda L, Kowalski D, Lu Q, Townsend R, Bonate PL. Population pharmacokinetics of isavuconazole from phase 1 and phase 3 (SECURE) trials in adults and target attainment in patients with invasive infections due to aspergillus and other filamentous fungi. Antimicrob Agents Chemother. 2016;60(9):5483–5491. [DOI] [PMC free article] [PubMed] [Google Scholar]
- 28.Vinks AA, Peck RW, Neely M, Mould DR. Development and implementation of electronic health record-integrated model-informed clinical decision support tools for the precision dosing of drugs. Clin Pharmacol Ther. 2020;107(1):129–135. [DOI] [PubMed] [Google Scholar]
- 29.Heishman SJ, Singleton EG, Liguori A. Marijuana craving questionnaire: development and initial validation of a self-report instrument. Addiction. 2001;96(7):1023–1034. [DOI] [PubMed] [Google Scholar]
- 30.Klawitter J, Sempio C, Morlein S, et al. An atmospheric pressure chemical ionization MS/MS assay using online extraction for the analysis of 11 cannabinoids and metabolites in human plasma and urine. Ther Drug Monit. 2017;39(5):556–564. [DOI] [PMC free article] [PubMed] [Google Scholar]
- 31.Bergstrand M, Karlsson MO. Handling data below the limit of quantification in mixed effect models. AAPS J. 2009;11(2):371–380. [DOI] [PMC free article] [PubMed] [Google Scholar]
- 32.Karlsson MO, Savic RM. Diagnosing model diagnostics. Clin Pharmacol Ther. 2007;82(1):17–20. [DOI] [PubMed] [Google Scholar]
- 33.Giavarina D Understanding Bland Altman analysis. Biochem Med (Zagreb). 2015;25(2):141–51. [DOI] [PMC free article] [PubMed] [Google Scholar]
- 34.Sahinovic MM, Struys M, Absalom AR. Clinical pharmacokinetics and pharmacodynamics of propofol. Clin Pharmacokinet. 2018;57(12):1539–58. [DOI] [PMC free article] [PubMed] [Google Scholar]
- 35.Jonkman K, Duma A, Olofsen E, et al. Pharmacokinetics and bioavailability of inhaled esketamine in healthy volunteers. Anesthesiology. 2017;127(4):675–83. [DOI] [PubMed] [Google Scholar]
- 36.Henthorn TK, Avram MJ, Dahan A, et al. Combined recirculatory-compartmental population pharmacokinetic modeling of arterial and venous plasma S(+) and R(−) ketamine concentrations. Anesthesiology. 2018;129(2):260–70. [DOI] [PubMed] [Google Scholar]
- 37.Hjorthoj CR, Hjorthoj AR, Nordentoft M. Validity of timeline follow-back for self-reported use of cannabis and other illicit substances--systematic review and meta-analysis. Addict Behav. 2012;37(3):225–233. [DOI] [PubMed] [Google Scholar]
- 38.Ohlsson A, Lindgren JE, Wahlen A, Agurell S, Hollister LE, Gillespie HK. Plasma delta-9 tetrahydrocannabinol concentrations and clinical effects after oral and intravenous administration and smoking. Clin Pharmacol Ther. 1980;28(3):409–416. [DOI] [PubMed] [Google Scholar]
- 39.Ohlsson A, Lindgren JE, Wahlen A, Agurell S, Hollister LE, Gillespie HK. Plasma levels of delta 9-tetrahydrocannabinol after intravenous, oral, and smoke administration. NIDA Res Monogr. 1981;34:250–256. [PubMed] [Google Scholar]
- 40.Avram MJ, Spyker DA, Henthorn TK, Cassella JV. The pharmacokinetics and bioavailability of prochlorperazine delivered as a thermally generated aerosol in a single breath to volunteers. Clin Pharmacol Ther. 2009;85(1):71–77. [DOI] [PubMed] [Google Scholar]
- 41.Pacifici R, Pichini S, Pellegrini M, et al. THC and CBD concentrations in blood, oral fluid and urine following a single and repeated administration of “light cannabis”. Clin Chem Lab Med. 2020;58(5):682–689. [DOI] [PubMed] [Google Scholar]
- 42.Carlier J, Huestis MA, Zaami S, Pichini S, Busardo FP. Monitoring perinatal exposure to cannabis and synthetic cannabinoids. Ther Drug Monit. 2020;42(2):194–204. [DOI] [PubMed] [Google Scholar]
- 43.Sempio C, Wymore E, Palmer C, et al. Detection of cannabinoids by LC-MS-MS and ELISA in breast milk. J Anal Toxicol. 2020. [DOI] [PubMed] [Google Scholar]


