
Fig. 1. The SASP is amplified by PAMP factors.
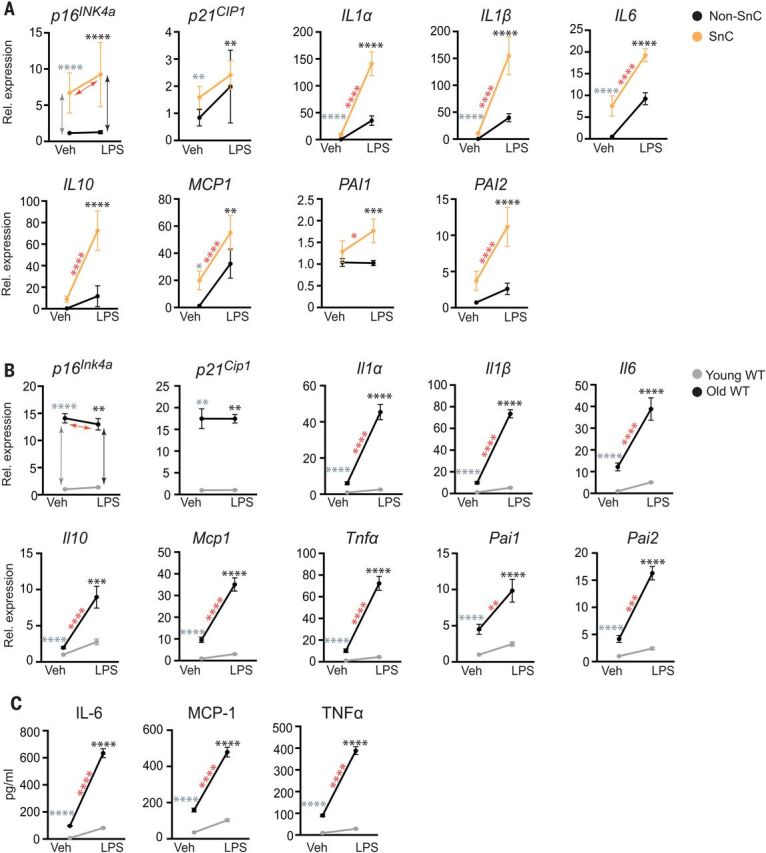
(A) Human adipocyte progenitors isolated from subcutaneous fat biopsies were induced to undergo senescence with 10 gray (Gy) of ionizing radiation (SnC) or not (non-SnC) (n = 5 subjects). Cells were treated with 10 ng of the prototype PAMP LPS for 3 hours before RNA isolation. Gene expression was measured with quantitative PCR, and the expression in LPS-treated cells was normalized to vehicle-treated samples. Means ± SEM. Statistical significance was calculated by using a mixed effect model for the effect of LPS on SnCs and its differential effects on SnCs compared with non-SnCs. Details are available in table S1. Arrows and asterisks: gray, vehicle-treated SnCs versus non-SnCs; black, LPS-treated SnCs versus non-SnCs; red, SnCs ± LPS. *P < 0.05, **P < 0.01, ***P < 0.001, ****P < 0.0001. (B) Young (2-month-old) and old (26-month-old) mice were treated with phosphate-buffered saline (PBS) (n = 5 young and 5 old) or LPS (n = 4 young and 3 old), and tissues were collected 24 hours later. RNA was isolated from liver, and gene expression measured by means of quamtitative PCR. Expression in LPS-treated mice was normalized to vehicle-treated animals. Means ± SEM, two-way analysis of variance (ANOVA) and post hoc comparison Tukey’s honestly significant difference used to compare the two animal cohorts within a treatment group. Arrows and asterisks: gray, vehicle-treated old versus young; black, LPS-treated old versus young; red, old ± LPS. **P < 0.01, ***P < 0.001, ****P < 0.0001. Kidney data are provided in fig. S2. (C) Serum protein from the same mice measured with enzyme-linked immunosorbent assay (ELISA). Statistics are as described in (B).