Abstract
Introduction
We aimed to explore the downregulation of the coiled-coil domain containing 80 (CCDC80) and its underlying molecular mechanisms in ovarian carcinoma (OVCA). Materials/Methods. Immunohistochemical staining was performed to confirm the expression status of CCDC80 protein. Combining the data from in-house tissue microarrays and high-throughput datasets, we identified the expression level of CCDC80 in OVCA. We utilized cell-type identification by estimating relative subsets of RNA transcripts (CIBERSORT) algorithm and single-sample gene set enrichment analysis (ssGSEA) to explore the relationship between CCDC80 and the tumor microenvironment (TME) landscape in OVCA. Pathway enrichment, function annotation, and transcription factor (TFs) exploration were conducted to study the latent molecular mechanisms. Moreover, the cell line data in the Genomics of Drug Sensitivity in Cancer (GDSC) database was used to discover the relationship between CCDC80 and drug sensitivity.
Results
An integrated standard mean difference (SMD) of −0.919 (95% CI: −1.515–0.324, P = 0.002) identified the downregulation of CCDC80 in OVCA based on 1048 samples, and the sROC (AUC = 0.76) showed a moderate discriminatory ability of CCDC80 in OVCA. The fraction of infiltrating naive B cells showed significant differences between the high- and low-CCDC80 expression groups. Also, CCDC80-related genes are enriched in the Ras signaling pathway and metabolic of lipid. Nuclear receptor subfamily three group C member 1 (NR3C1) may be an upstream TF of CCDC80, and CCDC80 may be related to the sensitivity of mitocycin C and nilotinib.
Conclusion
CCDC80 was downregulated in OVCA and may play a role as a tumor suppressor in OVCA.
1. Introduction
Ovarian carcinoma (OVCA), a neoplasm in the ovary, originates from embryonic Müllerian ducts and is influenced by hormones and other molecular events [1–6]. As one of the most frequent gynaecological cancers, OVCA is ranked among the deadliest roles from the morbidity and motality perspective [7, 8]. Approximately 21,410 new cases of OVCA have been projected in 2021, which might cause 13,779 deaths in the United States [9]. Patients with OVCA still have poor prognoses despite some treatment approaches, such as chemotherapy, surgery, and immunotherapy [8, 10–12]. Thus, exploring new biomarkers and therapeutic targets for OVCA is imperative.
Coiled-coil domain containing 80 (CCDC80), also known as DRO1 or SSG1, is located at 3q13.2. The protein encoded by CCDC80 is expressed in different cells, such as hepatocytes and adipocytes [13]. Previous studies have identified that CCDC80 may act as an inhibitor in tumorigenesis of thyroid, pancreatic, and colon cancer [14, 15]. Recently, one study found that low-CCDC80 expression may facilitate the migration of melanoma cells by mediating the downregulation of E-cadherin [16]. Besides, CCDC80 was proven to be an AIB1-target tumor inhibitor and may participate in the apoptosis of tumor cells [17].
One study had reported that the expression of CCDC80 mRNA in OVCA tissues was lower than that in nontumor tissues via RT-qPCR [18]. However, no study has revealed the dysregulation of CCDC80 protein in OVCA. Thus, a multicenter study needed to carry out for comprehensively exploring CCDC80 in OVCA. Herein, based on in-house tissue microarrays, RNA-sequencing (RNA-seq), and gene chips, we performed an integrated study and revealed that CCDC80 was downregulated in OVCA at both the mRNA and protein levels with a large sample size (n of OVCA = 802, n of non − OVCA = 246). Cell-type identification by estimating relative subsets of RNA transcripts (CIBERSORT) and single-sample gene set enrichment analysis (ssGSEA) was used to explore the relationship between CCDC80 expression and the tumor microenvironment (TME) landscape of OVCA. Based on Gene Ontology (GO), Kyoto Encyclopedia of Genes and Genomes (KEGG), Disease Ontology (DO), and Reactome enrichment analysis and prediction of transcription factors regulating CCDC80, the prospective molecular mechanisms of CCDC80 in OVCA were explored. Moreover, using cell line data in the Genomics of Drug Sensitivity in Cancer (GDSC) database, we explored the relationship between drug sensitivity on cell lines of OVCA and CCDC80 expression. All of these works will deepen our understanding of the significance of CCDC80 in OVCA and explore a latent biomarker and therapy target for OVCA.
2. Materials and Methods
2.1. Evaluation of CCDC80 Protein Expression in OVCA Tissues
Twenty-four cases of OVCA tissues and 28 cases of non-OVCA controls were collected from the First Affiliated Hospital of Guangxi Medical University, Naning, Guangxi Zhuang Autonomous Region, China. This study was approved by the ethics committee of the First Affiliated Hospital of Guangxi Medical University (no. 2020-KY-E-095). Two tissue microarrays (OVC1021 and OVC2281) were afforded by Pantomics, Inc. (Richmond, CA 94806). Afterward, immunohistochemical (IHC) staining conducted using CCDC80 polyclonal antibody (biorbyt, orb216089, rabbit-anti-human) with 150 OVCA tissues and 46 non-OVCA tissues from clinical samples and tissue microarrays. All operations were performed in accordance with the manufacturer's instructions. Formalin-fixed and paraffin-embedded tissue slides were used to deparaffinize and rehydrate. Then, antigen retrieval was accomplished in a preheated ethylenediaminetetraacetic acid buffer (pH = 9.0). Inactivation of endogenous peroxidase was carried out via 3% H2O2 at room temperature (25°C, the same below) for 15 minutes, and distilled water was used to rinse, followed by PBS soak. The rabbit anti-human CCDC80 polyclonal antibody (dilution 1 : 250) was incubated at 37°C for 90 minutes, followed by PBS rinsing. Universal mouse/rabbit secondary antibody was added into the tissue slides and placed in room temperature for 20 minutes, followed by PBS soak. Coloration was accomplished with diaminobenzidine for 5 minutes, and counterstaining was performed with hematoxylin. Dehydration was carried out in 75%, 85%, 95%, and 100% alcohol successively, and tissue slides were sealed with neutral gum finally. The assessment was conducted via microscope. Blue represented negative staining and red represented positive staining.
Two pathologists evaluated the results of IHC independently. The score of staining intensity followed the criteria: no staining (point = 0), light staining (point = 1), moderate staining (point = 2), and strong staining (point = 3). The score of positive cells in visual field followed the criteria: 0–5% (point = 0), 6–25% (point = 1), 26–50% (point = 2), 51–75% (point = 3), and > 75% (point = 4). The final IHC score equaled the product of intensity and positive cells score [19].
2.2. Data Collection from High-Throughput Databases
To identify the expression of CCDC80 mRNA in OVCA, we searched Gene Expression Omnibus (GEO), Sequence Read Archive (SRA), ArrayExpress, and Oncomine databases to collect gene chips. The search terms were ovarian carcinoma and the mRNA OR gene. Datasets that met the following requirements were collected: (a) the samples were collected from humans, (b) both OVCA and non-OVCA samples were provided and not below three, (c) the expression and annotation profiles were available, and (d) the expression of CCDC80 was contained. For those datasets from the same platform, we combined them and used the function “Combat” of the sva package to remove the batch effects. Furthermore, we also explored the Cancer Genome Atlas (TCGA) and the Genotype-Tissue Expression (GTEx) databases and included tertiary RNA-seq data of OVCA and normal ovarian samples, and we calculated log2(expression+1) to normalize the data. Figure S1 shows the flow chart. As of May 1, 2021, 14 datasets from eight platforms were included (Table 1). After integrating microarrays, we finally obtained eight high-throughput cohorts for our study: GPL570-OVCA, TCGA_GTEx_ovary, GSE66957, GSE119054, GSE124766, GSE132289, GSE146553, and GSE155310.
Table 1.
General characteristics of microarray and RNA-sequencing datasets on ovarian carcinoma.
| Study | Test method/platform | Country | Year | OVCA group | Noncancerous ovary controls |
|---|---|---|---|---|---|
| GSE105437 | GPL570 | South Korea | 2017 | 10 | 5 |
| GSE29450 | GPL570 | USA | 2011 | 10 | 10 |
| GSE18520 | GPL570 | USA | 2009 | 53 | 10 |
| GSE10971 | GPL570 | Canada | 2008 | 13 | 24 |
| GSE54388 | GPL570 | USA | 2017 | 16 | 6 |
| GSE14407 | GPL570 | USA | 2009 | 12 | 12 |
| GSE36668 | GPL570 | Norway | 2012 | 4 | 4 |
| GSE119054 | GPL19615 | China | 2019 | 6 | 3 |
| GSE66957 | GPL15048 | USA | 2015 | 57 | 12 |
| GSE146553 | GPL6244 | USA | 2020 | 46 | 9 |
| GSE124766 | GPL6480 | Germany | 2020 | 20 | 8 |
| GSE132289 | GPL20301 | UK | 2020 | 5 | 3 |
| GSE155310 | GPL18573 | UK | 2020 | 21 | 6 |
| TCGA_GTEx_ovary | RNA-seq | USA | 2021 | 379 | 88 |
OVCA: ovarian carcinoma.
2.3. Statistical Analysis of CCDC80 Expression in OVCA Tissues
If the data followed the normal distribution, Student's t-test was used to compare the expression status of CCDC80 between OVCA and non-OVCA samples using GraphPad Prism 8 software; otherwise, Wilcoxon test was utilized. We also drew receiver operating characteristic (ROC) curves to evaluate the capacity of CCDC80 to distinguish OVCA samples from non-OVCA samples. The area under the curve (AUC) > 0.7 was reckoned as having moderate discriminatory capacity. Also, by integrating the in-house IHC data, gene chips, and RNA-seq, the standard mean difference (SMD) was calculated, and a summary of ROC (sROC) curve was drawn using Stata v15.1 software (TX, USA). The chi-squared-based Q-test and I2 statistic were used to assess the heterogeneity. I2 ≤ 50% and P value of Q-test ≥ 0.05 mean low heterogeneity, and a fixed effect model should be chosen; otherwise, a random effect model should be used to combine SMD. If the 95% confidence interval (CI) of the SMD does not contain zero, the integrated SMD is statistically significant. Egger's test was used to identify publication bias.
2.4. Relationships between CCDC80 Expression and TME Landscape of OVCA
CIBERSORT, a deconvolution algorithm, can estimate the composition of a cell following a gene expression profile with support vector regression [20]. We explored the relationships between CCDC80 and tumor-infiltrating immune cells in the TCGA-OVCA cohort via the CIBERSORT algorithm in R v3.6.3 software. Subsequently, ssGSEA was performed to explore the immune-related pathways in OVCA by the GSVA package in R [21]. The file “c7.all.v7.4.symbols.gmt” was downloaded from the Molecular Signature Database (MSigDB, http://software.broadinstitute.org/gsea/msigdb/index.jsp) as the reference immune-related gene set. The limma package of R was used to determine significant immune-related pathways and biological processes between high-and low-CCDC80 expression groups (P < 0.05).
2.5. Identification of Differentially Expressed and Coexpressed Genes of CCDC80 in OVCA
First, we calculated Pearson's correlation coefficient r of CCDC80 and other genes in OVCA matrices. The genes with the absolute value of r ≥ 0.4 and P < 0.05 were recognized as the coexpressed genes (CEGs) of CCDC80. The CEGs appearing in at least three matrices were chosen. Simultaneously, we calculated the pooled SMD of each gene in the included OVCA matrices using R software. When the 95% CIs of SMDs lacked 0 and P < 0.05, we identified the genes as the differentially expressed genes (DEGs) in OVCA. Subsequently, we overlapped the positive-correlated genes of CCDC80 with downregulated genes and the negative-correlated genes of CCDC80 with upregulated genes in OVCA, and the intersection genes were obtained for further research.
2.6. GO, KEGG, DO, and Reactome Enrichment Analysis
Intersection genes of CEGs and DEGs were used to conduct GO, KEGG, and DO enrichment analysis via clusterProfiler and the DOSE package of R [22]. The online tool KOBAS 2.0 was used to perform Reactome pathway enrichment [23]. GOplot and enrichplot packages of R were used to visualize the results, and the pathview package was used to draw the pathway graphs. Enriched results with adjusted P value (false discovery rate, calculated by Benjamini–Hochberg procedure) < 0.05 were chosen to visualize and for further analysis.
2.7. GSEA Based on Broad Institute Cancer Cell Line Encyclopedia Data
We downloaded the RNA-seq data of OVCA cell lines from the Broad Institute Cancer Cell Line Encyclopedia (CCLE) database and divided it into two groups based on high- and low-expression level of CCDC80. The file “h.all.v7.4.symbols.gmt” from MSigDB was obtained as a reference gene set.
2.8. Exploration of Upstream Transcription Factors of CCDC80 in OVCA
To explore the molecular regulatory mechanisms of CCDC80 in OVCA, the Cistrome Data Browser (Cistrome DB) was used to predict the latent transcription factors (TFs) of CCDC80. Moreover, we overlapped the predicted TFs, CCDC80 positive-correlated genes, and downregulated genes in OVCA to screen initial TFs. We drew the seqlogo of the motifs via the ggseqlogo package of R. We used the JASPAR database and FIMO tool in the MEME suite to explore the combining site between motifs and the upstream TSS of CCDC80 [24, 25]. Concurrently, the chromatin immunoprecipitation sequencing (ChIP-seq) data in Cistrome DB was used to validate whether there were peaks before the TSS of CCDC80 with the IGV tool.
2.9. Relationship between CCDC80 Expression and Drug Sensitivity in OVCA Cell Lines
We downloaded the RNA-seq data of cell lines and estimated half maximal inhibitory concentration (IC50) of all the screened compounds from GDSC database. Mann–Whitney U-test was used to compare the estimated IC50 between high- and low-CCDC80 expression groups of OVCA cell lines using GraphPad Prism 8 software. A two-tailed P < 0.05 indicates a statistically significant difference. Compounds with higher IC50 signified that the cell lines of OVCA were not susceptible to the compounds.
3. Results
3.1. The Expression Status of CCDC80 in OVCA Tissues
The results of IHC staining identified that the expression of CCDC80 protein in OVCA tissues was lower than that in non-OVCA tissues (Figure 1), and the difference was statistically significant (P < 0.0001, Figure 2(a)). At the mRNA level, three cohorts showed consistent trends with the CCDC80 protein (TCGA_GTEx_ovary, P < 0.0001; GPL570-OVCA, P < 0.0001; GSE132289, P = 0.0030; Figures 2(b), 2(c) and 2(g)). However, the other five datasets showed nonsignificant differences (GSE66957, GSE119054, GSE124766, GSE146553, and GSE155310, P > 0.05; Figures 2(d)–2(f), 2(h) and 2(i)). Figures 3(a)–3(i) show the ROC curves.
Figure 1.
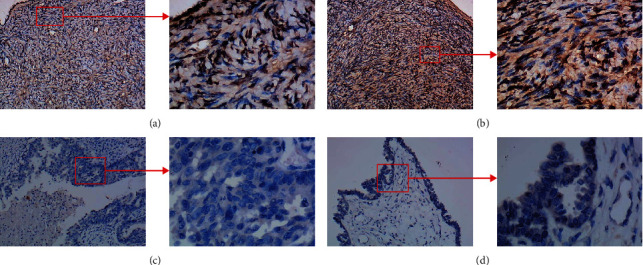
The expression of CCDC80 protein in normal ovary (a) and (b) and ovarian carcinoma (c) and (d) tissues through immunohistochemical (IHC) staining.
Figure 2.
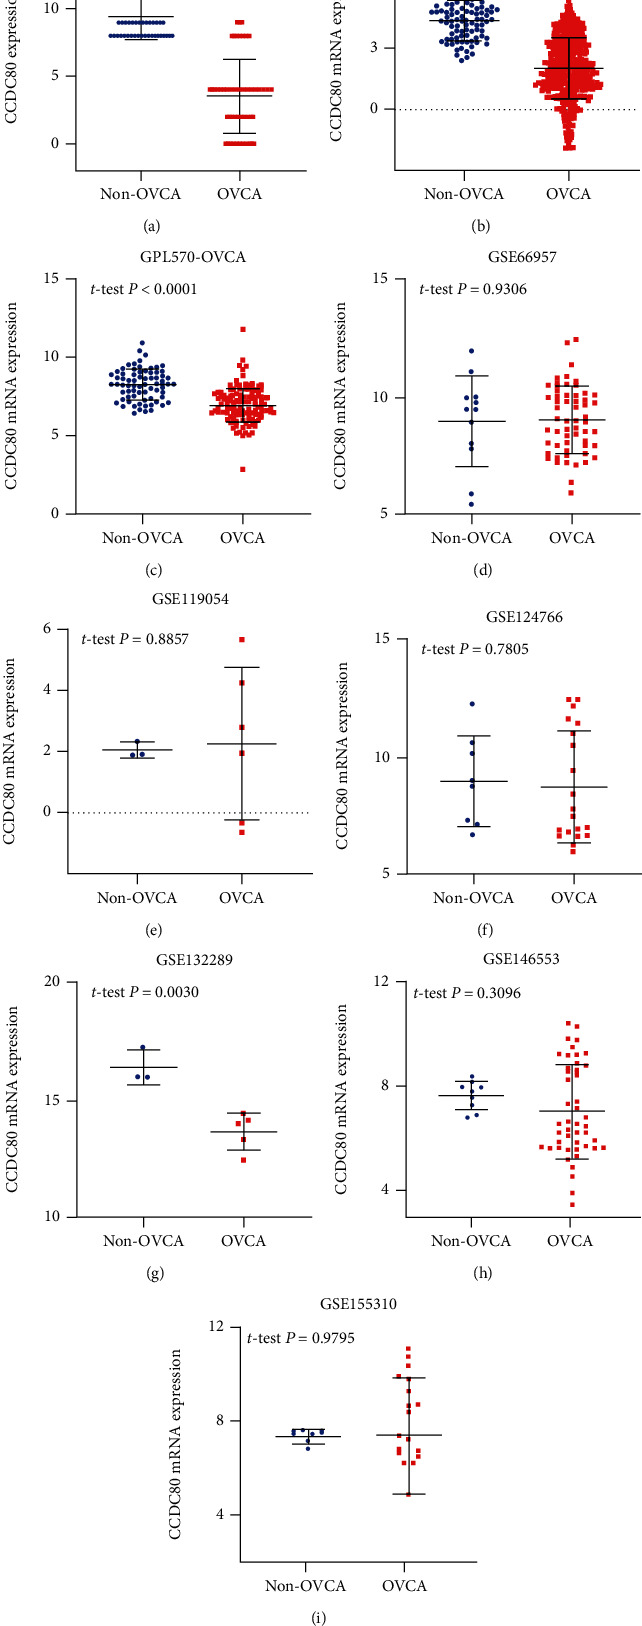
Scatter plots of CCDC80 protein (a) and mRNA (b)–(i) expression of OVCA and the corresponding normal controls.
Figure 3.
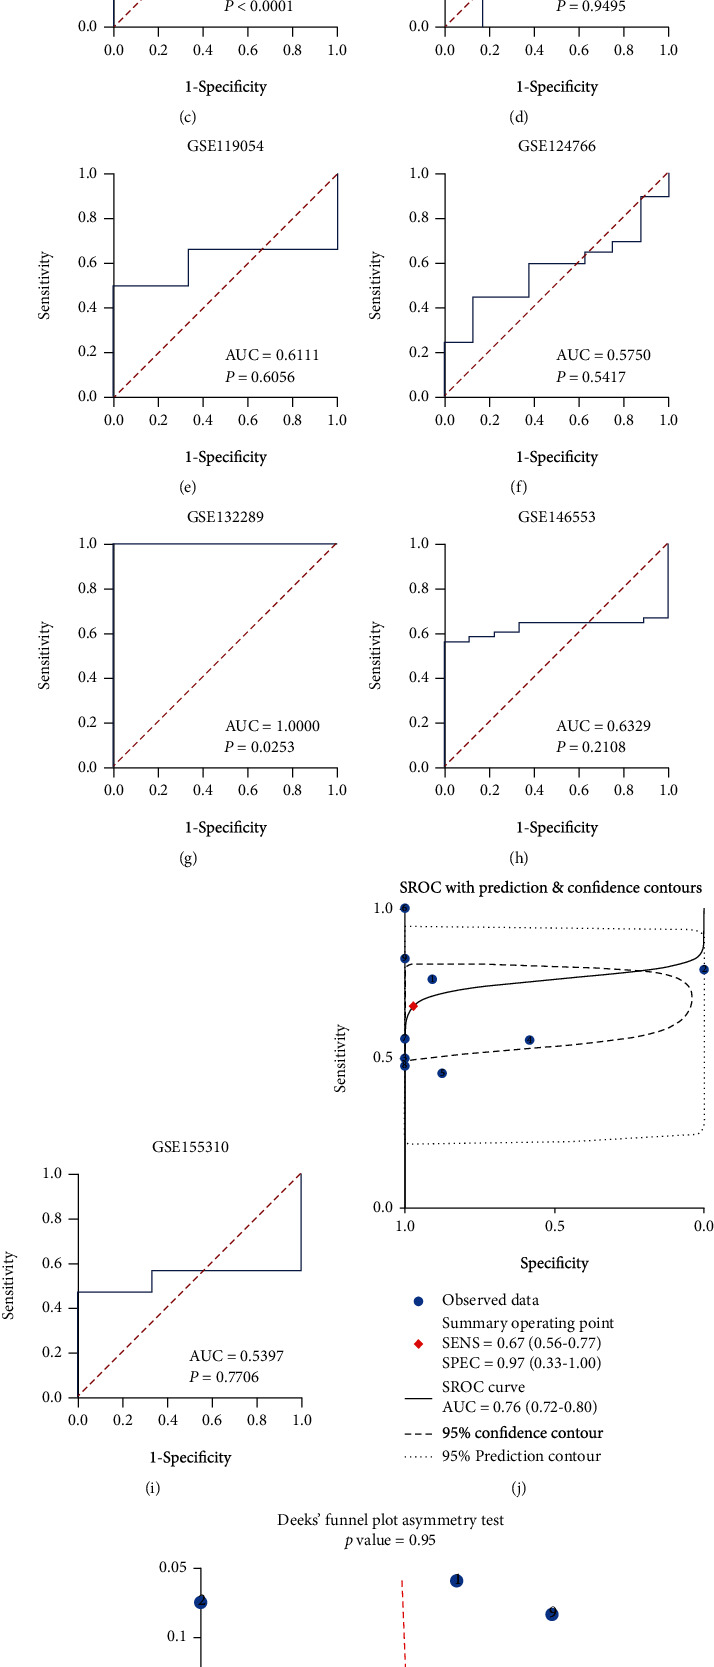
The receiver operating characteristic (ROC, (a)–(i)) and sROC (j) curves of CCDC80 in OVCA and Deek's test for publication bias test (k).
3.2. Comprehensive Evaluation of CCDC80 in OVCA
Due to high heterogeneity (I2 = 90.0%, P < 0.001), we used a random effect model to combine SMD. The results of the subgroup analysis showed that CCDC80 expression in OVCA was below that in the non-OVCA samples at both the mRNA level (subtotal SMD = −0.693, 95% CI: −1.284–−0.101, P = 0.022) and the protein level (subtotal SMD = −2.368, 95% CI: −2.774–−1.963, P < 0.001). An overall SMD = −0.919 confirmed the downregulation of CCDC80 in OVCA (95% CI: −1.515–0.324, P = 0.002, Figure 4(a)). Egger's test identified no publication bias (P = 0.170, Figure 4(b)). The AUC of the sROC curve was 0.76 (95% CI: 0.72–0.80, Figure 3(j)), and Deek's funnel plot also indicated no publication bias (P = 0.949, Figure 3(k)).
Figure 4.
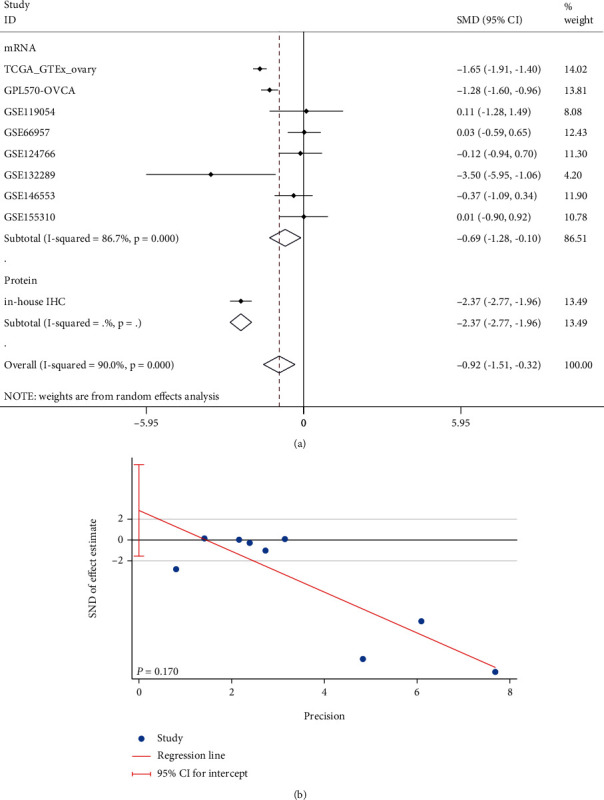
Combined standard mean difference (SMD, (a)) of CCDC80 expression between OVCA and non-OVCA group and Egger's test (b) for publication bias test (in mRNA group, TCGA_GTEx_ovary was a cohort of RNA-seq, and other cohorts began with “GSE” were gene chip cohorts).
Moreover, we downloaded the RNA-seq data from the CCLE database and surprisingly found that CCDC80 was not expressed in the cell lines of OVCAR5_OVARY, OVCA420_OVARY, OVCA433_OVARY, OC315_OVARY, etc., which made the result of the downregulated CCDC80 level in OVCA more convincing.
3.3. The Relationship between the TME Landscape of OVCA and CCDC80 Expression
Through CIBERSORT, we found that the fraction of tumor-infiltrating naive B cells and M2 macrophages (M2) was lower in the high-CCDC80 group than in the low-CCDC80 group (naive B cells, P = 0.028; M2, P = 0.02, Figure 5). However, the fraction of memory B cells (Bm), follicular helper T cell (Tfh), and activated NK cells infiltrated in OVCA was higher in the high-CCDC80 group than in the low-CCDC80 group (Bm, P = 0.001; Tfh, P = 0.026; activated NK cells, P = 0.024; Figure 5).
Figure 5.
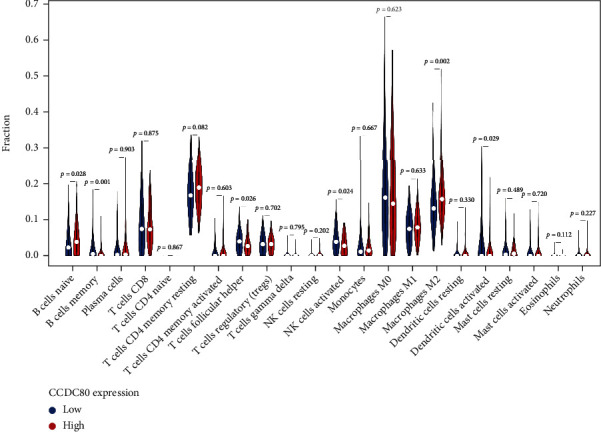
The relationship between CCDC80 expression and the fraction of immune cell infiltration in OVCA based on CIBERSORT algorithms.
Moreover, the results of ssGSEA showed that between high- and low-CCDC80 groups, the scores of “B_cells,” “CD8 + _T_cells,” “Th1_cells,” “Th2_cells,” and other immunocyte-related gene sets were statistically significant (Figure 6(a)). Also, the scores of “APC_co_inhibition,” “APC_co_stimulation,” “Check-point,” “Type_II_IFN_Response,” and other immune function-related gene sets were statistically significant between the high- and low-CCDC80 groups (Figure 6(b)). Interestingly, the score in the high-CCDC80 group considerably exceeded that in the low-CCDC80 group.
Figure 6.
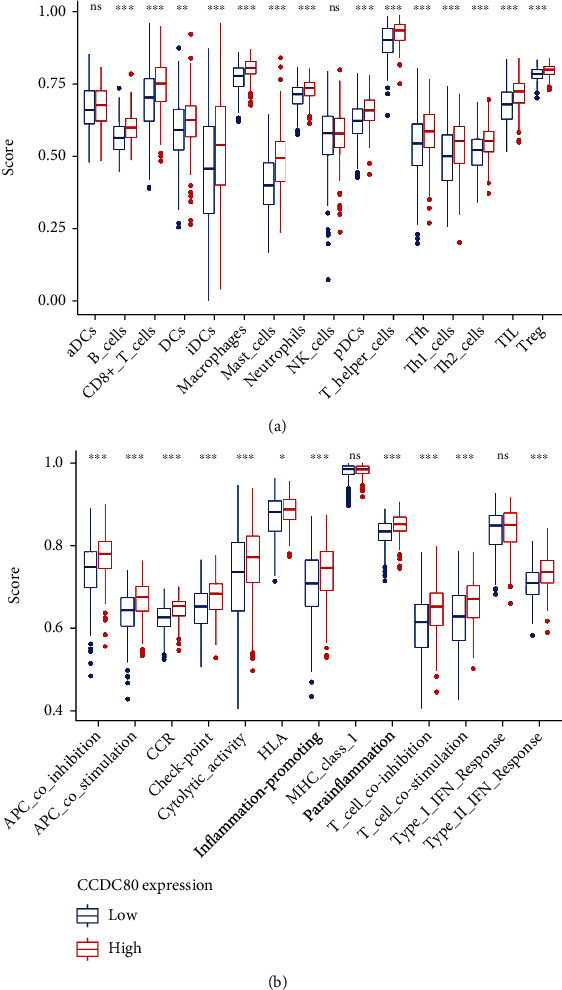
The boxplots visualizing the single-sample gene set enrichment analysis (ssGSEA) in high- and low-CCDC80 expression group in OVCA based on immunocyte-related gene sets (a) and immune function-related gene sets (b) (∗∗∗, P < 0.0001; ∗∗, P < 0.001; ∗, P < 0.05; ns, P ≥ 0.05).
3.4. Enrichment Analysis
Through intersection, we obtained 298 CCDC80-related downregulated DEGs and 156 CCDC80-related upregulated DEGs (Figure S2). The results of GO term annotation showed that CCDC80-related downregulated DEGs were relative to “focal adhesion,” “cell-cell junction,” and “glycosaminoglycan binding,” and that CCDC80-related upregulated genes were enriched in “cell-cell adhesion mediator activity,” “microtuble,” and “cadherin binding involved in cell-cell adhesion” (Figure S3). Regarding DO enrichment, CCDC80-related downregulated DEGs may participate in some pulmonary and cardiovascular diseases, while CCDC80-related upregulated DEGs may participate in ovarian tumors and urinary system cancer (Figure S4).
Moreover, the results of KEGG enrichment identified that CCDC80-related downregulated DEGs were enriched in the “Ras signaling pathway,” “Axon guidance,” and “Proteoglycans in cancer,” etc., while CCDC80-related upregulated DEGs may be involved in “DNA replication” and “Base excision repair,” etc. (Figure 7, Table S1). The particulars of the Ras signaling pathway are demonstrated in Figure S5, which illuminates how the Ras signaling pathway may be related to some vital pathways in cancer, such as cell-cell junctions, cell migration, MAPK signaling, and the PI3K-Akt signaling pathway. Similarly, proteoglycans in the cancer pathway were also related to tumor-related pathways, such as cell adhesion, apoptosis, oncogenic signaling, tumor cell migration, and invasion pathway (Figure S6).
Figure 7.
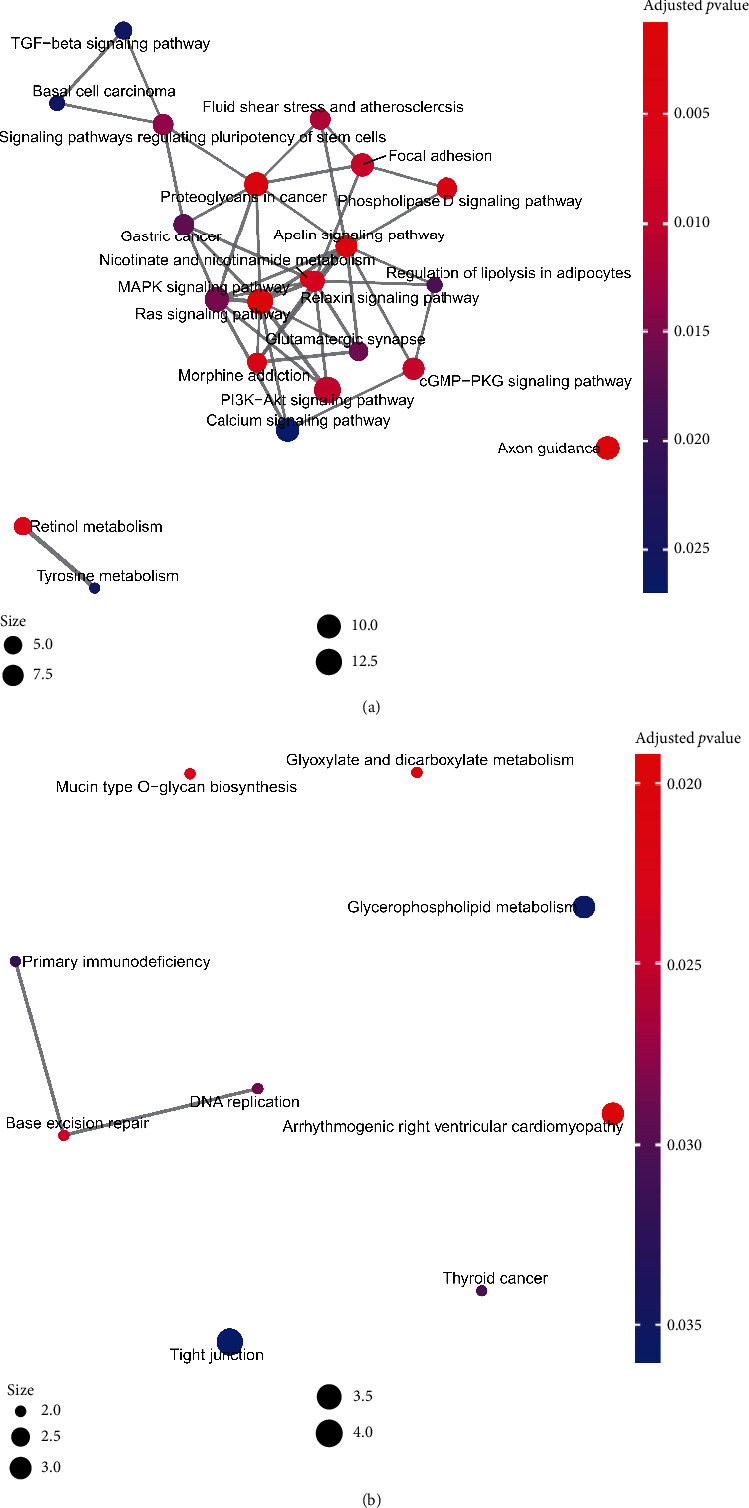
KEGG enrichment plots of the intersection genes from CCDC80 positively related coexpressed genes (CEGs) and downregulated differentially expressed genes (DEGs) (a), and CCDC80 negatively related CEGs and upregulated DEGs (b).
Meanwhile, the results of Reactome analysis revealed that CCDC80-related downregulated DEGs may be relative to some metabolism-related pathways, such as “Integration of energy metabolism,” “Metabolism of lipids,” “Triglyceride metabolism,” and “Metabolism of vitamins and cofactors,” while CCDC80-related upregulated DEGs are enriched in some cell cycle-related pathways, such as “Cell cycle,” “M phase,” and “Cell cycle checkpoint” (Figure S7).
Following the cell line of OVCA, GSEA revealed that high- and low-CCDC80 groups were both enriched in some immune-related gene sets, such as “GSE26912_TUMORICIDAL_VS_CTRL_MACROPHAGE_UP,” “GSE30971_2H_VS_4H_LPS_STIM_MACROPHAGE_WBP7_KO_UP,” and “GSE32901_NAIVE_VS_TH1_CD4_TCELL_UP” (Figure 8).
Figure 8.
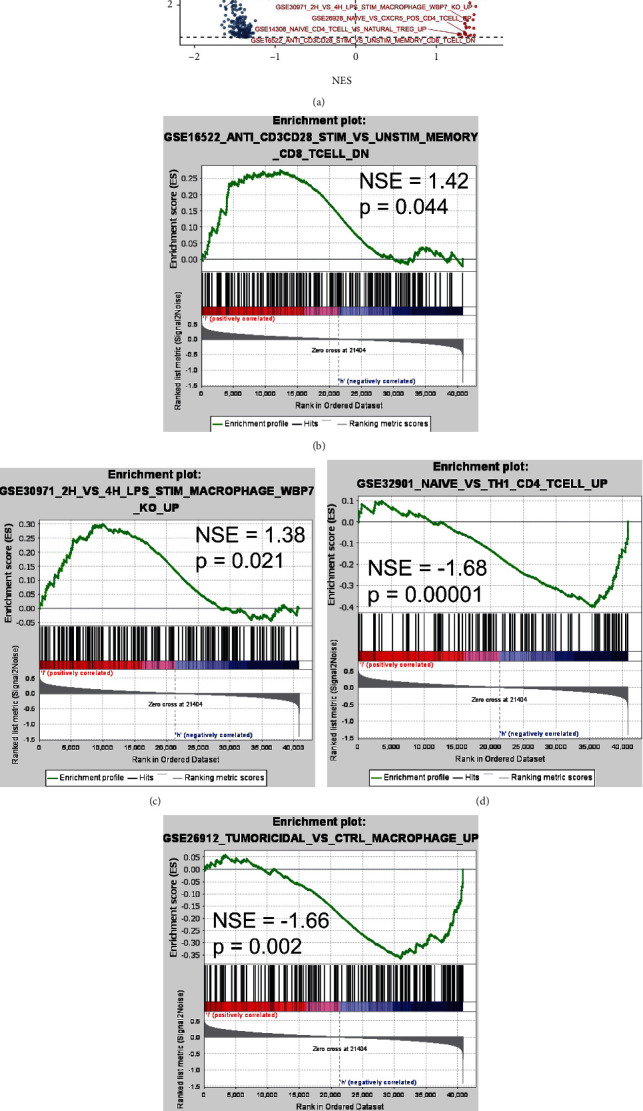
A volcano plot shows the results of GSEA based on the OVCA cell lines and enrichment plots of immune-related gene sets in low-CCDC80 group (b) and (c) and high-CCDC80 group (d) and (e).
3.5. The Potential of TF Regulatory CCDC80 in OVCA
By overlapping the predicted TFs from Cistrome DB, positive-correlated genes of CCDC80, and downregulated genes in OVCA, we obtained two initial TFs (NR3C1, PBX3) regulating CCDC80 (Figure S8). The motifs of NR3C1 and PBX3 are demonstrated in Figures 9(a) and 9(b), and a ChIP-seq peak of NR3C1 was observed before TSS of CCDC80 (Figure 9(c)). However, the ChIP-seq peak of PBX3 was missing before the TSS of CCDC80 (Figure 9(d)), which indicated that PBX3 may not be the regulatory TF of CCDC80. Using the JASPAR and FIMO tools, a perspective binding sequence in common was obtained—AAGAAAAGAATGTAGCC.
Figure 9.
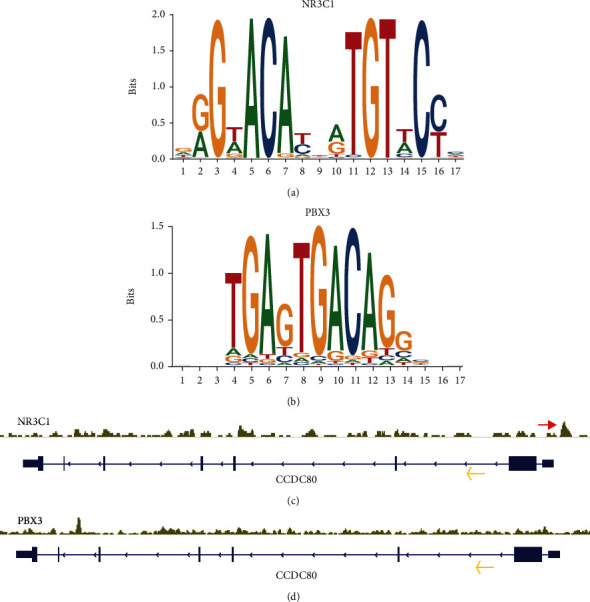
Seqlogos of the motifs of transcription factor NR3C1 (a) and PBX3 (b); ChIP-seq peak (see red arrow) of NR3C1 in the upstream of the transcription start site of CCDC80 (c); and the yellow arrow indicates the transcription direction of CCDC80; no ChIP-seq peak of PBX3 in the upstream of the transcription start site of CCDC80 (d).
3.6. The Relationship between CCDC80 Expression and Drug Sensitivity in OVCA Cell Lines
By comparing the estimated IC50 between high- and low-CCDC80 cell lines of OVCA, we found that the estimated IC50 of the ABL signaling inhibitor (nilotinib and tipifarnib) and DNA replication inhibitor (doxorubicin and mitomycin C) in the high-CCDC80 group exceeded that in the low-CCDC80 group (Figures 10(a), 10(b), 10(d), and 10(e)). However, the IC50 of some classic anticarcinogens, such as 5-fluorouracil and afatinib, showed a nonsignificant difference between the two groups (Figures 10(c) and 10(i)).
Figure 10.
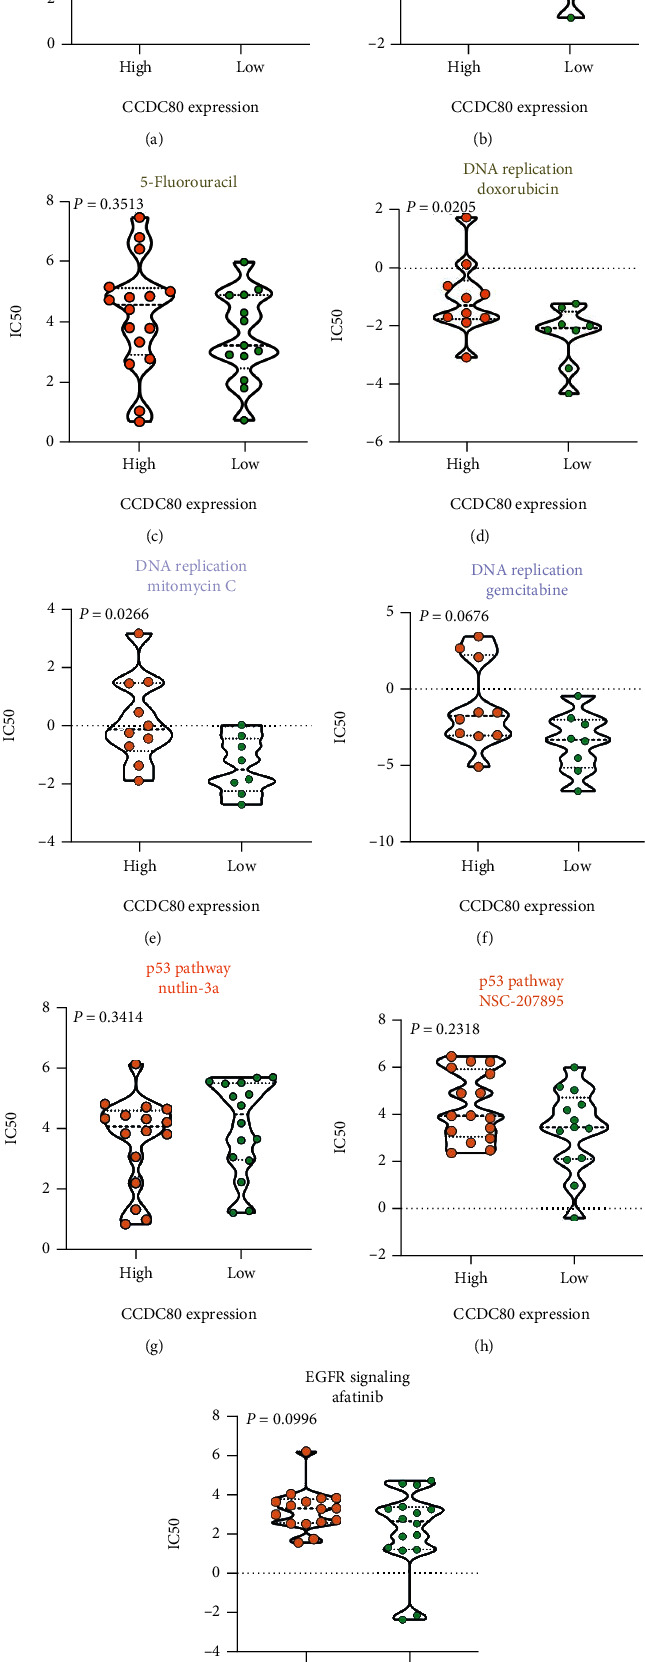
Violin plots visualizing the differences of estimated half maximal inhibitory concentration (IC50) of compounds between high- and low-CCDC80 expression group.
4. Discussion
In this study, we revealed the downregulation of CCDC80 at the protein level based on tissue microarrays (number of OVCA = 150, number of non − OVCA = 46). Via RNA-seq and gene chip data, we substantiated this decreasing trend at the mRNA level with a large sample size (number of OVCA = 652, number of non − OVCA = 200) and different approaches (t-test and combined SMD). Cocurrently, we identified that the expression of CCDC80 was related to the TME landscape in OVCA using the CIBERSORT algorithm and ssGSEA. Also, we found that NR3C1 may be a potential upstream TF of CCDC80. Moreover, following the RNA-seq in cell lines and IC50 of compounds, we identified that the expression status of CCDC80 may have a relationship with drug sensitivity.
In previous study, 21 OVCA samples were used to detect the low expression of CCDC80 mRNA by RT-qPCR [18]. However, no study reported the expression status of CCDC80 at both mRNA and protein level in OVCA with multiple detection means and multicenter samples (based on the PubMed database, as of May 16, 2021). Herein, we conducted a subgroup analysis to calculate integrated SMD and first revealed that CCDC80 expression in OVCA tissues was below that in non-OVCA tissues with 1048 multicenter samples via multiple approaches (IHC, gene chips, and RNA-seq).
The clinical significance of CCDC80 in malignant tumors was attractive. In previous studies, CCDC80 was reported as a prognostic signature in serous ovarian carcinoma, colorectal cancer, and muscle-invasive bladder cancer [26–28]. However, no study has revealed the discriminatory capacity of CCDC80 in malignant tumors. In our study, an AUC = 0.76 (95% CI: 0.72–0.80) of sROC indicated a moderate ability of CCDC80 to distinguish OVCA from nontumor ovary. Unfortunately, due to the small clinical sample size and lack of follow-up information, the relationship between CCDC80 and clinical parameters and the prognostic value of CCDC80 in OVCA was unexplored.
Despite neoplastic cells, the components of tumors have numerous normal cells incorporating fibroblasts, inflammatory immunocytes, and epithelial cells [8, 29]. Many studies have illustrated that TME may play a dynamic role in the biological behaviors of tumors and may be a potential therapy target of OVCA [8, 30–34]. TME is an essential element to consider when stimulating the antitumor immunoreaction since TME contains many types of immunocytes and stromal cells. For example, tumor-infiltrating CD20+ B-cells, such as naive B-cells, were found to act as antigen-presenting cells and to facilitate antitumor immunity and may negatively regulate tumor growth [35–37]. Tumor-infiltrating B-cell can expedite the tumor antigens present to stimulate the function of T lymphocytes via upregulating costimulatory molecules (such as CD80/86) and HLA-II [38]. Existing evidence has shown that some B-cell-related pathways (such as CCL19, 21/CCR7, and CXCL13/CXCR5 axes) can induce the formation of tertiary lymphoid structures and activate the local antitumor immune response [39]. In the present study, through the CIBERSORT algorithm and ssGSEA, we found that the high expression of CCDC80 was related to a high fraction of infiltrating naive B-cells and a high score of B-cell-related pathways, which revealed that CCDC80 may act as a tumor suppressor via effecting B lymphocytes. The result of GSEA following the OVCA cell line showed that CCDC80 may participate in some immune-related biological processes, but these still need further research.
We performed KEGG pathway enrichment analysis and found that positive-related DEGs of CCDC80 were enriched in Ras signaling and proteoglycans in the cancer pathway. A study has reported that the Ras signaling pathway activates the tumor-related fibroblast and stimulates the proliferation of cancer cell [40]. Another study found that Ras signaling may participate in the process of prostate cancer metastasis to bone via interaction with Wnt signaling [41]. Proteoglycan is a type of biomacromolecule comprising a protein core and glycosaminoglycan. Proteoglycan is an essential regulatory factor of the extracellular matrix (ECM) and can implicate the biological behaviors of cells through interaction with cytokines, adhesion moleculars, or growth factors, which are critical in tumorigenesis and tumor metastasis [42, 43]. Moreover, proteoglycan can affect TME and tumor-related immune responses and even participate in metabolic reprograming [42, 44]. However, the impact of the Ras signaling pathway and proteoglycans on OVCA has been partially explained. Following the KEGG results, we inferred that the downregulated CCDC80 may impact the Ras signaling pathway and proteoglycan and may be involved in the tumorigenesis and development in OVCA, which still needs more validation.
Regarding the metabolic process and pathways, the metabolism of lipids was significant in our Reactome analysis. Existing evidence has revealed that two lipids (arachidonic acid and lysophosphatidic acid) relate to the dysregulated Ca2+ channels and Ca2+-activated potassium and impact cell migration and invasion in OVCA [45]. Furthermore, the metabolism of lipids was proved to be considerable for maintaining cancer stem cells, and the level of unsaturated lipids in OVCA stem cells was significantly high, which indicated that the lipid-related metabolic process may be the potential therapeutic target for OVCA [46–48]. A study has reported that CCDC80 may be an inhibitor in the metabolism of lipids and adipogenesis [49]. In our study, we inferred that the downregulated CCDC80 may influence the metabolism of lipids and facilitate the development of OVCA.
To further study the underlying molecular mechanisms of downregulated CCDC80 in OVCA, we explored the upstream regulatory TFs of CCDC80. Previously, CCDC80 was reported as a downstream target gene for TFs YAP/TAZ [50]. In the current study, we identified that NR3C1 may be a potential TF regulating CCDC80 in OVCA, which clarifies the molecular mechanisms of CCDC80 in OVCA.
Nilotinib, a type of tyrosine kinase inhibitor, was used to treat chronic myeloid leukemia [51, 52]. A study reported that nilotinib induces the apoptosis of OVCA cells via a mitochondrion-dependent process [53]. Tipifarnib, a highly selective farnesyltransferase, was reported to induce apoptosis, tumorigenesis cease, and regression of head and neck squamous cell carcinoma in vivo [54]. Also, tipifarnib may reduce the viability of OVCA cells in vitro [55]. Mitomycin C is a well-known antitumor drug that can form deoxyadenosine monoadducts with DNA and block the replication of DNA to impede the proliferation of cancer cell [56]. One clinical trial found that mitomycin C plus cisplatin has a promising effect in treating recurrent BRCA1-related OVCA [57]. Though these drugs tended to have a potential capacity in the treatment of OVCA, the resistance of drugs was common recently [58–60]. Some studies have reported the mechanisms and prediction biomarkers of resistance [61–63], whereas more exploration needed to carry out concerning the chemotherapeutic resistance. In our study, we found the estimated IC50 of nilotinib, tipifarnib, and mitomycin C in high-CCDC80 OVCA cells exceeded that in low-CCDC80 OVCA cells, which indicates CCDC80 is expected to be a biomarker to forecast the sensitivity of antineoplastic drugs. Our results also identified the dysregulation of CCDC80 in OVCA might play a role in the resistance of chemotherapy. But it still needs experiments and large-scale clinical trials for further verification.
Overall, our study demonstrated the downregulated trend of CCDC80 at both the mRNA and protein levels in OVCA, and CCDC80 may act as a tumor suppressor by affecting the TME and metabolism. Nevertheless, there were still some limitations. First, the collection of clinical samples and clinicopathological parameters was limited, making the clinical value of CCDC80 not to be revealed. Furthermore, the molecular mechanisms of CCDC80 and drug sensitivity still need further research and validation via experiments in vitro and in vivo and large-scale clinical trials.
5. Conclusion
Briefly, by combining the data from in-house IHC and a high-throughput database, we revealed that CCDC80 was downregulated in OVCA and that CCDC80 probably has an intimate relationship with TME and metabolism in OVCA. Moreover, we identified that NR3C1 may be a latent TF regulating CCDC80 and that CCDC80 may be an indicator to forecast drug sensitivity, but it needs further exploration.
Acknowledgments
The authors would like to thank Guangxi Key Laboratory of Medical Pathology for technical supports. The research was funded by Guangxi Zhuang Autonomous Region Health Commission Self-financed Scientific Research Project (Z20180979 and Z20210265), the Fund of Future Academic Star of Guangxi Medical University (WLXSZX21117), Guangxi Medical University 2021 Undergraduate Innovation and Entrepreneurship Training Program (202110598124), Guangxi Educational Science Planning Key Project (2021B167), Guangxi Higher Education Undergraduate Teaching Reform Project (2020JGA146), and Guangxi Medical University Education and Teaching Reform Project (2019XJGZ04).
Data Availability
The original data are available from the corresponding author upon reasonable request.
Conflicts of Interest
The authors declare that there is no conflict of interest.
Supplementary Materials
Table S1: Kyoto Encyclopedia of Genes and Genomes analysis of the intersection of CCDC80 related coexpressed genes and differentially expressed genes. Figure S1: the flow chart of screening OVCA-related datasets for this study. Figure S2: Venn diagrams for the intersection genes consists of CCDC80 positively related CEGs and downregulated DEGs (a), and intersection genes consist of CCDC80 negatively related CEGs and upregulated DEGs (b). Figure S3: bubble plots of GO annotation analysis based on intersection genes from CCDC80 positively related CEGs and downregulated DEGs (a), and CCDC80 negatively related CEGs and upregulated DEGs (b). Figure S4: Circle plots of DO annotation analysis based on intersection genes from CCDC80 positively related CEGs and downregulated DEGs (a), and CCDC80 negatively related CEGs and upregulated DEGs (b). Figure S5: visualization of Ras signaling pathway. Figure S6: visualization of proteoglycans in cancer pathway. Figure S7: circle plots of Reactome pathway analysis based on intersection genes from CCDC80 positively related CEGs and downregulated DEGs (a), and CCDC80 negatively related CEGs and upregulated DEGs (b). Figure S8: Venn diagrams for the intersection genes consist of CCDC80 positively related CEGs, downregulated DEGs, and predicted TFs from Cistrome DB.
References
- 1.Berger A. C., Korkut A., Kanchi R. S., et al. A comprehensive pan-cancer molecular study of gynecologic and breast cancers. Cancer Cell . 2018;33(4):690–705.e9. doi: 10.1016/j.ccell.2018.03.014. [DOI] [PMC free article] [PubMed] [Google Scholar]
- 2.Abiko K., Hayashi T., Yamaguchi K., Mandai M., Konishi I. Potential novel ovarian cancer treatment targeting myeloid-derived suppressor cells. Cancer Investigation . 2021;39(4):310–314. doi: 10.1080/07357907.2020.1871487. [DOI] [PubMed] [Google Scholar]
- 3.Carey P., Low E., Harper E., Stack M. S. Metalloproteinases in ovarian cancer. International Journal of Molecular Sciences . 2021;22(7):p. 3403. doi: 10.3390/ijms22073403. [DOI] [PMC free article] [PubMed] [Google Scholar]
- 4.Seyed Hosseini E., Alizadeh Zarei M., Babashah S., et al. Studies on combination of oxaliplatin and dendrosomal nanocurcumin on proliferation, apoptosis induction, and long non-coding RNA expression in ovarian cancer cells. Cell Biology and Toxicology . 2019;35(3):247–266. doi: 10.1007/s10565-018-09450-8. [DOI] [PubMed] [Google Scholar]
- 5.Ray-Coquard I., Vanacker H., le Saux O., Tredan O. Overcoming resistance to PARP inhibitor in epithelial ovarian cancer, are we ready? eBioMedicine . 2020;61:p. 103046. doi: 10.1016/j.ebiom.2020.103046. [DOI] [PMC free article] [PubMed] [Google Scholar]
- 6.Feng Y., Wang D., Xiong L., Zhen G., Tan J. Predictive value of RAD51 on the survival and drug responsiveness of ovarian cancer. Cancer Cell International . 2021;21(1):p. 249. doi: 10.1186/s12935-021-01953-5. [DOI] [PMC free article] [PubMed] [Google Scholar]
- 7.Skanjeti A., Dhomps A., Paschetta C., Tordo J., Giammarile F. Sentinel node mapping in gynecologic cancers: a comprehensive review. Seminars in Nuclear Medicine . 2019;49(6):521–533. doi: 10.1053/j.semnuclmed.2019.06.012. [DOI] [PubMed] [Google Scholar]
- 8.Jiang Y., Wang C., Zhou S. Targeting tumor microenvironment in ovarian cancer: Premise and promise. Cancer . 2020;1873(2, article 188361) doi: 10.1016/j.bbcan.2020.188361. [DOI] [PubMed] [Google Scholar]
- 9.Siegel R. L., Miller K. D., Fuchs H. E., Jemal A. Cancer statistics, 2021. CA: a cancer journal for clinicians . 2021;71(1):7–33. doi: 10.3322/caac.21654. [DOI] [PubMed] [Google Scholar]
- 10.Wang S., Wang Z., Li J., et al. Splicing factor USP39 promotes ovarian cancer malignancy through maintaining efficient splicing of oncogenic HMGA2. Cell Death & Disease . 2021;12(4):p. 294. doi: 10.1038/s41419-021-03581-3. [DOI] [PMC free article] [PubMed] [Google Scholar]
- 11.Kleinmanns K., Fosse V., Davidson B., et al. CD24-targeted intraoperative fluorescence image-guided surgery leads to improved cytoreduction of ovarian cancer in a preclinical orthotopic surgical model. eBioMedicine . 2020;56:p. 102783. doi: 10.1016/j.ebiom.2020.102783. [DOI] [PMC free article] [PubMed] [Google Scholar]
- 12.Xu G., Shi Y., Ling X., et al. HHLA2 predicts better survival and exhibits inhibited proliferation in epithelial ovarian cancer. Cancer Cell International . 2021;21(1):p. 252. doi: 10.1186/s12935-021-01930-y. [DOI] [PMC free article] [PubMed] [Google Scholar]
- 13.Gong D., Zhang Q., Chen L. Y., et al. Coiled-coil domain-containing 80 accelerates atherosclerosis development through decreasing lipoprotein lipase expression via ERK1/2 phosphorylation and TET2 expression. European Journal of Pharmacology . 2019;843:177–189. doi: 10.1016/j.ejphar.2018.11.009. [DOI] [PubMed] [Google Scholar]
- 14.Bommer G. T., Jäger C., Dürr E. M., et al. _DRO1_ , a Gene Down-regulated by Oncogenes, Mediates Growth Inhibition in Colon and Pancreatic Cancer Cells. The Journal of Biological Chemistry . 2005;280(9):7962–7975. doi: 10.1074/jbc.M412593200. [DOI] [PubMed] [Google Scholar]
- 15.Ferraro A., Schepis F., Leone V., et al. Tumor suppressor role of the CL2/DRO1/CCDC80 gene in thyroid carcinogenesis. The Journal of Clinical Endocrinology and Metabolism . 2013;98(7):2834–2843. doi: 10.1210/jc.2012-2926. [DOI] [PubMed] [Google Scholar]
- 16.Pei G., Lan Y., Lu W., Ji L., Hua Z. C. The function of FAK/CCDC80/E-cadherin pathway in the regulation of B16F10 cell migration. Oncology Letters . 2018;16(4):4761–4767. doi: 10.3892/ol.2018.9159. [DOI] [PMC free article] [PubMed] [Google Scholar]
- 17.Ferragud J., Avivar-Valderas A., Pla A., de Las Rivas J., de Mora J. F. Transcriptional repression of the tumor suppressor DRO1 by AIB1. FEBS Letters . 2011;585(19):3041–3046. doi: 10.1016/j.febslet.2011.08.025. [DOI] [PubMed] [Google Scholar]
- 18.Leone V., Ferraro A., Schepis F., et al. The _cl2/dro1/ccdc80_ null mice develop thyroid and ovarian neoplasias. Cancer Letters . 2015;357(2):535–541. doi: 10.1016/j.canlet.2014.12.010. [DOI] [PubMed] [Google Scholar]
- 19.Liang Z. Q., Zhong L. Y., Li J., et al. Clinicopathological significance and underlying molecular mechanism of downregulation of basonuclin 1 expression in ovarian carcinoma. Experimental Biology and Medicine . 2021;15353702211052036 doi: 10.1177/15353702211052036. [DOI] [PMC free article] [PubMed] [Google Scholar]
- 20.Newman A. M., Liu C. L., Green M. R., et al. Robust enumeration of cell subsets from tissue expression profiles. Nature Methods . 2015;12(5):453–457. doi: 10.1038/nmeth.3337. [DOI] [PMC free article] [PubMed] [Google Scholar]
- 21.Hänzelmann S., Castelo R., Guinney J. GSVA: gene set variation analysis for microarray and RNA-seq data. BMC Bioinformatics . 2013;14(1):p. 7. doi: 10.1186/1471-2105-14-7. [DOI] [PMC free article] [PubMed] [Google Scholar]
- 22.Wu T., Hu E., Xu S., et al. clusterProfiler 4.0: A universal enrichment tool for interpreting omics data. The Innovation . 2021;2(3, article 100141) doi: 10.1016/j.xinn.2021.100141. [DOI] [PMC free article] [PubMed] [Google Scholar]
- 23.Xie C., Mao X., Huang J., et al. KOBAS 2.0: a web server for annotation and identification of enriched pathways and diseases. Nucleic acids research . 2011;39(suppl_2):W316–W322. doi: 10.1093/nar/gkr483. [DOI] [PMC free article] [PubMed] [Google Scholar]
- 24.Fornes O., Castro-Mondragon J. A., Khan A., et al. JASPAR 2020: update of the open-access database of transcription factor binding profiles. Nucleic Acids Research . 2020;48(D1):D87–D92. doi: 10.1093/nar/gkz1001. [DOI] [PMC free article] [PubMed] [Google Scholar]
- 25.Grant C. E., Bailey T. L., Noble W. S. FIMO: scanning for occurrences of a given motif. Bioinformatics (Oxford, England) . 2011;27(7):1017–1018. doi: 10.1093/bioinformatics/btr064. [DOI] [PMC free article] [PubMed] [Google Scholar]
- 26.Jiang W., Zhu D., Wang C., Zhu Y. An immune relevant signature for predicting prognoses and immunotherapeutic responses in patients with muscle-invasive bladder cancer (MIBC) Cancer Medicine . 2020;9(8):2774–2790. doi: 10.1002/cam4.2942. [DOI] [PMC free article] [PubMed] [Google Scholar]
- 27.Wang W. D., Wu G. Y., Bai K. H., et al. A prognostic stemness biomarker CCDC80 reveals acquired drug resistance and immune infiltration in colorectal cancer. Clinical and Translational Medicine . 2020;10(6, article e225) doi: 10.1002/ctm2.225. [DOI] [PMC free article] [PubMed] [Google Scholar]
- 28.Zheng M., Mullikin H., Hester A., et al. Development and validation of a novel 11-gene prognostic model for serous ovarian carcinomas based on lipid metabolism expression profile. International Journal of Molecular Sciences . 2020;21(23):p. 9169. doi: 10.3390/ijms21239169. [DOI] [PMC free article] [PubMed] [Google Scholar]
- 29.Binnewies M., Roberts E. W., Kersten K., et al. Understanding the tumor immune microenvironment (TIME) for effective therapy. Nature Medicine . 2018;24(5):541–550. doi: 10.1038/s41591-018-0014-x. [DOI] [PMC free article] [PubMed] [Google Scholar]
- 30.Hinchcliff E., Paquette C., Roszik J., et al. Lymphocyte-specific kinase expression is a prognostic indicator in ovarian cancer and correlates with a prominent B cell transcriptional signature. Cancer immunology, immunotherapy : CII . 2019;68(9):1515–1526. doi: 10.1007/s00262-019-02385-x. [DOI] [PMC free article] [PubMed] [Google Scholar]
- 31.CW M. C., Rodriguez G. M., Galpin K. J., Vanderhyden B. C. Ovarian cancer immunotherapy: preclinical models and emerging therapeutics. Cancers . 2018;10(8):p. 244. doi: 10.3390/cancers10080244. [DOI] [PMC free article] [PubMed] [Google Scholar]
- 32.Baci D., Bosi A., Gallazzi M., et al. The ovarian cancer tumor immune microenvironment (TIME) as target for therapy: a focus on innate immunity cells as therapeutic effectors. International Journal of Molecular Sciences . 2020;21(9):p. 3125. doi: 10.3390/ijms21093125. [DOI] [PMC free article] [PubMed] [Google Scholar]
- 33.Ahmed N., Escalona R., Leung D., Chan E., Kannourakis G. Tumour microenvironment and metabolic plasticity in cancer and cancer stem cells: perspectives on metabolic and immune regulatory signatures in chemoresistant ovarian cancer stem cells. Seminars in Cancer Biology . 2018;53:265–281. doi: 10.1016/j.semcancer.2018.10.002. [DOI] [PubMed] [Google Scholar]
- 34.Ghisoni E., Imbimbo M., Zimmermann S., Valabrega G. Ovarian cancer immunotherapy: turning up the heat. International Journal of Molecular Sciences . 2019;20(12):p. 2927. doi: 10.3390/ijms20122927. [DOI] [PMC free article] [PubMed] [Google Scholar]
- 35.Gupta P., Chen C., Chaluvally-Raghavan P., Pradeep S. B cells as an immune-regulatory signature in ovarian cancer. Cancers . 2019;11(7):p. 894. doi: 10.3390/cancers11070894. [DOI] [PMC free article] [PubMed] [Google Scholar]
- 36.Sarvaria A., Madrigal J. A., Saudemont A. B cell regulation in cancer and anti-tumor immunity. Cellular & Molecular Immunology . 2017;14(8):662–674. doi: 10.1038/cmi.2017.35. [DOI] [PMC free article] [PubMed] [Google Scholar]
- 37.Montfort A., Pearce O., Maniati E., et al. A strong B-cell response is part of the immune landscape in human high-grade serous ovarian metastases. Clinical cancer research : an official journal of the American Association for Cancer Research . 2017;23(1):250–262. doi: 10.1158/1078-0432.CCR-16-0081. [DOI] [PMC free article] [PubMed] [Google Scholar]
- 38.Wang S. S., Liu W., Ly D., Xu H., Qu L., Zhang L. Tumor-infiltrating B cells: their role and application in anti-tumor immunity in lung cancer. Cellular & Molecular Immunology . 2019;16(1):p. 18. doi: 10.1038/s41423-018-0027-x. [DOI] [PMC free article] [PubMed] [Google Scholar]
- 39.Tokunaga R., Naseem M., Lo J. H., et al. B cell and B cell-related pathways for novel cancer treatments. Cancer Treatment Reviews . 2019;73:10–19. doi: 10.1016/j.ctrv.2018.12.001. [DOI] [PMC free article] [PubMed] [Google Scholar]
- 40.Mishra R., Haldar S., Suchanti S., Bhowmick N. A. Epigenetic changes in fibroblasts drive cancer metabolism and differentiation. Endocrine-Related Cancer . 2019;26(12):R673–R688. doi: 10.1530/ERC-19-0347. [DOI] [PMC free article] [PubMed] [Google Scholar]
- 41.Lin S.-R., Mokgautsi N., Liu Y.-N. Ras and Wnt interaction contribute in prostate cancer bone metastasis. Molecules (Basel, Switzerland) . 2020;25(10):p. 2380. doi: 10.3390/molecules25102380. [DOI] [PMC free article] [PubMed] [Google Scholar]
- 42.Wei J., Hu M., Huang K., Lin S., Du H. Roles of proteoglycans and glycosaminoglycans in cancer development and progression. International Journal of Molecular Sciences . 2020;21(17):p. 5983. doi: 10.3390/ijms21175983. [DOI] [PMC free article] [PubMed] [Google Scholar]
- 43.Ahrens T. D., Bang-Christensen S. R., Jørgensen A. M., et al. The role of proteoglycans in cancer metastasis and circulating tumor cell analysis. Frontiers in cell and developmental biology . 2020;8:p. 749. doi: 10.3389/fcell.2020.00749. [DOI] [PMC free article] [PubMed] [Google Scholar]
- 44.Tzanakakis G., Neagu M., Tsatsakis A., Nikitovic D. Proteoglycans and immunobiology of cancer-therapeutic implications. Frontiers in Immunology . 2019;10:p. 875. doi: 10.3389/fimmu.2019.00875. [DOI] [PMC free article] [PubMed] [Google Scholar]
- 45.Kouba S., Ouldamer L., Garcia C., et al. Lipid metabolism and calcium signaling in epithelial ovarian cancer. Cell Calcium . 2019;81:38–50. doi: 10.1016/j.ceca.2019.06.002. [DOI] [PubMed] [Google Scholar]
- 46.Kim W.-Y. Therapeutic targeting of lipid synthesis metabolism for selective elimination of cancer stem cells. Archives of Pharmacal Research . 2019;42(1):25–39. doi: 10.1007/s12272-018-1098-z. [DOI] [PubMed] [Google Scholar]
- 47.Ghoneum A., Gonzalez D., Abdulfattah A. Y., Said N. Metabolic plasticity in ovarian cancer stem cells. Cancers . 2020;12(5):p. 1267. doi: 10.3390/cancers12051267. [DOI] [PMC free article] [PubMed] [Google Scholar]
- 48.Li J., Condello S., Thomes-Pepin J., et al. Lipid desaturation is a metabolic marker and therapeutic target of ovarian cancer stem cells. Cell Stem Cell . 2017;20(3):303–314.e5. doi: 10.1016/j.stem.2016.11.004. [DOI] [PMC free article] [PubMed] [Google Scholar]
- 49.Grill J. I., Neumann J., Herbst A., et al. Loss of DRO1/CCDC80 results in obesity and promotes adipocyte differentiation. Molecular and Cellular Endocrinology . 2017;439:286–296. doi: 10.1016/j.mce.2016.09.014. [DOI] [PubMed] [Google Scholar]
- 50.Pan W.-W., Moroishi T., Koo J. H., Guan K. L. Cell type-dependent function of LATS1/2 in cancer cell growth. Oncogene . 2019;38(14):2595–2610. doi: 10.1038/s41388-018-0610-8. [DOI] [PMC free article] [PubMed] [Google Scholar]
- 51.Jabbour E., Kantarjian H. Chronic myeloid leukemia: 2018 update on diagnosis, therapy and monitoring. American Journal of Hematology . 2018;93(3):442–459. doi: 10.1002/ajh.25011. [DOI] [PubMed] [Google Scholar]
- 52.Hochhaus A., Baccarani M., Silver R. T., et al. European LeukemiaNet 2020 recommendations for treating chronic myeloid leukemia. Leukemia . 2020;34(4):966–984. doi: 10.1038/s41375-020-0776-2. [DOI] [PMC free article] [PubMed] [Google Scholar]
- 53.Chen T.-C., Yu M. C., Chien C. C., Wu M. S., Lee Y. C., Chen Y. C. Nilotinib reduced the viability of human ovarian cancer cells via mitochondria-dependent apoptosis, independent of JNK activation. Toxicology in vitro : an international journal published in association with BIBRA . 2016;31:1–11. doi: 10.1016/j.tiv.2015.11.002. [DOI] [PubMed] [Google Scholar]
- 54.Gilardi M., Wang Z., Proietto M., et al. Tipifarnib as a precision therapy forHRAS-Mutant head and neck squamous cell carcinomas. Molecular Cancer Therapeutics . 2020;19(9):1784–1796. doi: 10.1158/1535-7163.MCT-19-0958. [DOI] [PMC free article] [PubMed] [Google Scholar]
- 55.Lee D. W., Lee W., Kwon M., Lee H. N. Dual inhibition of FOXM1 and its compensatory signaling pathway decreased the survival of ovarian cancer cells. Oncology Reports . 2021;45(1):390–400. doi: 10.3892/or.2020.7845. [DOI] [PubMed] [Google Scholar]
- 56.Zheng M., Hwang S., Snyder T., et al. Synthesis of Mitomycin C and decarbamoylmitomycin C _N_ 6 deoxyadenosine-adducts. Bioorganic Chemistry . 2019;92:p. 103280. doi: 10.1016/j.bioorg.2019.103280. [DOI] [PMC free article] [PubMed] [Google Scholar]
- 57.Gorodnova T. V., Sokolenko A. P., Kondratiev S. V., et al. Mitomycin C plus cisplatin for systemic treatment of recurrent BRCA1-associated ovarian cancer. Investigational New Drugs . 2020;38(6):1872–1878. doi: 10.1007/s10637-020-00965-8. [DOI] [PubMed] [Google Scholar]
- 58.Navas T., Kinders R. J., Lawrence S. M., et al. Clinical evolution of epithelial-mesenchymal transition in human carcinomas. Cancer Research . 2020;80(2):304–318. doi: 10.1158/0008-5472.CAN-18-3539. [DOI] [PMC free article] [PubMed] [Google Scholar]
- 59.Lee H. W., Chung W., Lee H. O., et al. Single-cell RNA sequencing reveals the tumor microenvironment and facilitates strategic choices to circumvent treatment failure in a chemorefractory bladder cancer patient. Genome Medicine . 2020;12(1):p. 47. doi: 10.1186/s13073-020-00741-6. [DOI] [PMC free article] [PubMed] [Google Scholar]
- 60.Calvo J. A., Fritchman B., Hernandez D., et al. Comprehensive mutational analysis of the BRCA1-associated DNA helicase and tumor-suppressor FANCJ/BACH1/BRIP1. Molecular cancer research : MCR . 2021;19(6):1015–1025. doi: 10.1158/1541-7786.MCR-20-0828. [DOI] [PMC free article] [PubMed] [Google Scholar]
- 61.Eadie L. N., Hughes T. P., White D. L. ABCB1 overexpression is a key initiator of resistance to tyrosine kinase inhibitors in CML cell lines. PLoS One . 2016;11(8, article e0161470) doi: 10.1371/journal.pone.0161470. [DOI] [PMC free article] [PubMed] [Google Scholar]
- 62.Alonso-Alonso R., Mondéjar R., Martínez N., et al. Identification of tipifarnib sensitivity biomarkers in T-cell acute lymphoblastic leukemia and T-cell lymphoma. Scientific Reports . 2020;10(1):p. 6721. doi: 10.1038/s41598-020-63434-5. [DOI] [PMC free article] [PubMed] [Google Scholar]
- 63.Wang C., Li A., Yang S., Qiao R., Zhu X., Zhang J. CXCL5 promotes mitomycin C resistance in non-muscle invasive bladder cancer by activating EMT and NF-κB pathway. Biochemical and Biophysical Research Communications . 2018;498(4):862–868. doi: 10.1016/j.bbrc.2018.03.071. [DOI] [PubMed] [Google Scholar]
Associated Data
This section collects any data citations, data availability statements, or supplementary materials included in this article.
Supplementary Materials
Table S1: Kyoto Encyclopedia of Genes and Genomes analysis of the intersection of CCDC80 related coexpressed genes and differentially expressed genes. Figure S1: the flow chart of screening OVCA-related datasets for this study. Figure S2: Venn diagrams for the intersection genes consists of CCDC80 positively related CEGs and downregulated DEGs (a), and intersection genes consist of CCDC80 negatively related CEGs and upregulated DEGs (b). Figure S3: bubble plots of GO annotation analysis based on intersection genes from CCDC80 positively related CEGs and downregulated DEGs (a), and CCDC80 negatively related CEGs and upregulated DEGs (b). Figure S4: Circle plots of DO annotation analysis based on intersection genes from CCDC80 positively related CEGs and downregulated DEGs (a), and CCDC80 negatively related CEGs and upregulated DEGs (b). Figure S5: visualization of Ras signaling pathway. Figure S6: visualization of proteoglycans in cancer pathway. Figure S7: circle plots of Reactome pathway analysis based on intersection genes from CCDC80 positively related CEGs and downregulated DEGs (a), and CCDC80 negatively related CEGs and upregulated DEGs (b). Figure S8: Venn diagrams for the intersection genes consist of CCDC80 positively related CEGs, downregulated DEGs, and predicted TFs from Cistrome DB.
Data Availability Statement
The original data are available from the corresponding author upon reasonable request.


