Abstract
Purpose:
To compare dynamic ranges and steps to measurement floors of peripapillary and macular metrics from a complex signal-based optical microangiography (OMAGC) optical coherence tomography angiography (OCTA) device for glaucoma with those of OCT measurements.
Design:
Cross-sectional study.
Methods:
Imaging of 252 eyes from 173 glaucoma subjects and 123 eyes from 92 non-glaucoma subjects from a glaucoma clinic was quantified using custom and commercial software. Metrics from OCT (retinal nerve fiber layer [RNFL], ganglion cell-inner plexiform layer [GCIPL]) and OCTA (custom: peripapillary vessel area density [pVAD], macular vessel area density [mVAD], macular vessel skeleton density [mVSD]; commercial: peripapillary perfusion density [pPDZ], macular perfusion density [mPDZ], macular vessel density [mVDZ]) were plotted against visual field mean deviation (MD) with linear change-point analyses, measurement floors, and steps to floors.
Results:
Mean MD (dB) for glaucomatous eyes was −5.77 (−6.45 to −5.10). The number of eyes with mild glaucoma (MD >−6), moderate glaucoma (MD −6 to −12), and severe glaucoma (MD <−12) were 164, 50, and 38, respectively. pPDZ yielded the lowest estimated floor at −26.6 dB (standard error [SE] 1.53), followed by OCTA macular metrics (−25 to −21 dB; SE 1.03) and pVAD (−17.6 dB, SE 1.06). RNFL and GCIPL produced floors at −17.8 (SE 0.927) and −23.6 dB (SE 1.14). The highest number of steps to measurement floor belonged to RNFL (7.20) and GCIPL (7.33), followed by pPDZ (4.25), mVAD (3.87), and mVSD (3.81), with 2.5 or fewer steps for pVAD, mPDZ, and mVDZ.
Conclusions:
pPDZ, mVAD, and mVSD had approximately 4 steps within their dynamic ranges, without true measurement floors, and thus may be useful in evaluating advanced glaucomatous progression. Improving OCTA test-retest repeatability could augment number of steps for OCTA metrics, increasing their clinical utility.
Glaucoma is one of the leading causes of permanent vision loss worldwide.1 Monitoring for disease progression and adjusting intraocular pressure (IOP) lowering treatment accordingly is a vital component of minimizing vision loss due to glaucoma.1 The structure-function relationship linking decreased peripapillary microvascular density, as measured by optical coherence tomography angiography (OCTA), and reduced visual field mean deviation in eyes with glaucoma has been well-established.2,3 In addition, a decrease in retinal microvasculature density in individuals with glaucoma has been shown to occur before loss of peripheral vision, indicating that such microvascular changes may be useful in early glaucoma detection.2,4 Taken together, current evidence implies that retinal microvasculature measurements could aid in detecting and monitoring for progression of glaucoma.
Glaucomatous damage manifests structurally as thinning of the neuroretinal rim and optic nerve excavation.5 The emergence of optical coherence tomography (OCT) in the early 2000s has offered a powerful complement to fundoscopy for glaucoma management with its ability to monitor optic nerve changes quantitatively, creating a dynamic range of retinal thickness values by which glaucomatous damage can be detected with increased granularity.6,13 For the management of moderate and severe glaucoma, however, the utility of OCT is tempered by the presence of floor effects, which represent stable measurement thresholds beyond which further reductions in retinal thickness cannot be reliably detected.7–9
OCTA, a non-invasive imaging technique for evaluating the retinal microvasculature, is a new technology that may address some of the limitations of OCT.10 Studies found that OCTA can identify changes in retinal structure even when OCT measurements of retinal nerve fiber layer (RNFL) and ganglion cell-inner plexiform layer (GCIPL) thicknesses have stabilized, suggesting a potential role of OCTA in the management of moderate and severe glaucoma.11–13 Importantly, like the tomographic measurements produced by OCT, OCTA measurements exhibit good repeatability.14,15
OCTA’s potential for ascertaining glaucomatous progression beyond the measurement floors of RNFL and GCIPL thicknesses from spectral-domain OCT (SD-OCT) has so far been seen using spectral-domain OCTA devices, such as the Avanti AngioVue device (Optovue, Fremont, CA),13 which uses split-spectrum amplitude-decorrelation angiography (SSADA), and swept-source OCTA devices, such as Topcon’s DRI OCT Triton device, which uses a multimodal, proprietary image analytical algorithm called PixelSmart.12 For the present study, a spectral-domain device with a complex signal-based optical microangiography (OMAGC)-based OCTA algorithm was used, which employs a composite measure that includes both amplitude and phase information in the OCT signal, affording it the ability to produce high-quality vascular connectivity, signal-to-noise ratio, and sensitivity to capillary blood flows.16 To our knowledge, no such studies have been performed with OMAGC devices.
This study aims to determine the dynamic ranges, measurement floors, MD values at those floors, and number of clinically discernable steps to those floors for peripapillary and macular OCTA metrics using an OMAGC-based OCTA device and to compare these calculations to those of OCT peripapillary RNFL and macular GCIPL thickness in a population of subjects with and without glaucoma. Metrics associated with lower MD values at their measurement floors were viewed to have relatively greater utility than other metrics in distinguishing clinical change in advanced glaucoma. Additionally, the number of steps within each metric’s dynamic range reflects the extent to which a meaningful difference between two measurements can be detected, and thus a greater number of steps to measurement floor was interpreted to be proportionally more clinically useful in identifying glaucomatous progression.8
METHODS
Participant Selection and Exclusion Criteria
Institutional Review Board (IRB)/Ethics Committee approval was obtained for the present study. The study adhered to the Health Insurance Portability and Accountability Act of 1996 and the Declaration of Helsinki. OCT and OCTA images were obtained between February 2016 and March 2020, and participants received comprehensive ophthalmologic evaluation by fellowship-trained glaucoma specialists. RNFL thickness and deviation maps from OCT (Cirrus HD-OCT 5000; Zeiss, Dublin, CA) were reviewed.
The glaucoma cohort comprised eyes affected by open angle glaucoma (OAG) identified by a fellowship-trained glaucoma specialist with a clinical exam demonstrating characteristic features, including an optic nerve rim defect (notching or localized thinning) with or without characteristic visual field defects (Humphrey Visual Field [HVF] 24–2; Zeiss). The non-glaucoma cohort comprised both healthy eyes, defined by normal clinic exam results, including non-glaucomatous optic discs and IOP of 21 mm Hg or less, and glaucoma suspect eyes. Glaucoma suspect eyes had clinical features potentially consistent with or characteristic of glaucoma, but not definitive enough to support a diagnosis of glaucoma. These features included any of the following: IOP >21 mm Hg, symmetric large cup-disc ratios (CDR) ≥0.5 without optic disc or visual field abnormality characteristic of or compatible with glaucoma, marked IOP asymmetry (≥5 mm Hg) between eyes, or CDR asymmetry ≥0.2 without visual field defect. Exclusion criteria were based upon Moghimi et al.13 and were as follows: visual field results with ≥33% fixation losses and false negatives and ≥15% false positives; subjects with visually significant neurologic illnesses (e.g., multiple sclerosis, stroke) and with neurologic illnesses that could affect visual field testing (e.g., dementia, Parkinson’s disease); subjects with comorbid narrow angles, history of non-glaucomatous optic neuropathies, retinal pathology (e.g., moderate and severe non-proliferative and proliferative diabetic retinopathy, hypertensive retinopathy), cystoid macular edema, and ocular trauma; cataract or glaucoma procedure <3 months prior to study date; subjects with OCT studies with signal strength <7; and subjects with OCTA studies that did not meet inclusion criteria of custom quality grading protocols. These protocols are based upon prior image grading protocols developed in the Richter Lab, and their grading criteria are regarded as image quality indicators in the literature on this subject.17–19
OCT and OCTA
6×6 mm OCT scans centered on the optic nerve head and macula were obtained using the Zeiss Cirrus™ 4000 or 5000. 6×6 mm OCTA scans centered on the optic nerve head and macula were obtained using the Zeiss Cirrus™ 5000 with AngioPlex® (software version 11.0, Carl Zeiss Meditec, Inc., Dublin, CA). The Zeiss Cirrus imaging modality is based on SD-OCT technology that uses an 840 nanometer superluminescent diode and acquires A-scans at a maximum rate of 68,000/second.17
RNFL OCT scans were taken using the Optic Disc Cube 200×200 µm imaging mode, which is centered on the optic disc using 200 B-scans containing 200 A-scans each that undergo thickness measurements from the internal limiting membrane to the RNFL-ganglion cell layer (GCL) interface. GCIPL OCT scans were obtained using the Macular Cube 512×128 µm imaging mode, which is centered on the macula using 128 B-scans containing 512 A-scans each that undergo thickness measurements from the GCL’s inner border to the inner plexiform layer’s (IPL) outer border. Peripapillary and macular OCTA images used the phase and magnitude information of multiple iterations of OCT B-scans at the same position to interpolate motion signals that act as proxies for blood flow. Automated segmentation of the RNFL and GCIPL in SD-OCT B-scans were then used to define the vascular territory of the superficial capillary plexus, from which en face angiographic images were generated.
OCTA Image Quantification
The microvasculature of 6×6 mm peripapillary and macular OCTA images was quantified using two different methods. The first method used a MATLAB-based custom quantification software with a graphical user interface (MATLAB R2019a; MathWorks, Natick, MA). Peripapillary and macular microvascular quantification with this MATLAB application initially involved selection of an annulus centered on the optic disc and foveal avascular zone (FAZ), respectively, with an inner diameter of 2 mm and an outer diameter of 6 mm. After annulus selection, the grayscale en face microangiographic images were binarized to generate black and white vessel maps using a three-part method comprising global thresholding, Hessian filtration, and adaptive thresholding. Global thresholding used the signal intensity of the areas within the optic disc or FAZ to establish the signal threshold for filtration of visual background noise. Hessian filtration and adaptive thresholding were combined to generate binarized vessel maps, in which vessels larger than 32 micrometers (µm) were excluded when microvascular area measurements were conducted.18
Custom quantification metrics derived from the binarized images included peripapillary and macular vessel area density (pVAD, mVAD) and macular vessel skeleton density (mVSD) (Figure 1). VAD refers to a unitless ratio between the image area occupied by medium-sized vessels, small vessels, and capillaries and the total image area. It is represented by the equation
where A represents white pixels counted as vessel area, X represents the total number of pixels in the quantification region, and i and j represent pixel coordinates. VSD is based upon a skeletonized, binarized image in which all vessel diameters are reduced to one pixel and specifies the fraction of all pixels occupied by skeletonized vessels. It is represented by the equation
where S represents white pixels counted as skeletonized vessel lengths, X represents the total number of pixels in the quantification region, and i and j represent pixel coordinates.19
Figure 1. Optical coherence tomography angiography (OCTA) images from the Zeiss Cirrus device and quantification maps generated from custom quantification software.
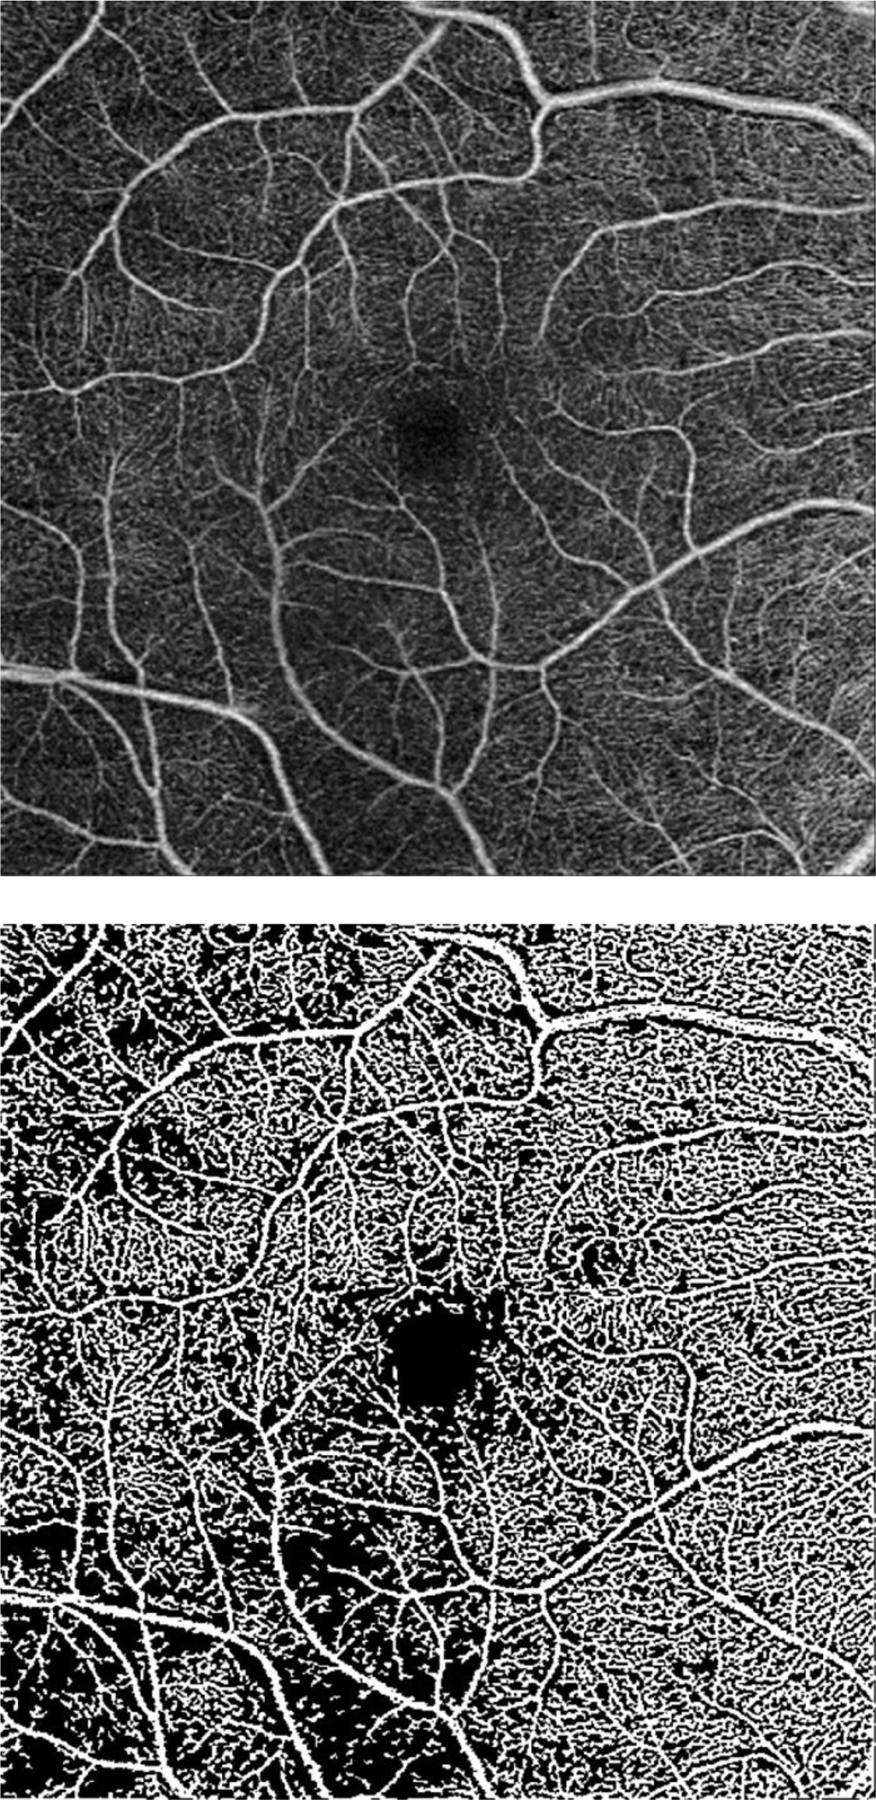
a. grayscale en face microangiographic image of macula; b. corresponding macular vessel area density (mVAD) map; c. corresponding macular vessel skeleton density (mVSD) map; d. grayscale en face microangiographic image of peripapillary region of a subject with mild glaucoma and an inferotemporal wedge defect; e. corresponding map of peripapillary vessel area density (pVAD) with exclusion of large vessels.
The second microvasculature quantification method employed commercially developed software (Angioplex software version 11.0, Carl Zeiss Meditech, Inc., Dublin, CA), which calculates peripapillary perfusion density (pPDZ), macular perfusion density (mPDZ), and macular vessel density (mVDZ). pPDZ represents the fraction of total 6×6 mm peripapillary OCTA image area occupied by perfused vasculature, which is analogous to VAD described above. Similarly mPDZ is analogous to mVAD. mVDZ represents the fraction of a macular OCTA image’s total number of pixels occupied by skeletonized vessels and is thus analogous to mVSD described above.
Statistical Analyses
Participant-specific demographic characteristics were compared between non-glaucomatous and glaucomatous subjects using unpaired t-tests and chi-square tests in Microsoft Excel (version 2002, build 12527.20880). Graphing and other statistical analyses were performed using R (version 3.6.1).20 Linear mixed-effect modeling adjusting for inter-eye correlation was performed using the R package lme4 for eye-specific characteristics and for the change-point analysis described below.21
Change points of linear regression spline models, slopes of models to the right of and to the left of change points, and corresponding R2 values of each OCT or OCTA metric versus mean deviation (MD) curve were determined via change-point analysis as executed in the R package segmented,22 which uses an iterative method to generate the piecewise formula
where b is the y-intercept, α is the slope of the curve to the left of the change point C, β + α is the slope of the curve to the right of the change point, and ε represents statistically independent, normally-distributed random error.13,23 As implemented in Wollstein et al.,23 the Davies test was employed to evaluate for slope independence between the two functions, and the MD at the points of maximal difference between the slopes were used as starting points for change-point estimation. The functions in the piecewise formula that the R Package segmented generated were then used to plot linear splines, which are components of piecewise, polynomial regressions separated by change points or knots.24 If OCT and OCTA metrics produced statistically significant change points, their measurement floors were determined via averaging metric values for each plot at VF MD values less than or equal to the VF MD at the corresponding change point. If, however, OCT and OCTA metrics did not produce statistically significant change points, an MD threshold of −20 dB was used as a surrogate for the change point in order to provide a minimum value of the metrics’ dynamic ranges. These methods of measurement floor estimation are analogous to those described in Mwanza et al.8 and implemented in Moghimi et al.13 OCT and OCTA metrics were classified as having true measurement floors if they had statistically significant change points and α slopes not statistically different than 0.
Calculated measurement floors constituted the lower bounds of each OCT and OCTA metric absolute dynamic range; mean metric values of non-glaucomatous subjects constituted the upper bounds of each absolute dynamic range. Absolute dynamic ranges were calculated by subtracting the metric values at each measurement floor from the metric’s value at the mean non-glaucomatous MD. Relative dynamic ranges were calculated by dividing absolute dynamic ranges by each metric’s non-glaucomatous mean value and then multiplying this result by 100%. Clinically and statistically distinct changes within a metric’s dynamic range were determined using metric-specific coefficients of repeatability (CRw). As previously reported, these changes were denoted as steps to the measurement floor.8,13 CRw values, the smallest real differences between two measurements obtained by the same device, are a measure of test-retest repeatability and were calculated using the formula
where 2.77 is derived from multiplying together 1.96 and √2, and Sw refers to the within-subject standard deviation for a given OCT or OCTA metric,25 also referred to as the test-retest standard deviation. Steps to the measurement floor of each OCT and OCTA metric were calculated by dividing each metric’s absolute dynamic range by its respective CRw value. Our group previously reported peripapillary vessel area density (pVAD) and perfusion density (pPDZ) CRw values, which were 0.065 and 0.024, respectively.15 CRw values for mVAD, mVSD, mVDZ, and mPDZ were calculated from USC Roski Eye Institute repeatability data to be 0.039, 0.018, 2.14, and 0.054, respectively. These repeatability data were derived from a peripapillary dataset consisting of 73 eyes from 48 patients and a macular dataset consisting of 69 eyes from 46 patients based on the same clinical population that was used for the present study. The RNFL CRw of 3.90 µm was derived from Mwanza et al., which used a Cirrus HD-OCT device.26 The GCIPL CRw value of 3.21 µm was calculated from pooled intra-subject test-retest standard deviation data from Mwanza et al.27 This study also used a Cirrus HD-OCT device.
OCT and OCTA metrics versus MD scatterplots, locally weighted scatterplot smoothing (LOESS) curves with 95% confidence intervals, and linear splines were created using R package ggplot2.28 LOESS is a local polynomial regression modeling technique that uses the y of a given x to select neighborhood y’ values to determine a local slope. Y’ values are weighted in a fashion proportional to the distance between its corresponding x’ and the original x.29 LOESS curves were used as visual comparison points for the splines representing the linear regressions to the right of and to the left of change points. In addition, Akaike information criterion (AIC) values, a metric used to compare data models based on disparate regression methods, were extrapolated from LOESS curves using R package paleoMAS30 and compared to spline model AICs, which we generated using the R method extractAIC.20
RESULTS
Of 628 eyes with glaucoma and 908 eyes without glaucoma, 252 eyes from 174 glaucoma subjects and 123 eyes from 92 non-glaucoma subjects were included in the present study. Table 1 lists demographic characteristics by participant and ocular characteristics by eye. There was no difference in age (p = 0.222), gender (p = 0.318), hypertension (p = 0.883), or diabetes mellitus (p = 0.940) between non-glaucoma and glaucoma subjects. Mean cup-to-disc (C/D) ratios were larger for glaucomatous eyes than for non-glaucomatous eyes (p = <0.001), while intraocular pressure (IOP) was similar for both subgroups (p = 0.186). Glaucomatous eyes had lower MD and higher PSD than those of their non-glaucomatous counterparts (p = <0.001). As expected, means of all OCT and OCTA metrics were significantly higher for non-glaucomatous eyes than for glaucomatous eyes.
Table 1.
Demographic and Clinical Characteristics of Study Population.
| Non-Glaucomatous Eyes | Open Angle Glaucoma Eyes | P value | |
|---|---|---|---|
| By Participant | n = 92 | n = 174 | |
| Mean Age, years | 65.5 (64.1 to 67.0) | 63.5 (61.2 to 65.8) | 0.222 |
| Gender, no. female (% female) | 49 (53.3) | 81 (46.8) | 0.318 |
| Self-Reported Hypertension, no. (%) | 33 (35.9) | 64 (36.8) | 0.883 |
| Self-Reported Diabetes Mellitus, no. (%) | 13 (14.1) | 24 (13.8) | 0.940 |
|
| |||
| By Eye | n = 123 | n = 252 | |
|
| |||
| C/D Ratio | 0.59 (0.53 to 0.65) | 0.78 (0.75 to 0.80) | <0.001 |
| IOP, mm Hg | 14.2 (12.9 to 15.6) | 13.7 (13.2 to 14.2) | 0.186 |
| 24–2 MD, Db | −1.17 (−2.96 to 0.642) | −5.77 (−6.45 to −5.10) | <0.001 |
| 24–2 PSD, Db | 2.10 (0.992 to 3.22) | 5.01 (4.60 to 5.42) | <0.001 |
| OCT RNFL Signal Strength | 8.3 (7.9 to 8.7) | 8.3 (8.2 to 8.4) | 0.898 |
| OCT GCIPL Signal Strength | 9.0 (8.7 to 9.4) | 8.9 (8.8 to 9.0) | 0.231 |
| Peripapillary OCTA Signal Strength | 9.5 (9.2 to 9.8) | 9.4 (9.2 to 9.5) | 0.087 |
| Macular OCTA Signal Strength | 9.6 (9.3 to 9.9) | 9.3 (9.2 to 9.4) | 0.001 |
| OCT Metrics | |||
| RNFL, µm | 88.0 (83.1 to 92.9) | 73.2 (71.5 to 74.9) | <0.001 |
| GCIPL Thickness, µm | 77.3 (73.6 to 80.9) | 68.3 (66.9 to 69.7) | <0.001 |
| Peripapillary OCTA Metrics | |||
| Pvad | 0.348 (0.324 to 0.371) |
0.282 (0.275 to 0.291) |
<0.001 |
| pPDZ | 0.423 (0.409 to 0.437) | 0.396 (0.391 to 0.401) | <0.001 |
| Macular OCTA Metrics | |||
| mVAD | 0.471 (0.451 to 0.491) | 0.426 (0.419 to 0.434) | <0.001 |
| mVSD | 0.186 (0.177 to 0.195) |
0.166 (0.163 to 0.170) |
<0.001 |
| mPDZ | 0.427 (0.408 to 0.445) | 0.414 (0.410 to 0.421) | 0.034 |
| mVDZ | 17.8 (17.1 to 18.5) | 17.2 (17.0 to 17.4) | 0.009 |
All demographic and clinical characteristics in this table are presented as mean (95% confidence interval) or frequency (percent). Participant-specific characteristic comparisons are based on t-tests and chi-square tests. Eye-specific characteristics adjusted for inter-eye correlation using linear mixed-effects modeling. Commercial OCTA metrics are separated from custom OCTA metrics with a horizontal black bar. C/D = cup-to-disc, IOP = intraocular pressure, MD = mean deviation, PSD = pattern standard deviation, OCT = optical coherence tomography, OCTA = OCTA, RNFL = retinal nerve fiber layer, GCIPL = ganglion cell-inner plexiform layer, pVAD = peripapillary vessel area density, pPDZ = peripapillary perfusion density, mVAD = macular vessel area density, mVSD = macular vessel skeleton density, mPDZ = macular perfusion density, mVDZ = macular vessel density.
OCT and OCTA metrics were plotted against their MD values in Figure 2 and Figure 3 with corresponding LOESS curves, best-fit splines derived from change-point analyses, and AICs for both models. Visual comparison of the LOESS curves and splines indicated concordance of the models for MD values above change points, which was supported by the splines falling within the 95% confidence bands of the LOESS regressions; however, there was greater visual divergence between the two models after change points and MD values below −15 dB for most metrics. AIC values were lower for all spline models compared to the corresponding LOESS curves, providing evidence that linear spline models were a superior fit.
Figure 2. Graphs of peripapillary optical coherence tomography (OCT) and optical coherence tomography angiography (OCTA) metrics versus mean deviation (MD) of 24–2 Humphrey visual field results.
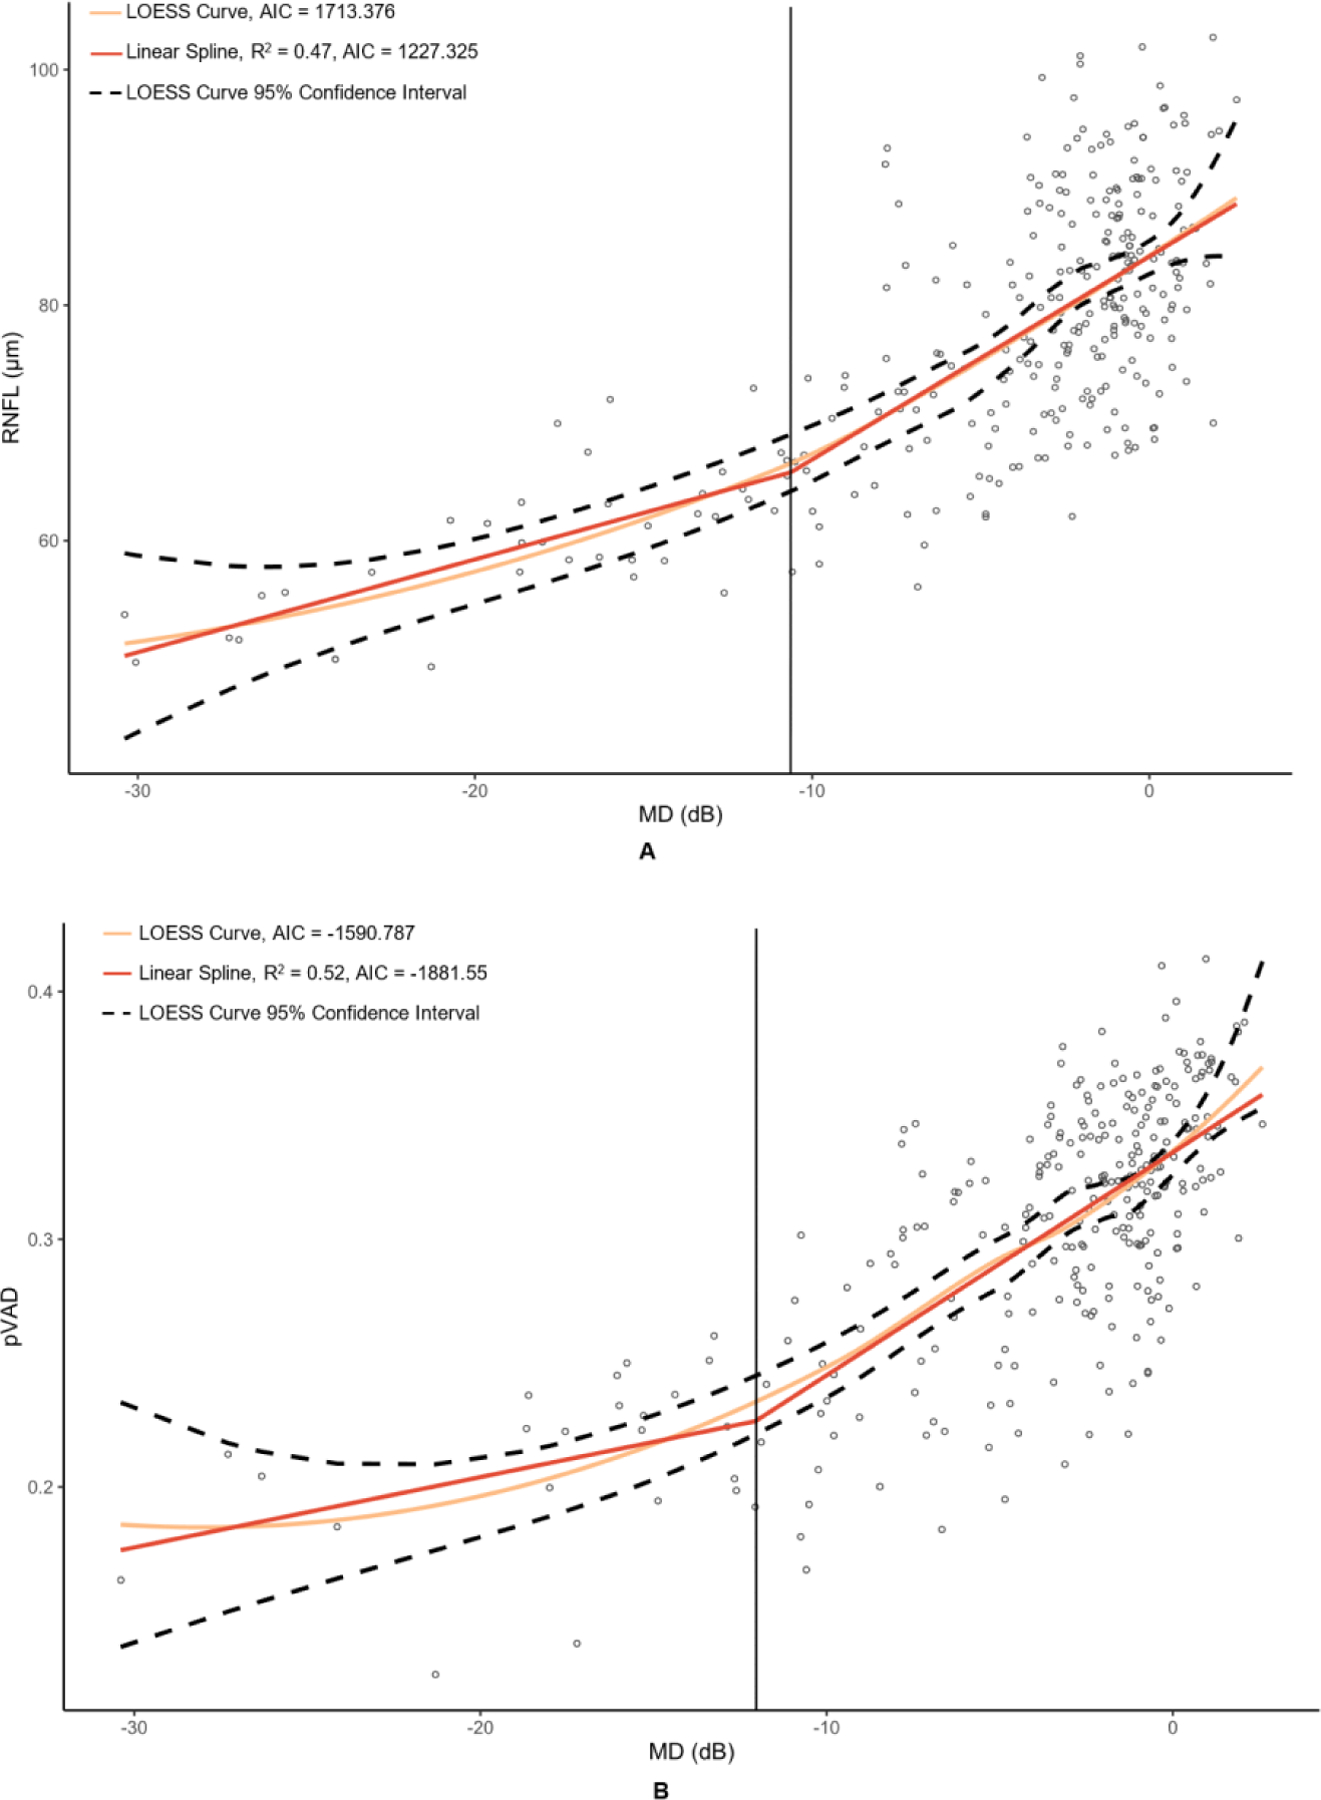
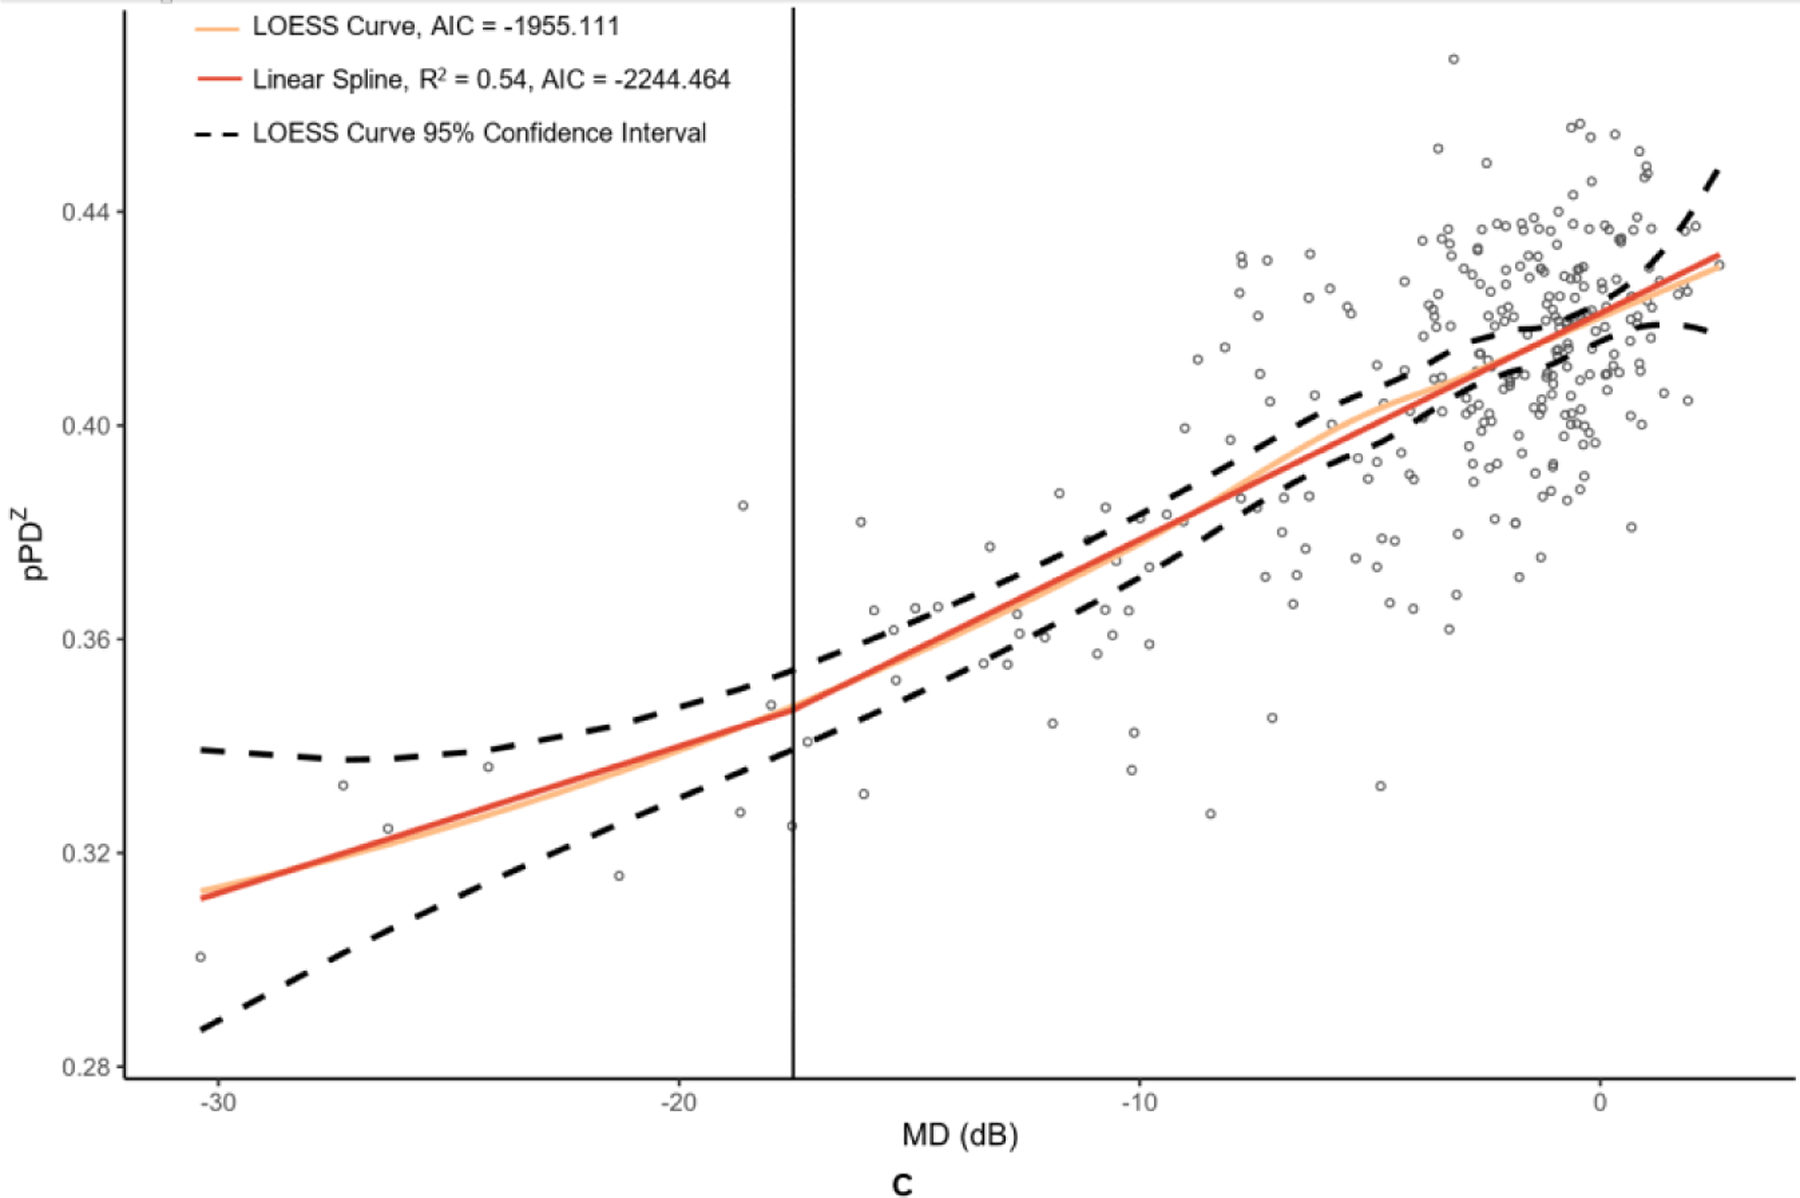
The metrics corresponding to this figure’s graphs are as follows: A = retinal nerve fiber layer (RNFL) (µm), B = peripapillary vessel area density (pVAD), and C = peripapillary perfusion density (pPDZ). dB = decibels. LOESS = local polynomial regression. AIC = Akaike’s information criterion. Vertical lines were added at change points to demarcate the point of transition between α + β (steep) and α (plateau) splines.
Figure 3. Graphs of macular optical coherence tomography (OCT) and optical coherence tomography angiography (OCTA) metric versus mean deviation (MD) of 24–2 Humphrey visual field results.
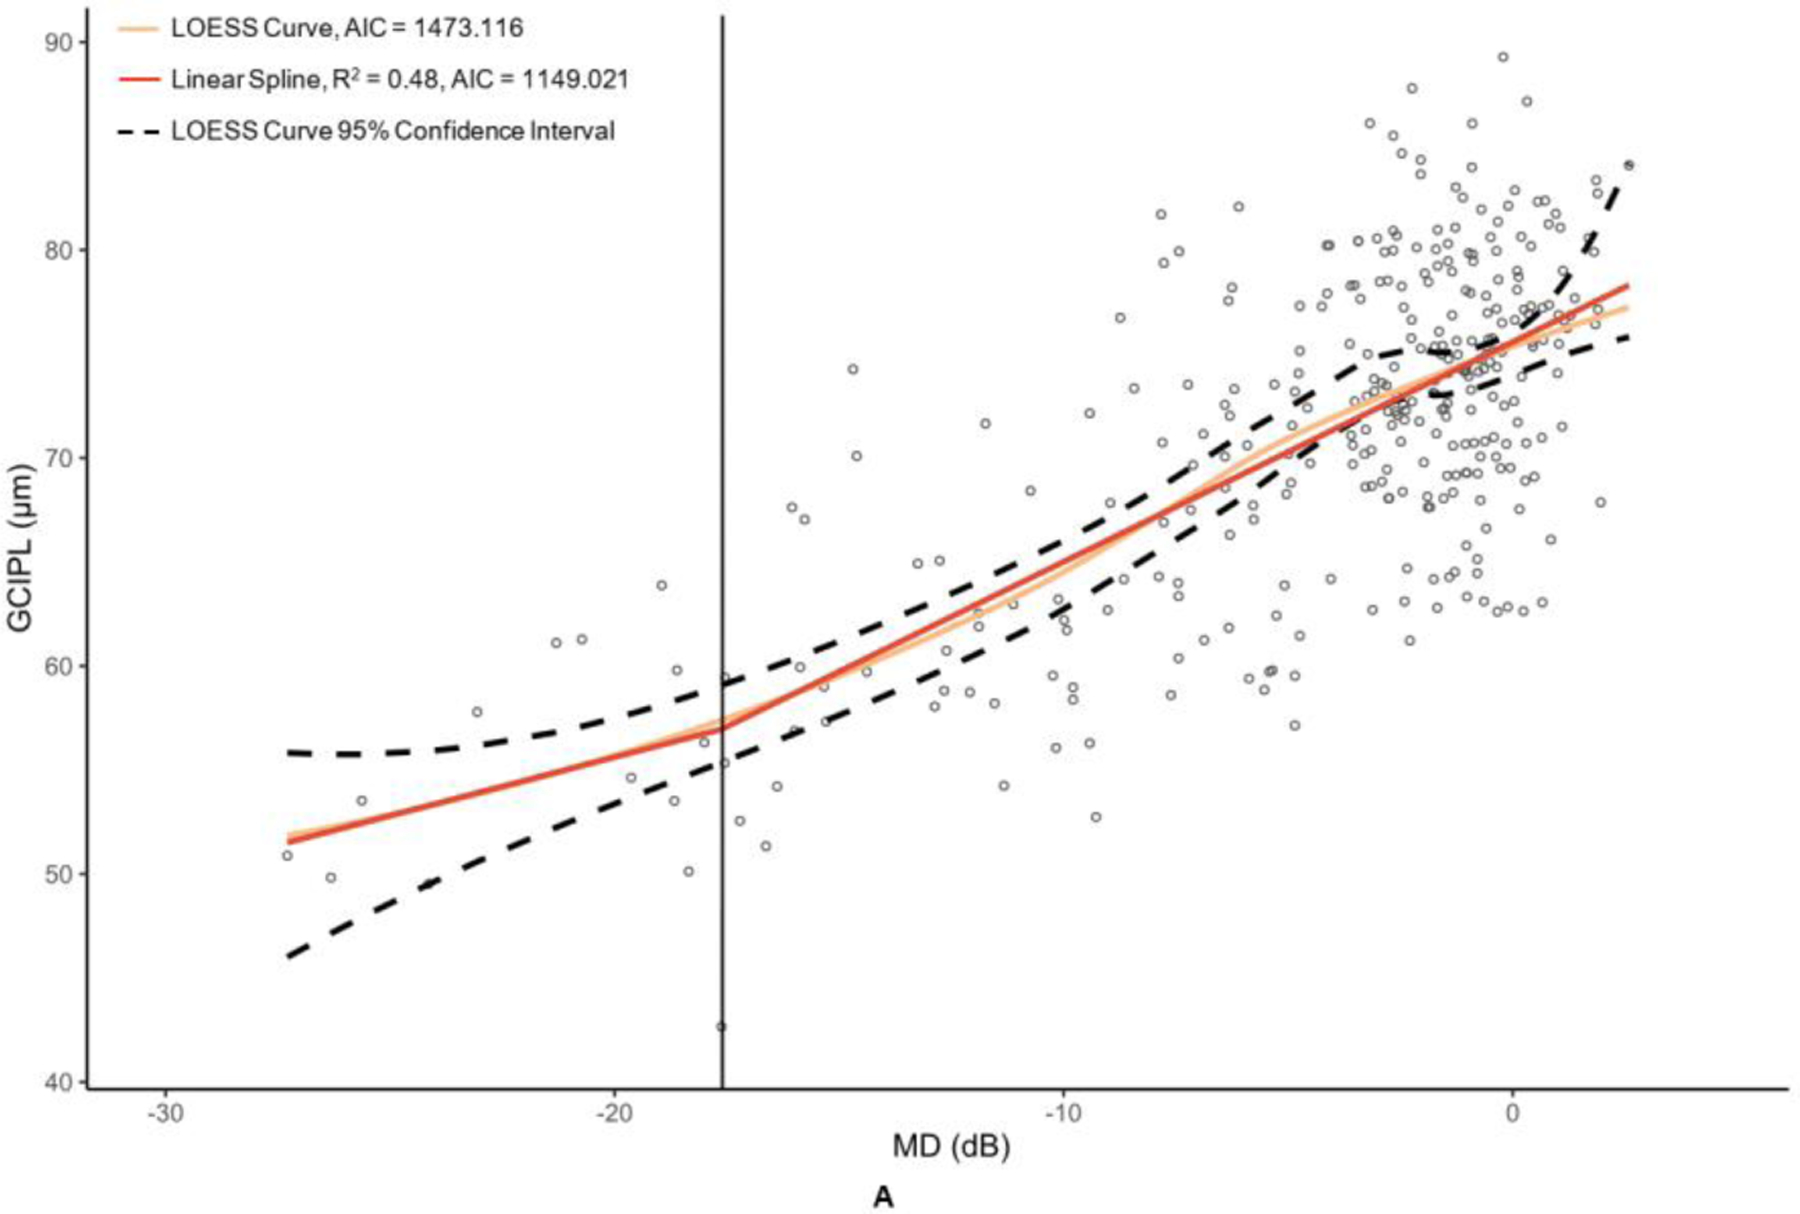
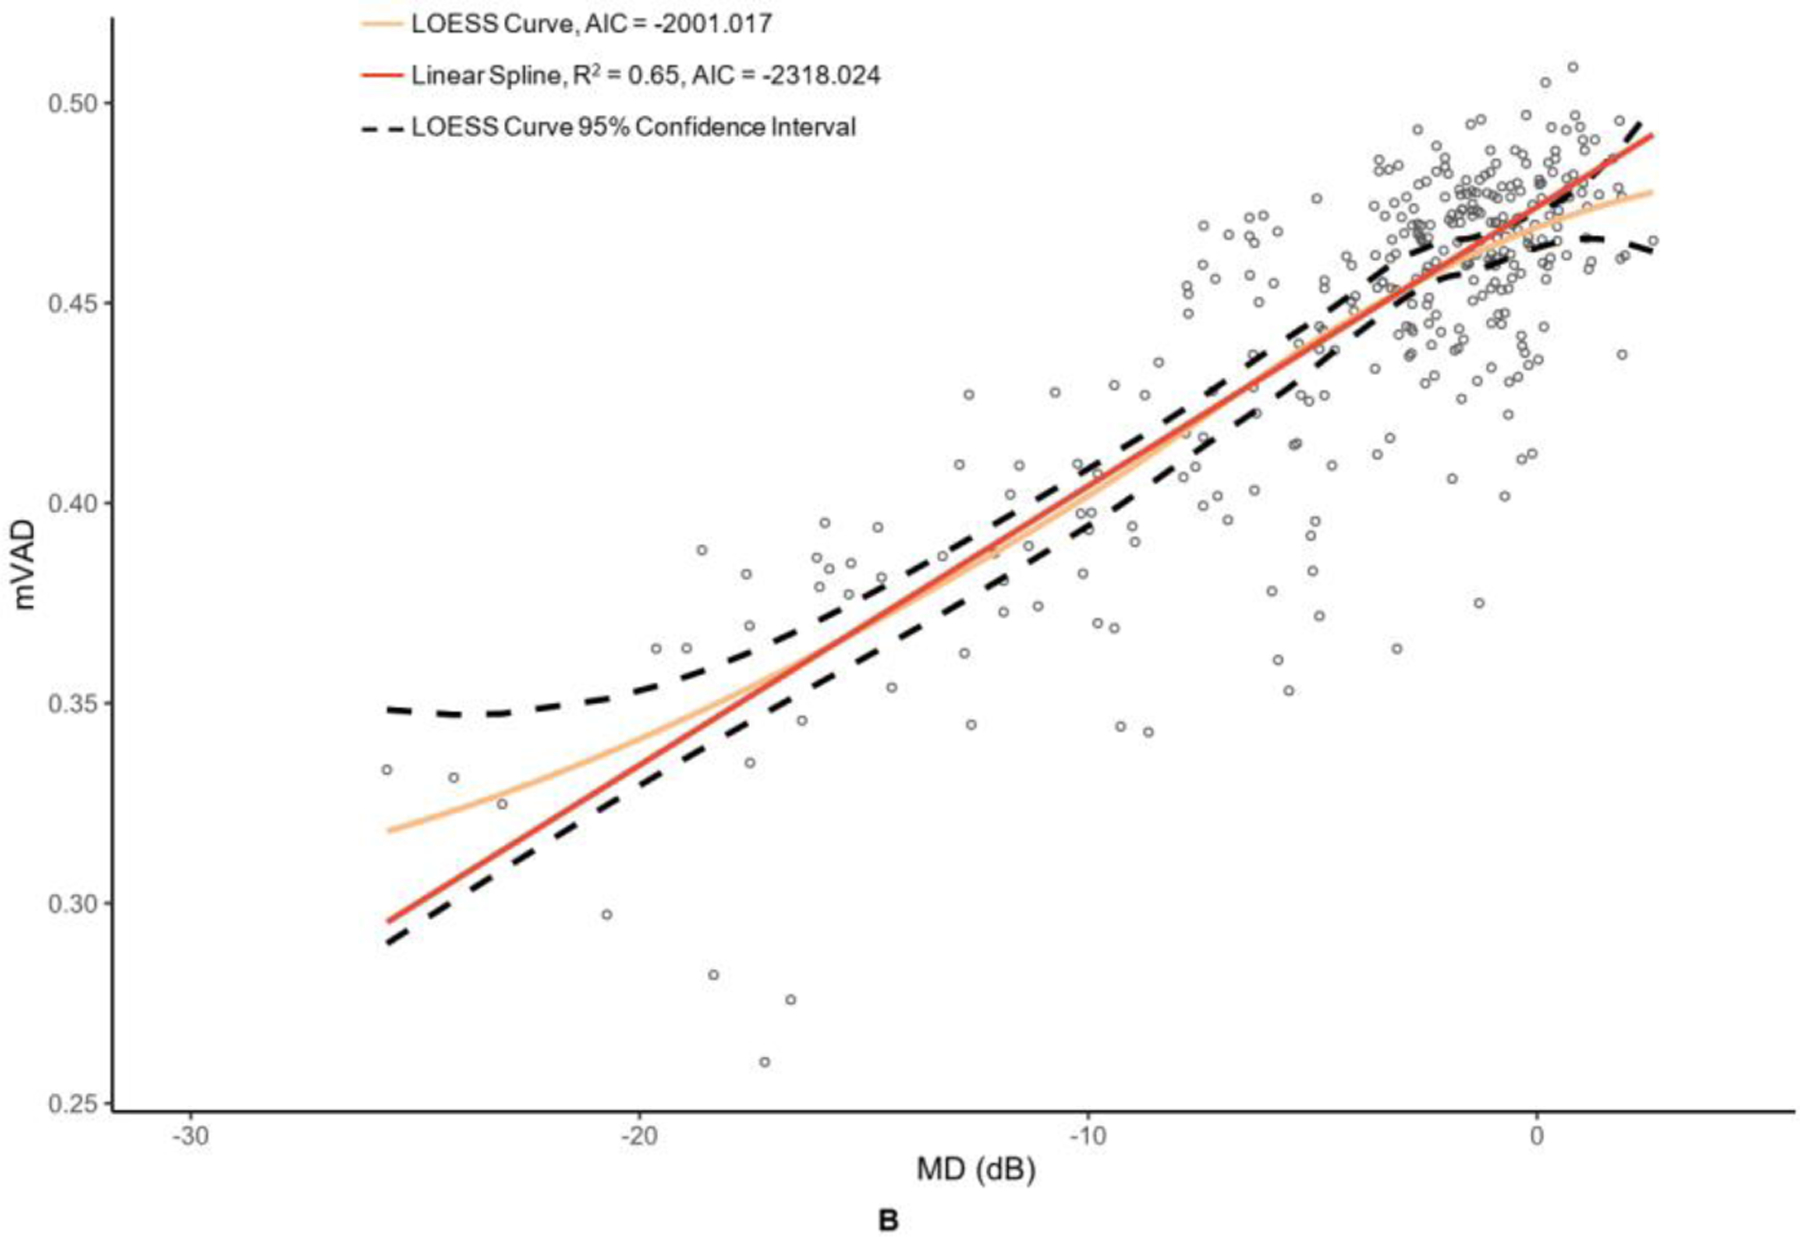
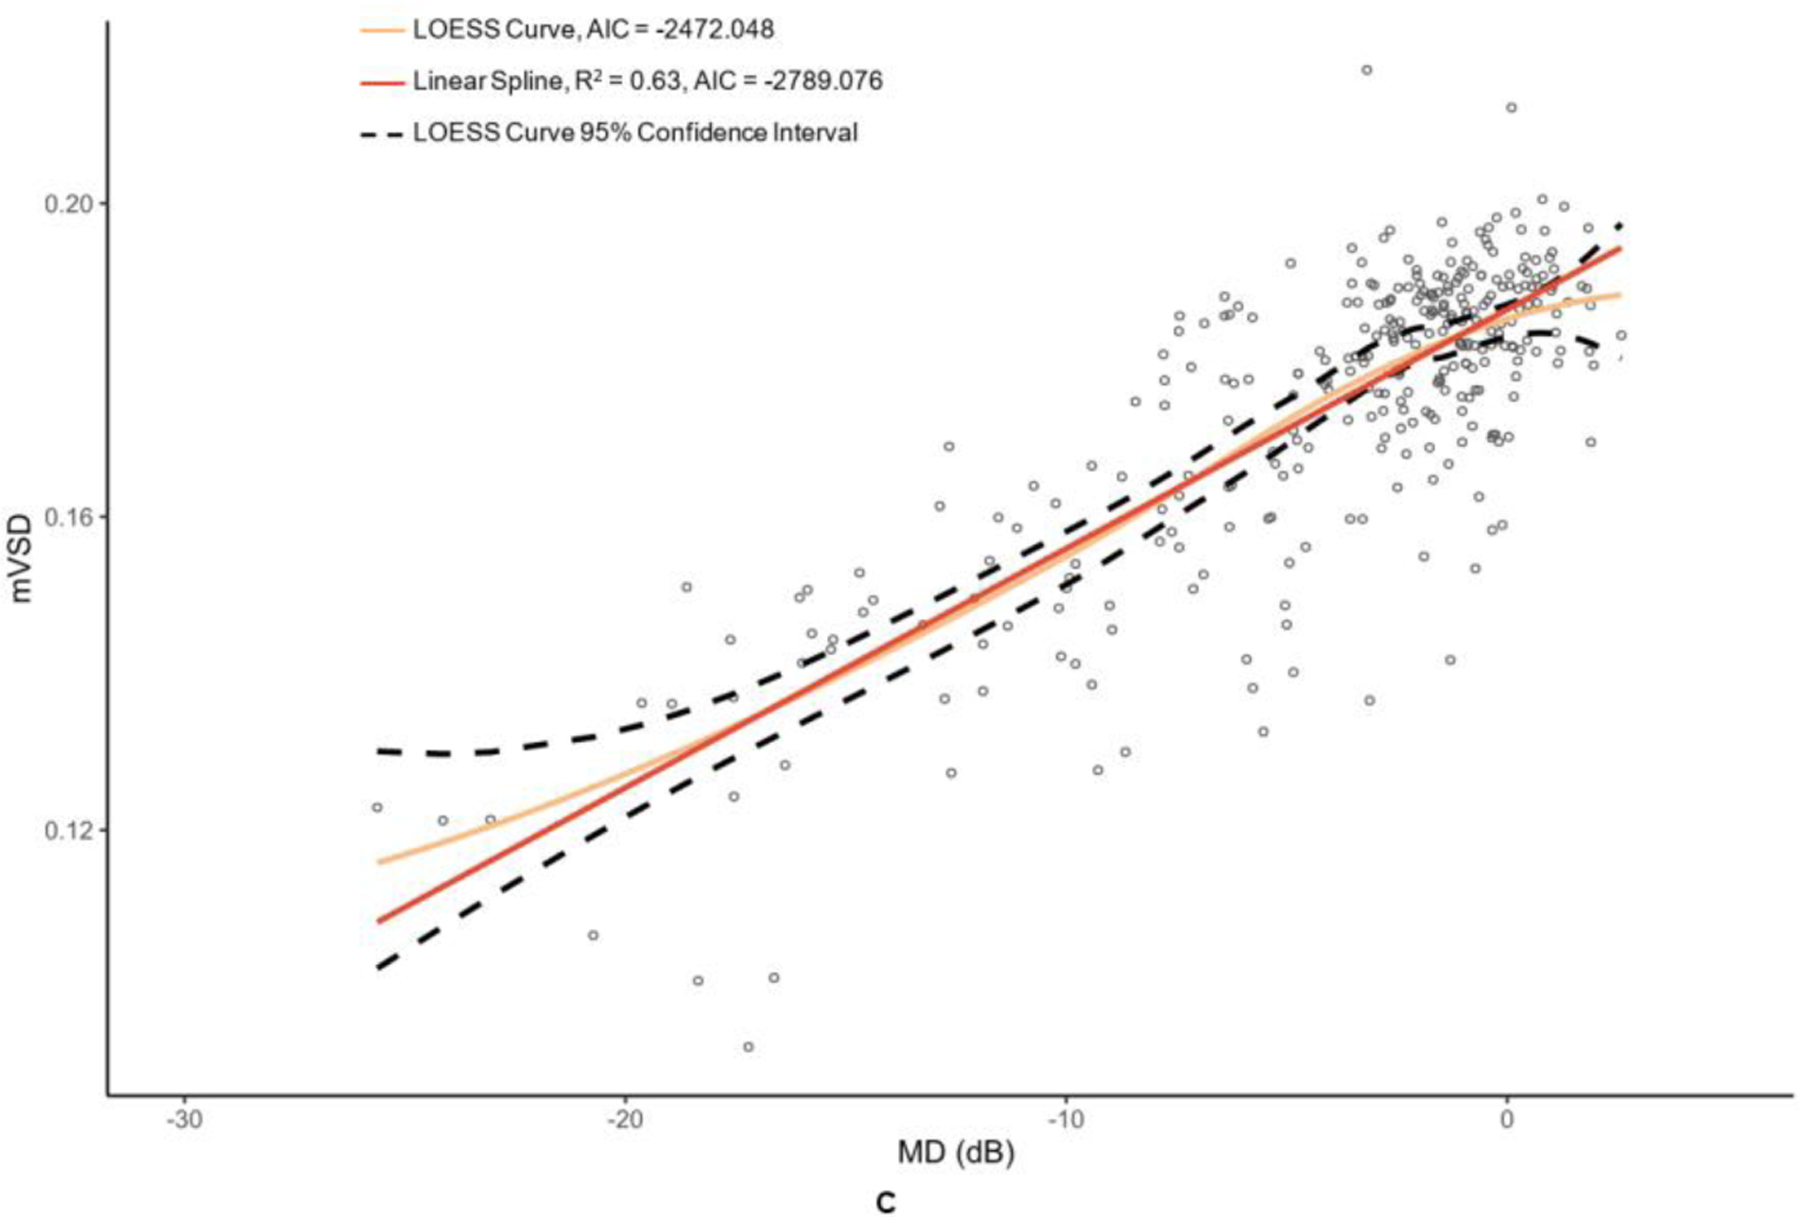
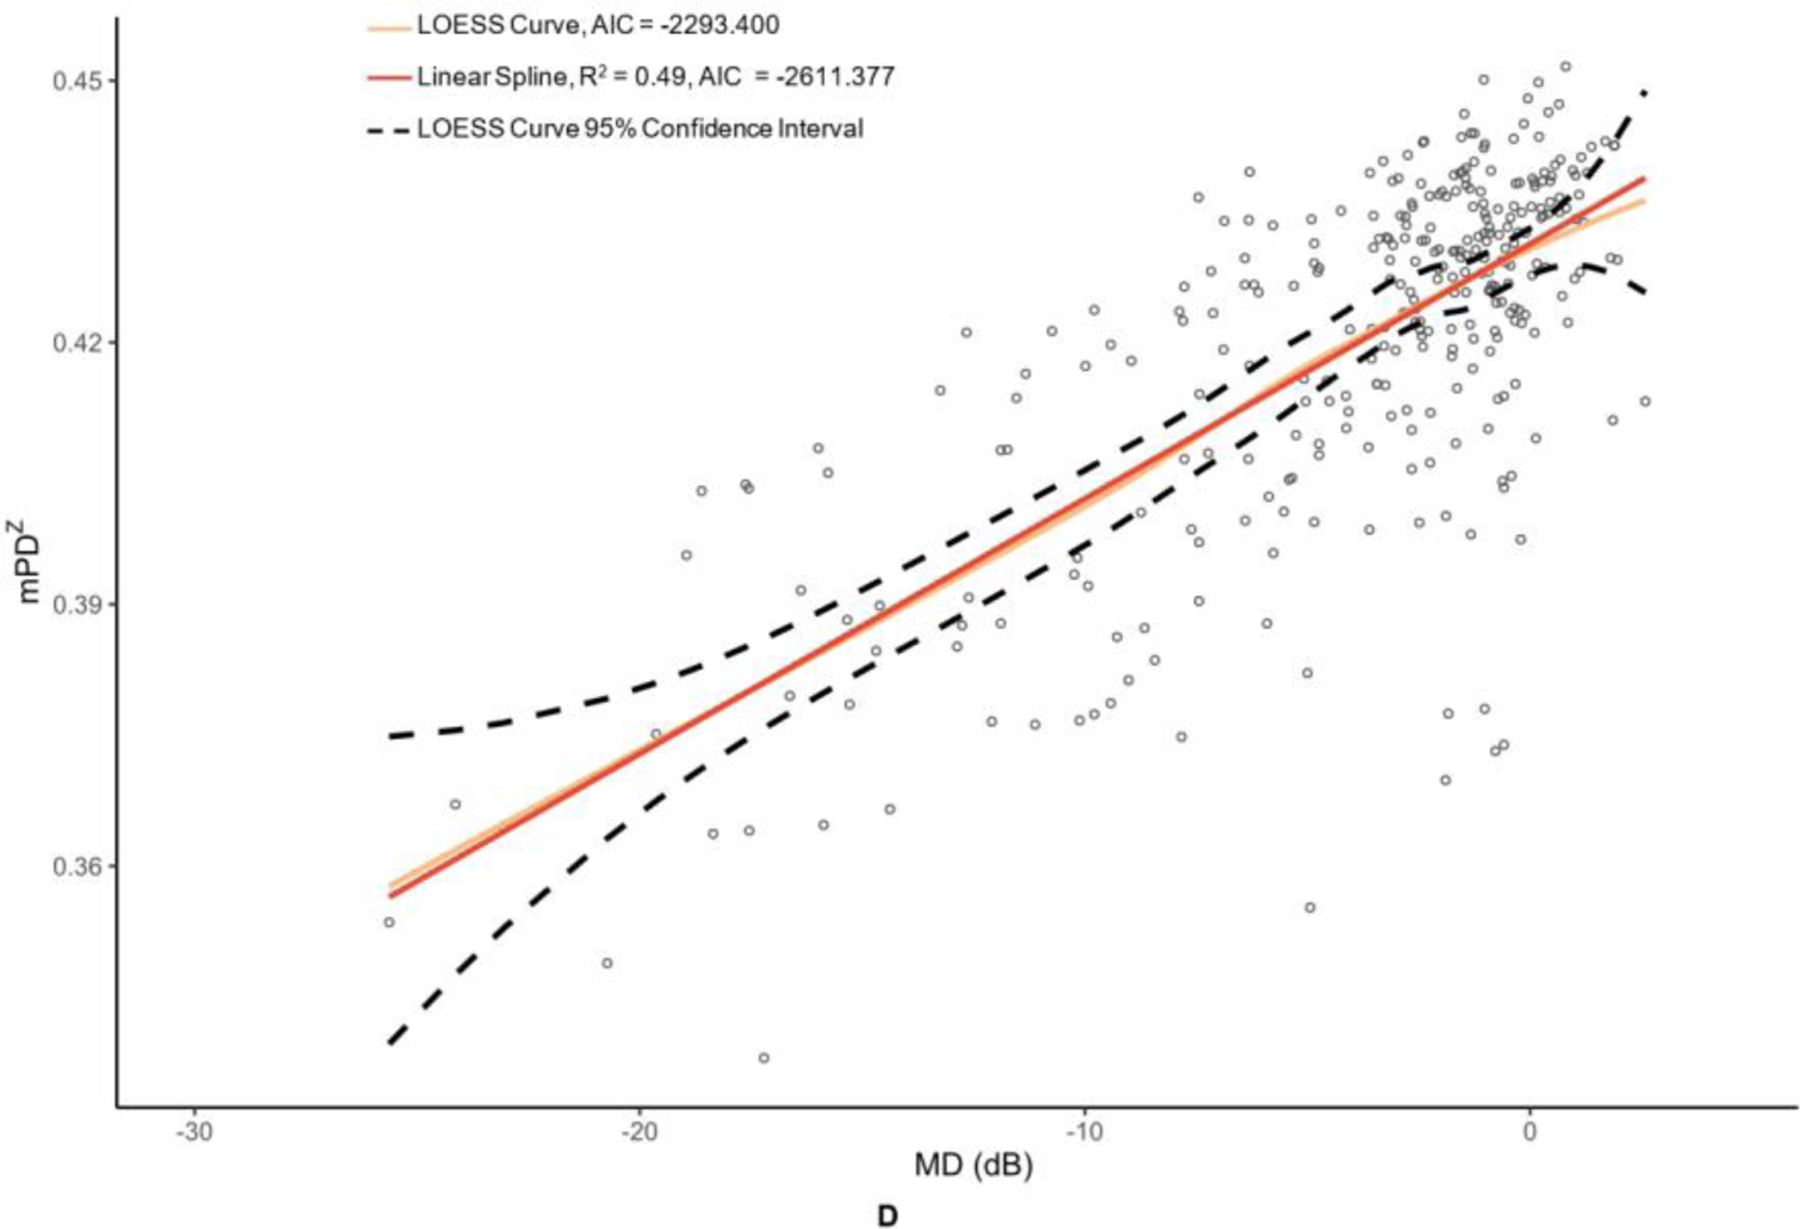
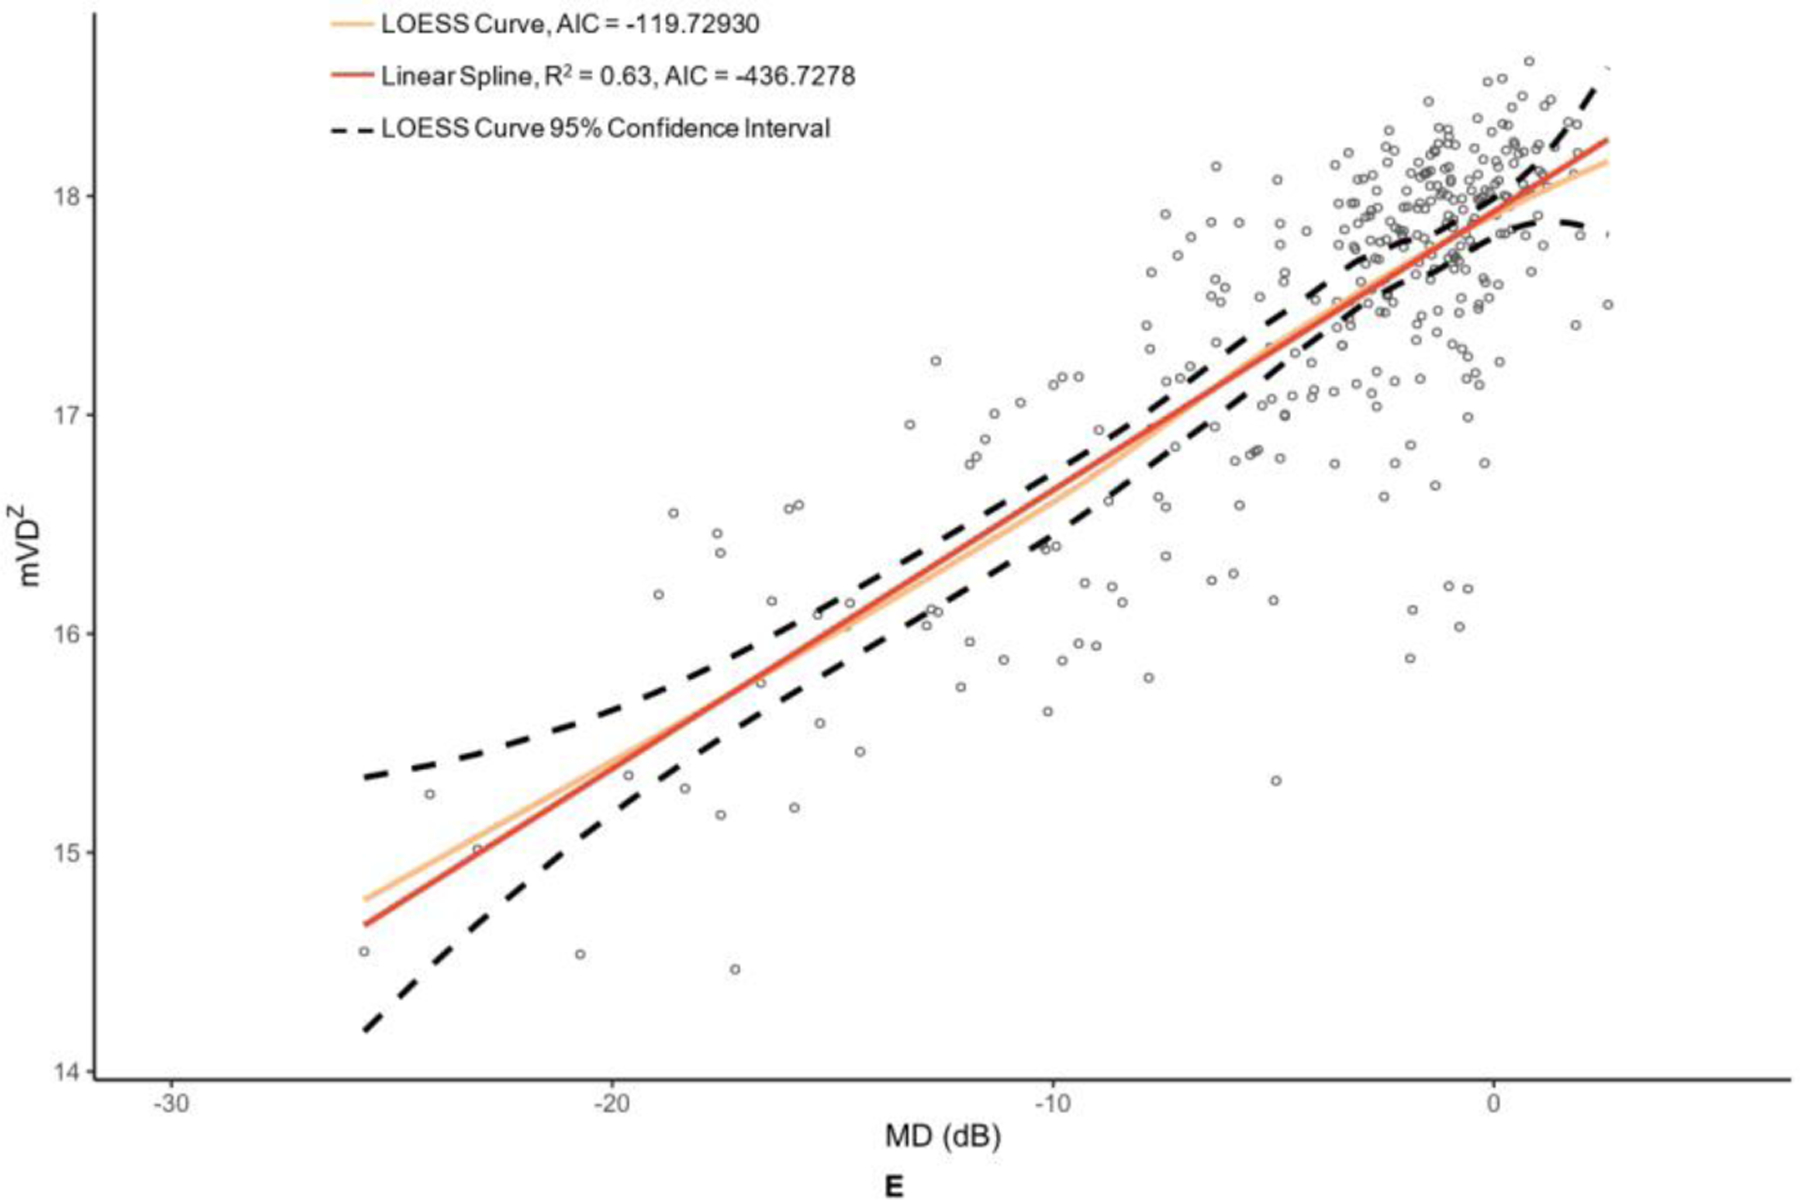
The metrics corresponding to this figure’s graphs are as follows: A = ganglion cell-inner plexiform layer (GCIPL) (µm), B = macular vessel area density (mVAD), C = macular vessel skeleton density (mVSD), D = macular perfusion density (mPDZ), and E = macular vessel density (mVDZ). dB = decibels. LOESS = local polynomial regression. AIC = Akaike’s information criterion. Vertical lines were added at change points to demarcate the point of transition between α + β (steep) and α (plateau) splines.
Table 2 provides the MD values at identified change points, as well as the slopes of the splines to the right of (β + α; steep, dynamic portion of graph) and to the left of (α; plateau portion of graph) these change points. Change points were discovered for both OCT metrics. However, the RNFL change point was statistically significant (p = 0.009), whereas the GCIPL change point was not (p = 0.332). While the RNFL α was significantly different than 0 (p = <0.001), it was less than half that of the upper spline slope β + α. With regard to the peripapillary metrics, the custom metric pVAD had a significant change point (p = 0.002) and true measurement floor (α not significantly different than 0, with p = 0.051), but the commercial metric pPDZ did not have a true measurement floor. Among macular OCTA metrics, none of the metrics had a significant change point and thus did not have true measurement floors.
Table 2.
Linear spline slopes of each OCT and OCTA metric before and after their respective change points.
| Slope (α) | P value | Slope (β + α) | P value | MD (dB) at Change Point | P value* | |
|---|---|---|---|---|---|---|
| OCT Metrics | ||||||
| RNFL, µm | 0.790 (0.538 to 1.04) | <0.001 | 1.72 (1.36 to 2.08) | <0.001 | −10.6 (−16.1 to −5.18) | 0.009 |
| GCIPL, µm | 0.764 (0.106 to 1.42) | 0.026 | 1.08 (0.924 to 1.23) | <0.001 | −17.6 (−27.9 to −7.34) | 0.332 |
| Peripapillary OCTA Metrics | ||||||
| Custom | ||||||
| pVAD | 0.282 (−0.001 to 0.566) | 0.051 | 0.900 (0.754 to 1.05) | <0.001 | −12.1 (−16.4 to −7.70) | 0.002 |
| Commercial | ||||||
| pPDZ | 0.265 (−0.113 to 0.643) | 0.142 | 0.422 (0.365 to 0.480) | <0.001 | −17.6 (−31.7 to −3.41) | 0.683 |
| Macular OCTA Metrics | ||||||
| Custom | ||||||
| mVAD | - | - | 0.698 (0.611 to 0.784) | <0.001 | - | - |
| mVSD | - | - | 0.316 (0.276 to 0.357) | <0.001 | - | - |
| Commercial | ||||||
| mPDZ | - | - | 0.292 (0.259 to 0.325) | <0.001 | - | - |
| mVDZ | - | - | 0.127 (0.117 to 0.138) | <0.001 | - | - |
based on corresponding Davies’ tests
Change-point analyses accounted for inter-eye correlation using linear mixed-effects modeling. α represents the slope of the spline to the left of the change point (i.e., plateau portion of the graph). β + α represents the slope of spline to the right of the change point (i.e., steep portion of the graph). OCTA slope values were multiplied by 100 to enhance readability. α, β + α, and MD at the change point are listed with their corresponding 95% confidence intervals.
MD = mean deviation, OCT = optical coherence tomography, RNFL = retinal nerve fiber layer, µm = micrometers, GCIPL = ganglion cell-inner plexiform layer, OCTA = optical coherence tomography angiography, pVAD = peripapillary vessel area density, pPDZ = peripapillary perfusion density, mVAD = macular vessel area density, mVSD = macular vessel skeleton density, mPDZ = macular perfusion density, mVDZ = macular vessel density
True or estimated measurement floors were reported alongside the mean MD values at these floors in Table 3. pVAD was the only metric to reach a true measurement floor. For the remaining OCT and OCTA metrics that did not reach true measurement floors, floors were estimated by averaging metric values of eyes with MD of −20 dB or worse, similar to the method for measurement-floor estimation used in Moghimi et al.13 The mean MD values of peripapillary OCT and OCTA metrics at their measurement floors fell between −17 dB and −18 dB with the exception of that of pPDZ, which produced a measurement floor MD of −26.6 dB. Macular OCT and OCTA measurement-floor MD values were consistently lower than that of the peripapillary measurement floor, falling between −21 and −25 dB.
Table 3.
Measurement Floors, Dynamic Ranges to Floors, and Steps Within the Dynamic Ranges for OCT and OCTA Metrics.
| Measurement Floor | Mean MD (dB) at Measurement Floor | Absolute Dynamic Range | Relative Dynamic Range (%) | Steps to the Measurement Floor | CRw | |
|---|---|---|---|---|---|---|
| OCT Metrics | ||||||
| RNFL, µm | 60.1 | −17.8 ± 0.927 | 28.1 | 31.8 | 7.20 | 3.90b |
| GCIPL, µm | 54.0a | −23.6 ± 1.14 | 23.5 | 30.4 | 7.33 | 3.21c |
| Peripapillary OCTA Metrics | ||||||
| Custom | ||||||
| pVAD | 0.211 | −17.6 ± 1.06 | 0.139 | 39.8 | 2.14 | 0.065d |
| Commercial | ||||||
| pPDZ | 0.322a | −26.6 ± 1.53 | 0.102 | 24.1 | 4.25 | 0.024d |
| Macular | ||||||
| OCTA Metrics | ||||||
| Custom | ||||||
| mVAD | 0.322a | −21.8 ± 1.03 | 0.151 | 31.9 | 3.87 | 0.039d |
| mVSD | 0.118a | −22.0 ± 1.03 | 0.069 | 36.7 | 3.81 | 0.018d |
| Commercial | ||||||
| mPDZ | 0.358a | −24.9 ± 1.03 | 0.068 | 15.9 | 1.26 | 0.054d |
| mVDZ | 14.8a | −24.2 ± 1.03 | 2.94 | 16.5 | 1.37 | 2.14d |
Measurement floors were estimated for these metrics using an arbitrary change-point MD of −20 dB per protocol delineated in text. Mean MD across measurement floors are reported with standard errors.
Derived from Mwanza et al. (2010)30.
Derived from pooled test-retest standard deviation data from Mwanza et al. (2011)31.
These CRw values were derived from repeatability data sets comprising non-glaucoma subjects at the USC Roski Eye Institute15.
MD = mean deviation, CRw = coefficient of repeatability, OCT = optical coherence tomography, RNFL = retinal nerve fiber layer, µm = micrometers, GCIPL = ganglion cell-inner plexiform layer, OCTA = optical coherence tomography angiography, pVAD = peripapillary vessel area density, pPDZ = peripapillary perfusion density, mVAD = macular vessel area density, mVSD = macular vessel skeleton density, mPDZ = macular perfusion density, mVDZ = macular vessel density.
Table 3 features absolute and relative dynamic range values for each OCT and OCTA metric. The RNFL and GCIPL relative dynamic ranges were comparable at 31.8% and 30.4%, respectively. The relative dynamic range of pVAD was larger than that of mVAD by 7.9%, and the relative dynamic range of pPDZ, the commercial counterpart of VAD, was larger than that of mPDZ by 8.2%. However, both pPDZ and mPDZ had relative dynamic ranges that were markedly smaller than those of pVAD and mVAD. Similarly, the relative range of mVDZ was less than half that of mVSD. Custom OCTA metrics had larger relative dynamic ranges than those of commercial OCTA metrics.
Table 3 displays the number of steps to measurement floor for each OCT and OCTA metric. Figure 4 offers a pictorial representation of the steps within the absolute dynamic ranges of the OCT metrics and the highest performing OCTA metrics. The highest numbers of steps to the measurement floor belonged to RNFL and GCIPL at 7.20 and 7.33, respectively. pPDZ, mVAD, and mVSD produced 4.25, 3.87, and 3.81 steps, respectively, to their measurement floors. pVAD, mPDZ, and mVDZ yielded between 1–3 steps to their measurement floors. Categorically related OCTA measurements yielded differing numbers of steps, with the commercial peripapillary metric pPDZ producing nearly double the steps of its corresponding custom metric pVAD, and both custom macular metrics mVAD and mVSD producing approximately four times the steps of their respective commercial metrics mPDZ and mVDZ.
Figure 4. Steps-to-floor plots of select OCT and OCTA metrics.
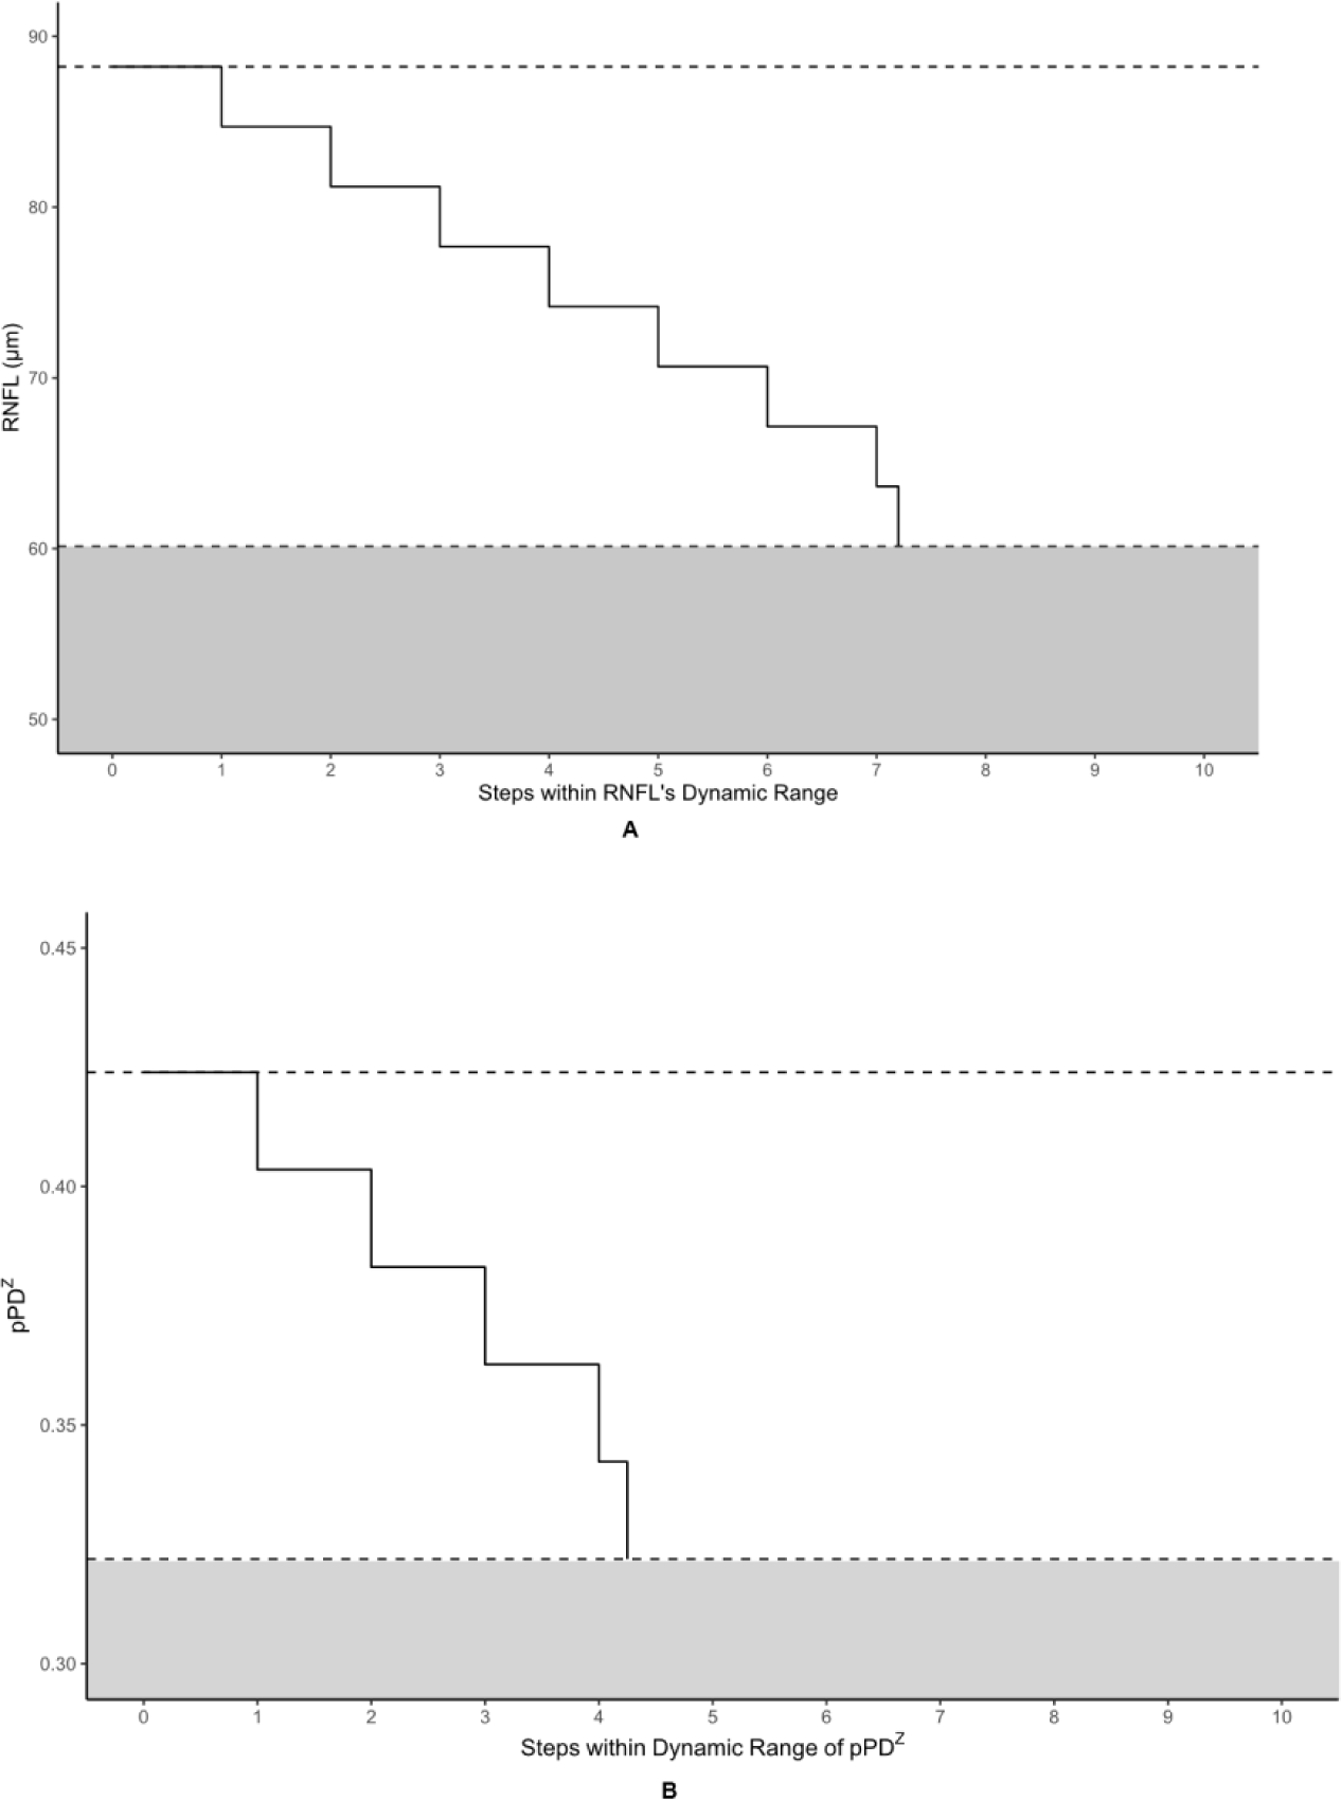
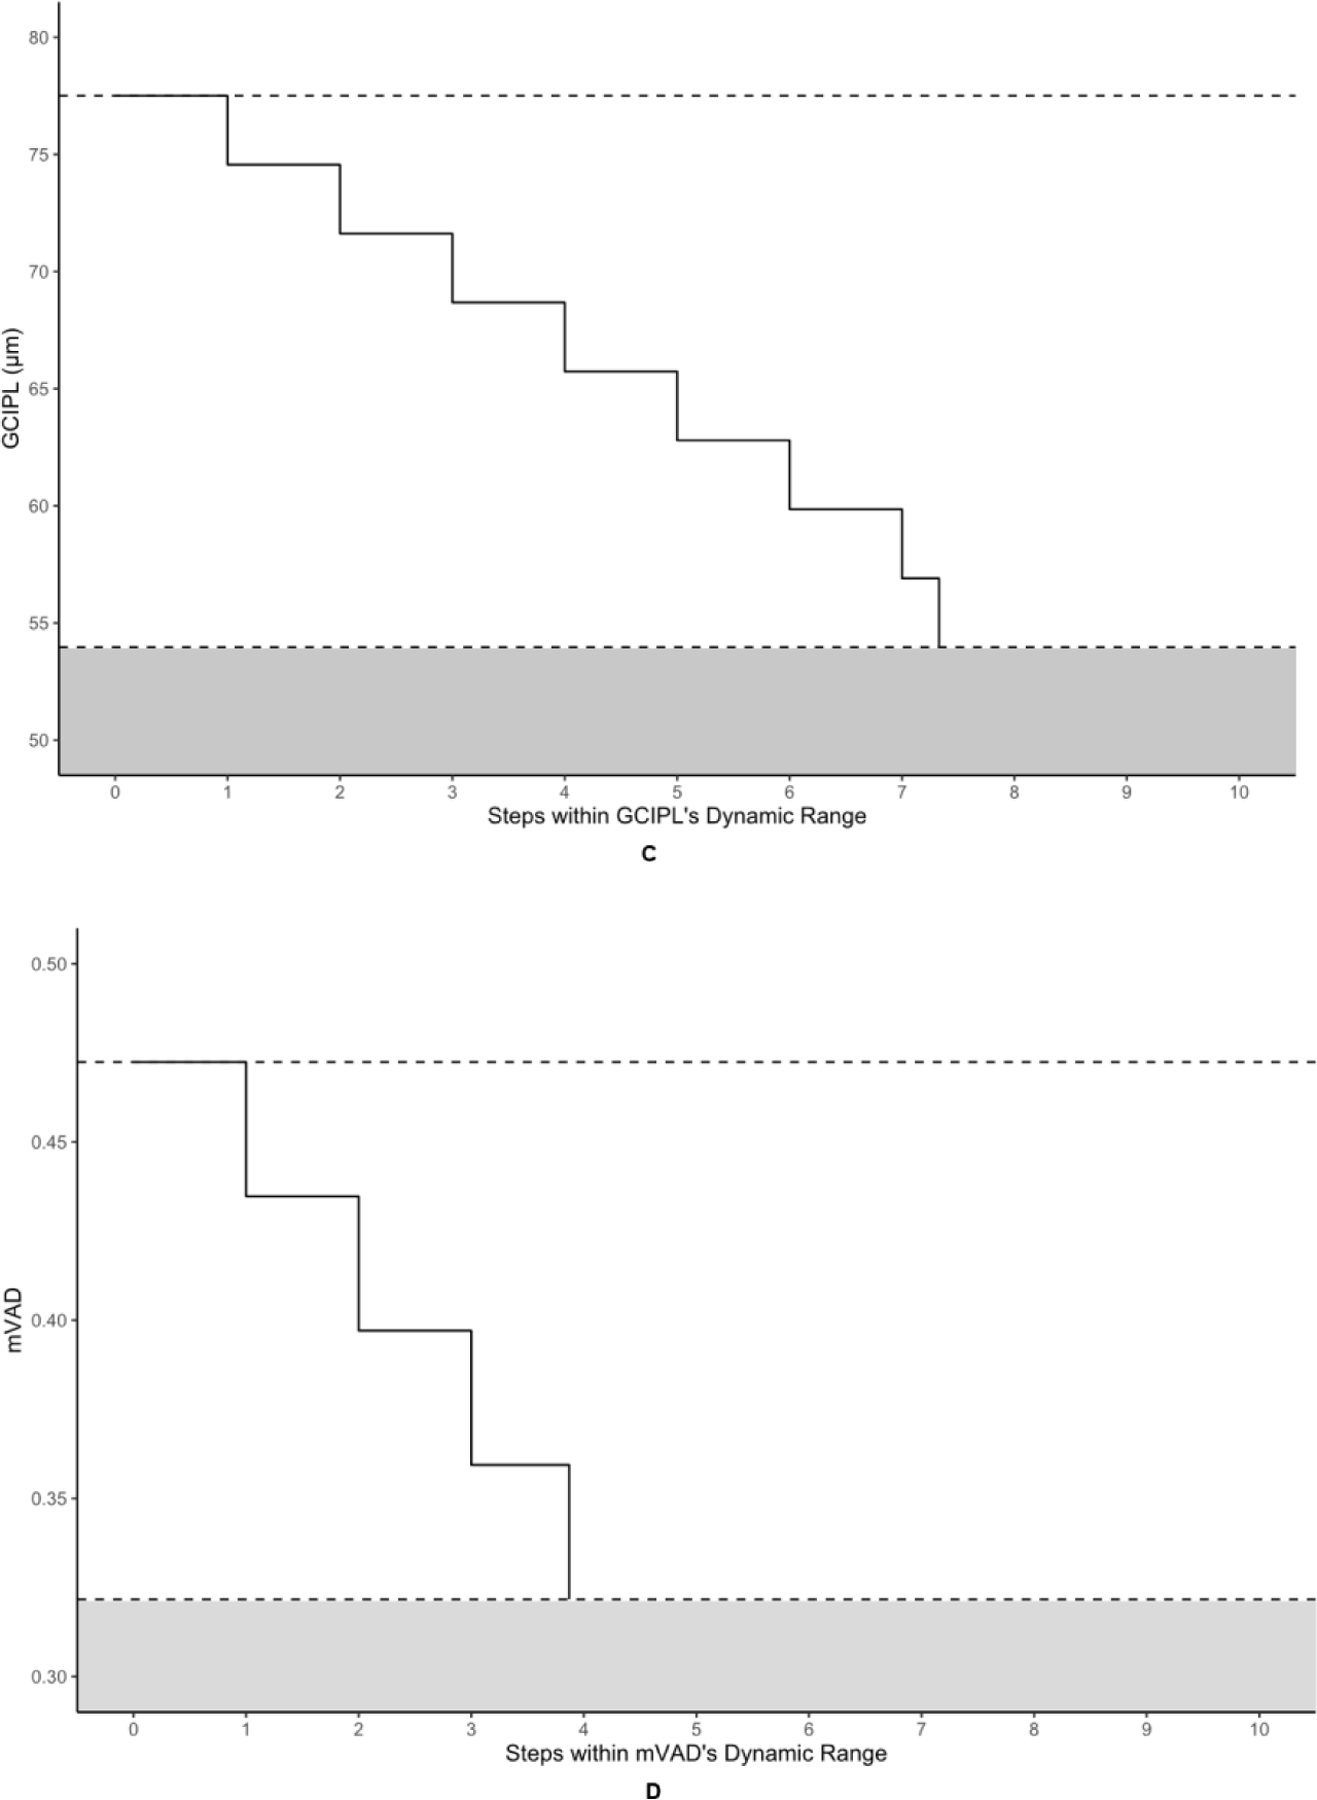
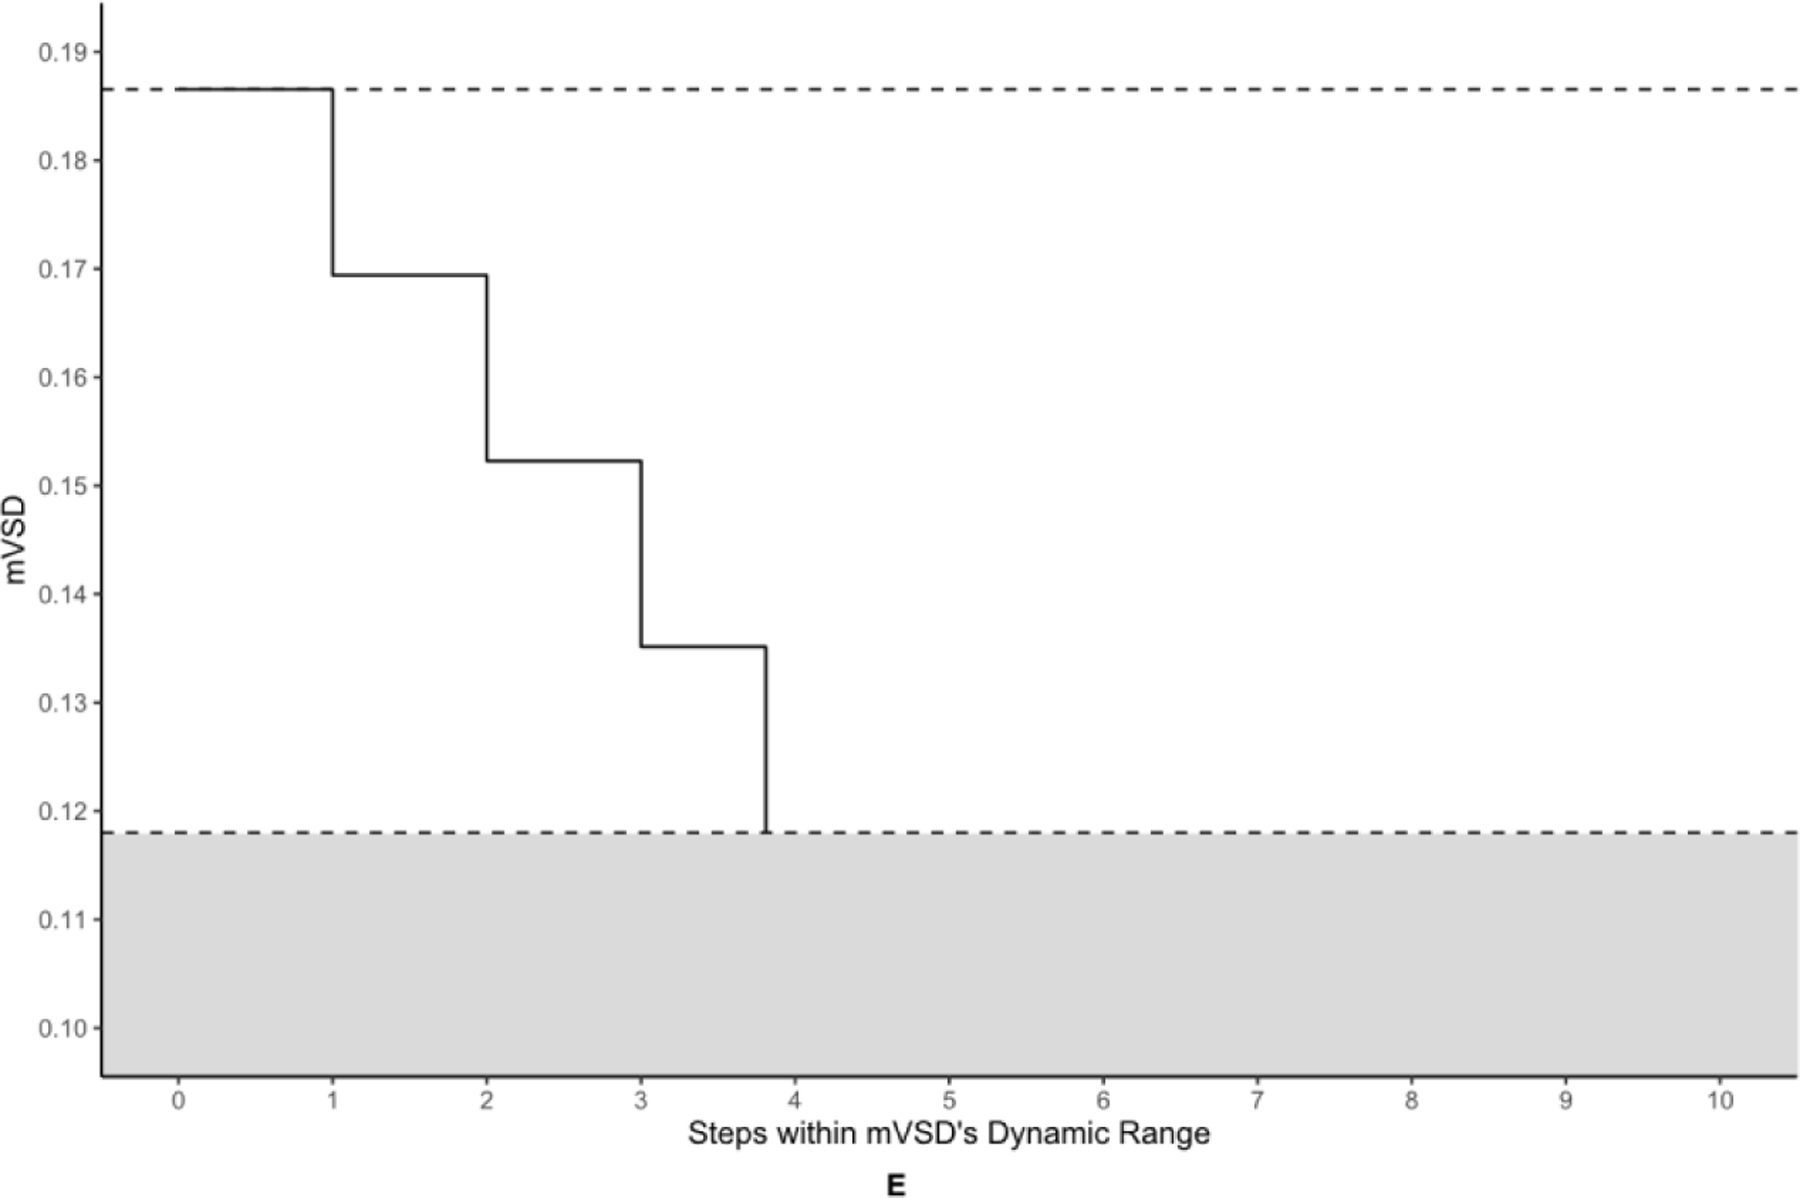
The metrics corresponding to this figure’s graphs are as follows: A = retinal nerve fiber layer (RNFL), B = peripapillary perfusion density (pPDZ), C = ganglion cell-inner plexiform layer (GCIPL) (µm), D = macular vessel area density (mVAD), E = macular vessel skeleton density (mVSD). The upper dotted lines represent the upper bounds of each metric’s dynamic range, as defined by the non-glaucomatous mean metric values, and the lower dotted lines represent each metric’s calculated measurement floor, or the lower bounds of each metric’s dynamic range. The shaded areas under each lower dotted line represents the residual signal for each metric below its respective measurement floor.
DISCUSSION
In this study, a spectral-domain OCTA device using an OMAGC angiographic modality was used to assess the dynamic range, measurement floors, and number of steps to those floors of a series of commercially developed and custom peripapillary and macular metrics for glaucomatous and non-glaucomatous eyes. The commercial peripapillary OCTA metric pPDZ and the custom macular OCTA metrics mVAD and mVSD yielded no measurement floor with approximately 4 steps within their dynamic ranges. Thus, these metrics may have utility in tracking disease progression in advanced glaucoma beyond the generally accepted measurement floor of RNFL described in prior studies.8,9 However, RNFL and GCIPL yielded the highest number of steps within their respective dynamic ranges among all metrics at 7.20 and 7.33, respectively. The disparity in number of steps between OCT and OCTA metrics suggests a need for improved test-retest reliability for OCTA.
The reason for pPDZ’s lack of change point and true measurement floor, in contrast to the custom peripapillary OCTA metric pVAD, is not entirely clear. It is possible that the commercially developed software that generates pPDZ utilizes additional data smoothing and noise reduction features,15 potentially improving the ability to distinguish microvasculature differences at more advanced stages of disease. In contrast, for the macular metrics, the custom metrics mVAD and mVSD seem to offer more clinical utility to their commercially developed counterparts mPDZ and mVDZ. While the custom metrics mVAD and mVSD had just under 4 steps within their respective dynamic ranges, the commercial macular OCTA metrics mPDZ and mVDZ yielded only 1.26 and 1.37 steps, respectively, reflecting their high test-retest variability. It is important to note that the number of steps for these metrics were based on internal data, and unfortunately, there are not comparable studies reporting test-retest variability results on the same macular OCTA metrics. The failure of each of the macular metrics to yield a measurement floor is congruent with the findings of macular vessel density in Moghimi et al.13 Additionally, mVAD’s and mVSD’s steps to its measurement floor of 3.87 and 3.81, respectively, were very similar to that in Moghimi et al. of 3.8.
Interestingly, RNFL did not reach a true measurement floor in the present study. However, our post-change-point RNFL slope was near zero and significantly different from its dynamic-range slope. Moreover, the RNFL range between its change point and the calculated measurement floor represents less than one step when taking into account this metric’s test-retest variability, suggesting that RNFL thinning occurring after the change point cannot be reliably measured. Taken together, we contend that RNFL reaches an effective measurement floor. This study demonstrated a measurement floor at an RNFL thickness of 60.1 µm (58.1–62.2 µm) and an MD of −17.8 dB ±0.927. These RNFL change point results are similar to those that Mwanza et al. found on the same HD-OCT device, which were 57.1 µm (55.2–59.1 µm) and −20 dB ±7.0, respectively.8 There was, however, a slight discrepancy between the present study’s number of steps to the floor within RNFL’s absolute dynamic range compared to that of Mwanza et al., with the former yielding 7.20 steps and the latter yielding 9.0 steps. The same RNFL CRw value that Mwanza et al. used was employed for the present project, eliminating this as a potential confounding factor. One possible explanation of this discrepancy is the difference in dynamic ranges between our study and that of Mwanza et al., created by the delta of 5.7 µm between each study’s mean non-glaucomatous RNFL value. This translates into a difference of 1.46 steps to the RNFL measurement floor, accounting for most of the discrepancy in steps calculated for the present study and that of Mwanza and his research team. The difference between the present study’s non-glaucomatous RNFL value and that of Mwanza et al. is likely attributed to the inclusion of glaucoma suspect eyes in the former, whereas the latter only included healthy eyes, free of glaucoma suspects and comorbid retinal disease, among its age-matched controls.
No measurement floor was found for GCIPL. That we found no statistically significant change point for GCIPL is at odds with Moghimi et al., in which a statistically significant change point was discovered for ganglion cell complex (GCC).13 While Moghimi et al.’s study is comparable to ours, a key difference in study design is that it used the Spectralis SD-OCT device (Spectralis HRA+OCT, software version 5.4.7.0; Heidelberg Engineering, Inc, Heidelberg, Germany) to generate GCC values13 that encompass ganglion cell, inner plexiform, and macular RNFL thickness, whereas we used the Cirrus HD-OCT device, which only measures ganglion cell and inner plexiform thickness in its GCIPL measurement. Because of this discrepancy between macular OCT metrics and devices used to generate them, it is difficult to compare these two sets of macular OCT results directly.
Other investigations of the macular thickness measurement floors are few and have primarily been based on the functional measures from HVF 10–2 studies.31–34 The benefit of using 10–2 VF studies in lieu of 24–2 VF studies when examining the macula is that the former interrogates this part of the retina using 68 points spaced 2 degrees apart, whereas the latter does so with only 16 points that are spaced 6 degrees apart.35 This increased granularity can be informative when considering that the majority of ganglion cell loss within the macula occurs within 2–3 degrees of fixation, which is not sampled in the 24–2.36 Given the distribution of ganglion cells in the macula, the consistency of macular thickness measurement floors using 10–2 VF studies, and that a GCIPL thickness measurement nadir had to be estimated using 24–2 HVF MD values, further study of this OCT metric would benefit from use of 10–2 VF studies. Similarly, macular OCTA metrics would also benefit from future study of 10–2 VF protocols in order to ascertain whether they experience floor effects after functionally evaluating the macula in greater detail.
There are limitations to the present study that may affect the applicability of its findings in other contexts. There was relative paucity of OCT and OCTA images available at MD values less than −20 dB in this study’s dataset, which may have limited the detection of measurement floors that exist in advanced glaucoma. Despite this, our comparison of the AIC values of the linear spline models to that of the LOESS curves demonstrated that the spline models were in fact the best fit of the data (Figure 2, 3). Moghimi et al. experienced a similar issue with decreased power below MD values of −20 dB.13 Contributing to the relatively modest number of eyes at this level of visual field sensitivity loss in our project is the practice in glaucoma care of switching patients with advanced glaucoma to 10–2 VF studies when 24–2 VF studies become less clinically useful, limiting the number of advanced patients with 24–2 VF studies. There is a scant number of studies on this topic, and no comparable studies in adults, making CRw comparison difficult. Additionally, OCTA image quality is highly dependent upon the maintenance of fixation, which is particularly difficult for patients with advanced glaucoma, limiting the number of eyes at MD values below −20 dB in our glaucoma cohort further. Furthermore, as discussed above, inclusion of only 24–2 VF studies may have limited the evaluation of macular metrics. Finally, the numbers of steps to measurement floors are dependent upon their respective CRw values, which are, in turn, contingent upon their underlying repeatability data. This point emphasizes the importance of continued study of OCTA repeatability if steps to measurement floor are to have clinical applicability.
In conclusion, the present study demonstrated that the commercially developed peripapillary metric pPDZ and the custom macular metrics mVAD and mVSD may be useful adjuncts to OCT structural measurements in tracking progression in advanced glaucoma, insofar as they did not yield measurement floors and reasonable numbers of steps in their absolute dynamic range. As mentioned above, the macular metrics would benefit from future study using visual field data focused on the central 10 degrees. Finally, OCTA metrics do not currently have as many measurable steps as OCT metrics, and improvements in test-retest repeatability of this technology could greatly improve its clinical utility in the future.
Highlights.
Several OCTA metrics had 4 steps without detectable measurement floors
OCTA could supplement current glaucoma management, especially for advanced disease
Refining OCTA repeatability could further improve its clinical utility
ACKNOWLEDGMENTS
a) Funding/Support: This study was supported by the National Institutes of Health (Grant 5K23EY027855–03, G.M.R; Grant R01EY028753, R.K.W; Grant K23 EY029763, B.Y.X), the National Institute on Aging (Grant T32AG000037, G.M.R), and an unrestricted departmental grant to USC Roski Eye Institute from Research to Prevent Blindness. The sponsor or funding organization had no role in the design or conduct of this research.
b) Financial Disclosures: R.K.W. is a consultant of Carl Zeiss Meditec Inc. and holds a patent on the spectral domain optical coherence tomography angiography device from Carl Zeiss Meditec Inc. (Dublin, CA). G.M.R. has access to an optical coherence tomography angiography research device provided by Carl Zeiss Meditec Inc. The remaining authors declare no conflict of interest.
c) Other: The authors wish to thank Dr. Sasan Moghimi for his generous discussions clarifying the methodology of his similar work, which greatly informed our own methodology.
Footnotes
Publisher's Disclaimer: This is a PDF file of an unedited manuscript that has been accepted for publication. As a service to our customers we are providing this early version of the manuscript. The manuscript will undergo copyediting, typesetting, and review of the resulting proof before it is published in its final form. Please note that during the production process errors may be discovered which could affect the content, and all legal disclaimers that apply to the journal pertain.
REFERENCES
- 1.Tham Y-C, Li X, Wong TY, Quigley HA, Aung T, Cheng C-Y. Global prevalence of glaucoma and projections of glaucoma burden through 2040: a systematic review and meta-analysis. Ophthalmology 2014;121(11):2081–2090. doi: 10.1016/j.ophtha.2014.05.013 [DOI] [PubMed] [Google Scholar]
- 2.Richter GM, Sylvester B, Chu Z, et al. Peripapillary microvasculature in the retinal nerve fiber layer in glaucoma by optical coherence tomography angiography: focal structural and functional correlations and diagnostic performance. Clin Ophthalmol 2018;12:2285–2296. doi: 10.2147/OPTH.S179816 [DOI] [PMC free article] [PubMed] [Google Scholar]
- 3.Shin JW, Kwon J, Lee J, Kook MS. Relationship between vessel density and visual field sensitivity in glaucomatous eyes with high myopia. British Journal of Ophthalmology 2019;103(5):585–591. doi: 10.1136/bjophthalmol-2018-312085 [DOI] [PubMed] [Google Scholar]
- 4.Mangouritsas G, Koutropoulou N, Ragkousis A, Boutouri E, Diagourtas A. Peripapillary Vessel Density In Unilateral Preperimetric Glaucoma. Clin Ophthalmol 2019;13:2511–2519. doi: 10.2147/OPTH.S224757 [DOI] [PMC free article] [PubMed] [Google Scholar]
- 5.Weinreb RN, Aung T, Medeiros FA. The Pathophysiology and Treatment of Glaucoma. JAMA 2014;311(18):1901–1911. doi: 10.1001/jama.2014.3192 [DOI] [PMC free article] [PubMed] [Google Scholar]
- 6.Dong ZM, Wollstein G, Schuman JS. Clinical Utility of Optical Coherence Tomography in Glaucoma. Invest Ophthalmol Vis Sci 2016;57(9):OCT556–OCT567. doi: 10.1167/iovs.16-19933 [DOI] [PMC free article] [PubMed] [Google Scholar]
- 7.Ueda K, Kanamori A, Akashi A, Kawaka Y, Yamada Y, Nakamura M. Difference in correspondence between visual field defect and inner macular layer thickness measured using three types of spectral-domain OCT instruments. Jpn J Ophthalmol 2015;59(1):55–64. doi: 10.1007/s10384-014-0355-z [DOI] [PubMed] [Google Scholar]
- 8.Mwanza J-C, Kim HY, Budenz DL, et al. Residual and Dynamic Range of Retinal Nerve Fiber Layer Thickness in Glaucoma: Comparison of Three OCT Platforms. Invest Ophthalmol Vis Sci 2015;56(11):6344–6351. doi: 10.1167/iovs.15-17248 [DOI] [PMC free article] [PubMed] [Google Scholar]
- 9.Mwanza J-C, Budenz DL, Warren JL, et al. Retinal nerve fibre layer thickness floor and corresponding functional loss in glaucoma. Br J Ophthalmol 2015;99(6):732–737. doi: 10.1136/bjophthalmol-2014-305745 [DOI] [PMC free article] [PubMed] [Google Scholar]
- 10.Kashani AH, Chen C-L, Gahm JK, et al. Optical coherence tomography angiography: A comprehensive review of current methods and clinical applications. Prog Retin Eye Res 2017;60:66–100. doi: 10.1016/j.preteyeres.2017.07.002 [DOI] [PMC free article] [PubMed] [Google Scholar]
- 11.Kimikazu S, Higashide T, Udagawa S, et al. Comparison of Sectoral Structure-Function Relationships in Glaucoma: Vessel Density Versus Thickness in the Peripapillary Retinal Nerve Fiber Layer. Invest. Ophthalmol. Vis. Sci 2017;58(12):5251–5262. doi: 10.1167/iovs.17-21955. [DOI] [PubMed] [Google Scholar]
- 12.Kim G-N, Lee EJ, Kim H, Kim T-W. Dynamic Range of the Peripapillary Retinal Vessel Density for Detecting Glaucomatous Visual Field Damage. Ophthalmology Glaucoma 2019;2(2):103–110. doi: 10.1016/j.ogla.2018.11.007 [DOI] [PubMed] [Google Scholar]
- 13.Moghimi S, Bowd C, Zangwill LM, et al. Measurement Floors and Dynamic Ranges of OCT and OCT Angiography in Glaucoma. Ophthalmology 2019;126(7):980–988. doi: 10.1016/j.ophtha.2019.03.003 [DOI] [PMC free article] [PubMed] [Google Scholar]
- 14.Venugopal JP, Rao HL, Weinreb RN, et al. Repeatability of vessel density measurements of optical coherence tomography angiography in normal and glaucoma eyes. British Journal of Ophthalmology 2018;102(3):352–357. doi: 10.1136/bjophthalmol-2017-310637 [DOI] [PubMed] [Google Scholar]
- 15.Lee JC, Grisafe DJ, Burkemper B, et al. Intrasession repeatability and intersession reproducibility of peripapillary OCTA vessel parameters in non-glaucomatous and glaucomatous eyes [published online ahead of print, 2020 Sep 11]. Br J Ophthalmol 2020;bjophthalmol-2020–317181. doi: 10.1136/bjophthalmol-2020-317181 [DOI] [PMC free article] [PubMed] [Google Scholar]
- 16.Zhang A, Zhang Q, Chen CL, Wang RK. Methods and algorithms for optical coherence tomography-based angiography: a review and comparison. J Biomed Opt 2015;20(10):100901. doi: 10.1117/1.JBO.20.10.100901 [DOI] [PMC free article] [PubMed] [Google Scholar]
- 17.Rosenfeld PJ, Durbin MK, Roisman L, et al. ZEISS Angioplex™ Spectral Domain Optical Coherence Tomography Angiography: Technical Aspects. Dev Ophthalmol 2016;56:18–29. doi: 10.1159/000442773 [DOI] [PubMed] [Google Scholar]
- 18.Chu Z, Lin J, Gao C, et al. Quantitative assessment of the retinal microvasculature using optical coherence tomography angiography. JBO 2016;21(6):066008. doi: 10.1117/1.JBO.21.6.066008 [DOI] [PMC free article] [PubMed] [Google Scholar]
- 19.Munk MR, Giannakaki-Zimmermann H, Berger L, et al. OCT-angiography: A qualitative and quantitative comparison of 4 OCT-A devices. PLOS ONE 2017;12(5):e0177059. doi: 10.1371/journal.pone.0177059 [DOI] [PMC free article] [PubMed] [Google Scholar]
- 20.R Core Team. R: A Language and Environment for Statistical Computing R Foundation for Statistical Computing, Vienna, Austria.; 2019. https://www.R-project.org/ [Google Scholar]
- 21.Bates D, Mächler M, Bolker B, Walker S. Fitting Linear Mixed-Effects Models Using lme4. Journal of Statistical Software 2015;67(1):1–48. doi: 10.18637/jss.v067.i01 [DOI] [Google Scholar]
- 22.Muggeo VMR. Interval estimation for the breakpoint in segmented regression: a smoothed score-based approach. Australian & New Zealand Journal of Statistics 2017;59(3):311–322. doi: 10.1111/anzs.12200 [DOI] [Google Scholar]
- 23.Wollstein G, Kagemann L, Bilonick RA, et al. Retinal nerve fibre layer and visual function loss in glaucoma: the tipping point. British Journal of Ophthalmology 2012;96(1):47–52. doi: 10.1136/bjo.2010.196907 [DOI] [PMC free article] [PubMed] [Google Scholar]
- 24.Perperoglou A, Sauerbrei W, Abrahamowicz M, Schmid M. A review of spline function procedures in R. BMC Med Res Methodol 2019;19(1):1–16. doi: 10.1186/s12874-019-0666-3 [DOI] [PMC free article] [PubMed] [Google Scholar]
- 25.Vaz S, Falkmer T, Passmore AE, Parsons R, Andreou P. The Case for Using the Repeatability Coefficient When Calculating Test–Retest Reliability. PLOS ONE 2013;8(9):e73990. doi: 10.1371/journal.pone.0073990 [DOI] [PMC free article] [PubMed] [Google Scholar]
- 26.Mwanza JC, Chang RT, Budenz DL, et al. Reproducibility of peripapillary retinal nerve fiber layer thickness and optic nerve head parameters measured with cirrus HD-OCT in glaucomatous eyes. Invest Ophthalmol Vis Sci 2010; 51: 5724–5730 [DOI] [PMC free article] [PubMed] [Google Scholar]
- 27.Mwanza J-C, Oakley JD, Budenz DL, Chang RT, Knight OJ, Feuer WJ. Macular Ganglion Cell–Inner Plexiform Layer: Automated Detection and Thickness Reproducibility with Spectral Domain–Optical Coherence Tomography in Glaucoma. Invest Ophthalmol Vis Sci 2011;52(11):8323–8329. doi: 10.1167/iovs.11-7962 [DOI] [PMC free article] [PubMed] [Google Scholar]
- 28.Wickham H. Ggplot2: Elegant Graphics for Data Analysis Springer-Verlag; 2009. doi: 10.1007/978-0-387-98141-3 [DOI] [Google Scholar]
- 29.Cleveland WS, Grosse E, Shyu WM. Local Regression Models. In: Statistical Models in Chambers SJM and Hastie T Edition. Chapman & Hall/CRC; 1992:309–376. [Google Scholar]
- 30.Correa-Metrio A, Urrego DH, Cabrera KR, Bush MB. PaleoMAS: Paleoecological Analysis; 2012. Accessed September 8, 2020. https://CRAN.R-project.org/package=paleoMAS
- 31.Miraftabi A, Amini N, Morales E, et al. Macular SD-OCT Outcome Measures: Comparison of Local Structure-Function Relationships and Dynamic Range. Invest Ophthalmol Vis Sci 2016;57(11):4815–4823. doi: 10.1167/iovs.16-19648 [DOI] [PMC free article] [PubMed] [Google Scholar]
- 32.Rao HL, Qasim M, Hussain RSM, et al. Structure–Function Relationship in Glaucoma Using Ganglion Cell–Inner Plexiform Layer Thickness Measurements. Invest Ophthalmol Vis Sci 2015;56(6):3883–3888. doi: 10.1167/iovs.15-16943 [DOI] [PubMed] [Google Scholar]
- 33.Raza AS, Cho J, Moraes CGV de, et al. Retinal Ganglion Cell Layer Thickness and Local Visual Field Sensitivity in Glaucoma. Arch Ophthalmol 2011;129(12):1529–1536. doi: 10.1001/archophthalmol.2011.352 [DOI] [PMC free article] [PubMed] [Google Scholar]
- 34.Ohkubo S, Higashide T, Udagawa S, et al. Focal Relationship Between Structure and Function Within the Central 10 Degrees in Glaucoma. Invest Ophthalmol Vis Sci 2014;55(8):5269–5277. doi: 10.1167/iovs.14-14153 [DOI] [PubMed] [Google Scholar]
- 35.Rao HL, Januwada M, Hussain RSM, et al. Comparing the Structure–Function Relationship at the Macula With Standard Automated Perimetry and Microperimetry. Invest Ophthalmol Vis Sci 2015;56(13):8063–8068. doi: 10.1167/iovs.15-17922 [DOI] [PubMed] [Google Scholar]
- 36.Hood DC, Raza AS, de Moraes CGV, Liebmann JM, Ritch R. Glaucomatous damage of the macula. Progress in Retinal and Eye Research 2013;32:1–21. doi: 10.1016/j.preteyeres.2012.08.003 [DOI] [PMC free article] [PubMed] [Google Scholar]
- 37.Takayama K, Hangai M, Durbin M, et al. A Novel Method to Detect Local Ganglion Cell Loss in Early Glaucoma Using Spectral-Domain Optical Coherence Tomography. Invest Ophthalmol Vis Sci 2012;53(11):6904–6913. doi: 10.1167/iovs.12-10210 [DOI] [PubMed] [Google Scholar]


