

Abstract
Background and Purpose:
Intravenous thrombolysis (IVT) after ischemic stroke is underutilized in racially/ethnically minoritized groups. We aimed to determine the regional and geographic variability in racial/ethnic IVT disparities in the U.S.
Methods:
Acute ischemic stroke admissions between 2012 and 2018 were identified in the National Inpatient Sample. Multivariable logistic regression was used to test the association between IVT and race/ethnicity, stratified by geographic region and controlling for demographic, clinical, and hospital characteristics.
Results:
Of the 545,509 included cases, 47,031 (8.6%) received IVT. Racially/ethnically minoritized groups had significantly lower adjusted odds of IVT compared to White people in the South Atlantic region (OR 0.86, 95% CI 0.82-0.91), the East North Central region (OR 0.91, 95% CI 0.85-0.97), and the Pacific region (OR 0.90, 95% CI 0.85-0.96). In the South Atlantic region IVT use in racial/ethnic minority groups was below the national average of all racial/ethnic minority patients (p=0.002). Compared to White patients, Black patients had lower odds of IVT in the Middle Atlantic region (OR 0.84, 95% CI 0.78-0.91), the South Atlantic region (OR 0.78, 95% CI 0.74-0.82), and the East North Central region (OR 0.86, 95% CI 0.79-0.93). In the South Atlantic region this difference was below the national average for Black people (p<0.001). Hispanic patients had significantly lower use of IVT only in the Pacific region (OR 0.92, 95% CI 0.85-0.99), while Asian/Pacific Islander patients had lower odds of IVT in the Mountain (OR 0.76, 95% CI 0.59-0.98) and Pacific region (OR 0.89, 95% CI 0.82-0.97).
Conclusions:
Racial/ethnic disparities in IVT use in the U.S. vary by region. Geographic “hotspots” of lower IVT use in racially/ethnically minoritized groups are the South Atlantic region, driven predominantly by lower use of IVT in Black patients, and the East North Central and Pacific regions.
Graphical Abstract

Introduction
Intravenous thrombolysis (IVT) with tissue plasminogen activator is the cornerstone of acute ischemic stroke therapy, but is underutilized in racial and ethnic minority patients in the U.S.1–6 Geographic and regional differences with respect to population density, racial/ethnic make-up of communities, practice patterns, legislative frameworks, and social determinants other than race/ethnicity may suggest that racial/ethnic disparities in stroke care are not uniformly present across all regions in the US. In the present study, we aimed to determine geographic and regional differences in racial and ethnic disparities in IVT use in the U.S. in a representative sample of U.S. adults presenting with ischemic stroke. We hypothesized that racial/ethnic disparities in stroke IVT use in a few geographic regions drive the overall racial/ethnic IVT disparities observed at the national level. A better understanding of geographic variability and regional influences on IVT disparities may inform targeted resource allocation to address stroke care disparities based on regional needs.
Methods
Data source and case selection
This study used data from the National Inpatient Sample (NIS). NIS data can be obtained from the Healthcare Cost and Utilization Project (http://www.hcup-us.ahrq.gov) under a data use agreement. The authors are not authorized to share data independently. Analysis code may be obtained from the corresponding author after reasonable request. The REporting of studies Conducted using Observational Routinely collected health Data (RECORD) guideline was used. This study was exempt from institutional review board approval.
Adult cases with a primary discharge diagnosis of acute ischemic stroke between 2012 and 2018 were identified using administrative codes (ICD-9-CM codes for cases between 2012 and the third quarter of 2015, and ICD-10-CM codes thereafter; Supplemental Table I). Case selection and derivation of the study population are illustrated in Supplemental Figure I.
Primary exposure, outcome, and comorbidity and severity adjustment
The primary exposure was self-reported patient race/ethnicity as provided by the data source. The outcome of interest was IVT administration (Supplemental Table I). Comorbidities were measured using secondary discharge diagnoses (Supplemental Table I), as well as a modified Charlson Comorbidity Index (CCI; Supplemental Table II)7. The All Patient Refined-Diagnosis Related Groups (APR-DRGs) was used to classify the patient’s degree of loss of function8. Regional variability in racial/ethnic differences in IVT use was examined by comparing IVT use by race/ethnicity across the nine U.S. Census Bureau Divisions as captured in the variable HOSP_DIVISION. Supplemental Table III illustrates the nine geographic regions and the two-letter abbreviations of the states comprising each region.
Statistical analysis
All analyses accounted for the stratified cluster design of the NIS. Logistic regression was used to test the association between IVT and race/ethnicity within and between geographic regions. Multivariable models stratified by region were adjusted for patient demographics (age, sex, primary expected payer, and median household income in patient’s ZIP Code), year, hospital characteristics (location, teaching status, bed size, ownership), weekend admission, and clinical characteristics (modified CCI, APR-DRG, hypertension, diabetes mellitus, congestive heart failure, coronary artery disease, hyperlipidemia, atrial fibrillation, chronic kidney disease, obesity, alcohol abuse, and smoking). Observations with missing data on variables of interest were excluded (complete case analysis; Supplemental Figure I). In order to reduce potential bias from missing data, we performed sensitivity analyses with 20 sets of imputed missing values for the race/ethnicity and income variables via the multiple imputation by chained equations (MICE) approach. Racial/ethnic differences in IVT use in each region were compared to the national average of IVT differences for all racial/ethnic minorities combined, and for individual subgroups of Black, Hispanic, and Asian/Pacific Islander (PI) patients, respectively. The presence of between-region differences was first tested by a global F-test for a race/ethnicity by region interaction term (for all racial/ethnic minorities combined, and separately for Black, Hispanic, and Asian/PI patients, respectively). If an overall F-test was significant at the type I error of 0.05 level, regions with disparities below the national average were compared to each of the remaining regions. Estimates were adjusted for multiple comparisons by using the Holm-Bonferroni method. Statistical analyses were conducted using Stata version 15 (College Station, TX).
Results
Of the 545,509 included cases, 47,031 (8.6%, 95% CI 8.5%-8.7%) received IVT. IVT use varied across geographic regions, ranging from 7.3% (95% CI 6.8%-7.8%) in the New England region to 11.0% (95% CI 10.6%-11.5%) in the Mountain region. (Table 1).
Table 1. Baseline characteristics of the study population by geographic region (N=545,509).
APR-DRG: All Patient Refined-Diagnosis Related Groups. CCI: Charlson Comorbidity Index. Values represent n (%) unless stated otherwise.
| New England | Middle Atlantic | South Atlantic | East North Central | East South Central | West North Central | West South Central | Mountain | Pacific | |
|---|---|---|---|---|---|---|---|---|---|
| N | 24,618 | 77,200 | 126,198 | 84,251 | 42,331 | 25,098 | 63,032 | 27,257 | 75,524 |
| IV Thrombolysis | 1,801 (7.3) | 6,688 (8.7) | 10,360 (8.2) | 6,441 (7.6) | 3,553 (8.4) | 2,565 (10.2) | 5,086 (8.1) | 3,006 (11.0) | 7,531 (10.0) |
| Age – years: median (IQR) | 76 (64-85) | 74 (62-84) | 71 (60-82) | 72 (61-83) | 70 (60-80) | 73 (62-83) | 69 (57-81) | 72 (62-82) | 73 (62-83) |
| Female | 12,882 (52.1) | 40,135 (52.0) | 64,299 (51.0) | 44,022 (52.3) | 21,906 (51.7) | 13,129 (52.3) | 32,061 (50.9) | 13,637 (50.0) | 38,048 (50.4) |
| Race/Ethnicity | |||||||||
| White | 20,622 (83.8) | 52,319 (67.8) | 80,311 (63.6) | 63,276 (75.1) | 33,677 (79.6) | 21,502 (85.7) | 36,985 (58.7) | 20,669 (75.8) | 44,674 (59.2) |
| Black | 1,936 (7.9) | 13,691 (17.7) | 34,413 (27.3) | 15,371 (18.2) | 7,747 (18.3) | 2,726 (10.9) | 11,448 (18.2) | 1,646 (6.0) | 6,169 (8.2) |
| Hispanic | 1,241 (5.0) | 5,054 (6.5) | 7,528 (6.0) | 2,669 (3.2) | 341 (0.8) | 282 (1.1) | 10,556 (16.7) | 3,406 (12.5) | 13,057 (17.3) |
| Asian/Pacific Islander | 455 (1.8) | 2,061 (2.7) | 1,498 (1.2) | 1,191 (1.4) | 147 (0.3) | 257 (1.0) | 891 (1.4) | 697 (2.6) | 9,137 (12.1) |
| Native American and Other | 364 (1.5) | 4,075 (5.3) | 2,448 (1.9) | 1,744 (2.1) | 419 (1.0) | 331 (1.3) | 3,152 (5.0) | 839 (3.1) | 2,487 (3.3) |
| Hospital Location/Teaching Status | |||||||||
| Rural | 2,362 (9.6) | 3,529 (4.6) | 10,701 (8.5) | 8,449 (10.0) | 7,058 (16.7) | 3,984 (15.9) | 5,505 (8.7) | 1,808 (6.6) | 3,357 (4.4) |
| Urban Nonteaching | 5,596 (22.7) | 15,363 (19.9) | 44,085 (34.9) | 22,742 (27.0) | 10,963 (25.9) | 6,945 (27.7) | 17,976 (28.5) | 9,379 (34.4) | 32,083 (42.5) |
| Urban Teaching | 16,660 (67.7) | 58,308 (75.5) | 71,412 (56.6) | 53,060 (63.0) | 24,310 (57.4) | 14,155 (56.4) | 39,551 (62.7) | 16,070 (59.0) | 40,084 (53.1) |
| Hospital Bedsize | |||||||||
| Small | 7,976 (32.4) | 13,457 (17.4) | 17,020 (13.5) | 14,991 (17.8) | 3,511 (8.3) | 3,976 (15.8) | 11,255 (17.9) | 2,622 (9.6) | 10,209 (13.5) |
| Medium | 7,747 (31.5) | 25,631 (33.2) | 37,721 (29.9) | 21,565 (25.6) | 13,664 (32.3) | 4,426 (17.6) | 24,138 (38.3) | 7,768 (28.5) | 18,863 (25.0) |
| Large | 8,895 (36.1) | 38,112 (49.4) | 71,457 (56.6) | 47,695 (56.6) | 25,156 (59.4) | 16,696 (66.5) | 27,639 (43.8) | 16,867 (61.9) | 46,452 (61.5) |
| Primary Payer | |||||||||
| Medicare | 17,716 (72.0) | 52,504 (68.0) | 82,510 (65.4) | 58,219 (69.1) | 28,754 (67.9) | 17,929 (71.4) | 38,794 (61.5) | 18,356 (67.3) | 49,029 (64.9) |
| Medicaid | 1,869 (7.6) | 7,375 (9.6) | 8,695 (6.9) | 7,155 (8.5) | 3,044 (7.2) | 1,457 (5.8) | 3,594 (5.7) | 2,455 (9.0) | 9,741 (12.9) |
| Private Insurance | 4,134 (16.8) | 14,643 (19.0) | 23,197 (18.4) | 14,914 (17.7) | 7,268 (17.2) | 4,243 (16.9) | 12,820 (20.3) | 4,670 (17.1) | 13,128 (17.4) |
| Other | 899 (3.7) | 2,678 (3.5) | 11,796 (9.3) | 3,963 (4.7) | 3,265 (7.7) | 1,469 (5.9) | 7,824 (12.4) | 1,776 (6.5) | 3,626 (4.8) |
| Median Income | |||||||||
| Quartile 1 | 3,324 (13.5) | 16,023 (20.8) | 46,371 (36.8) | 24,975 (29.6) | 22,714 (53.7) | 7,074 (28.2) | 24,961 (39.6) | 7,738 (28.4) | 12,895 (17.1) |
| Quartile 2 | 4,182 (17.0) | 16,649 (21.6) | 35,622 (28.2) | 24,084 (28.6) | 10,947 (25.9) | 7,410 (29.5) | 16,134 (25.6) | 8,042 (29.5) | 16,484 (21.8) |
| Quartile 3 | 6,853 (27.8) | 20,053 (26.0) | 25,017 (19.8) | 21,646 (25.7) | 6,328 (14.9) | 6,811 (27.1) | 13,585 (21.5) | 7,041 (25.8) | 22,388 (29.6) |
| Quartile 4 | 10,259 (41.7) | 24,475 (31.7) | 19,188 (15.2) | 13,546 (16.1) | 2,342 (5.5) | 3,803 (15.1) | 8,352 (13.3) | 4,436 (16.3) | 23,757 (31.5) |
| Modified CCI | |||||||||
| 0 | 9,517 (38.7) | 28,519 (36.9) | 44,440 (35.2) | 29,180 (34.6) | 14,512 (34.3) | 9,615 (38.3) | 22,636 (35.9) | 10,835 (39.8) | 26,893 (35.6) |
| 1 | 7,023 (28.5) | 23,181 (30.0) | 38,009 (30.1) | 23,787 (28.2) | 13,264 (31.3) | 7,058 (28.1) | 19,954 (31.7) | 7,799 (28.6) | 21,930 (29.0) |
| 2 | 3,134 (12.7) | 10,276 (13.3) | 17,209 (13.6) | 11,439 (13.6) | 6,184 (14.6) | 3,230 (12.9) | 8,417 (13.4) | 3,416 (12.5) | 9,359 (12.4) |
| 3 | 2,243 (9.1) | 6,829 (8.8) | 12,020 (9.5) | 8,725 (10.4) | 3,956 (9.3) | 2,478 (9.9) | 5,571 (8.8) | 2,398 (8.8) | 7,367 (9.8) |
| ≥4 | 2,701 (11.0) | 8,395 (10.9) | 14,520 (11.5) | 11,120 (13.2) | 4,415 (10.4) | 2,717 (10.8) | 6,454 (10.2) | 2,809 (10.3) | 9,974 (13.2) |
| APR-DRG | |||||||||
| Minor | 2,817 (11.4) | 8,778 (11.4) | 13,853 (11.0) | 8,878 (10.5) | 4,218 (10.0) | 2,748 (11.0) | 6,795 (10.8) | 2,784 (10.2) | 7,848 (10.4) |
| Moderate | 12,394 (50.3) | 38,047 (49.3) | 61,663 (48.9) | 41,039 (48.7) | 20,627 (48.7) | 12,673 (50.5) | 31,647 (50.2) | 13,099 (48.1) | 35,855 (47.5) |
| Major | 7,488 (30.4) | 23,520 (30.5) | 39,481 (31.3) | 27,210 (32.3) | 13,283 (31.4) | 7,702 (30.7) | 18,768 (29.8) | 8,785 (32.2) | 24,566 (32.5) |
| Extreme | 1,919 (7.8) | 6,855 (8.9) | 11,201 (8.9) | 7,124 (8.5) | 4,203 (9.9) | 1,975 (7.9) | 5,822 (9.2) | 2,589 (9.5) | 7,255 (9.6) |
Racially/ethnically minoritized groups had significantly lower adjusted odds of IVT compared to White people in the South Atlantic (OR 0.86, 95% CI 0.82-0.91), East North Central (OR 0.91, 95% CI 0.85-0.97), and Pacific region (OR 0.90, 95% CI 0.85-0.96; Figure 1A; Supplemental Table IV); results after multiple imputation of missing values for race/ethnicity and income were similar. In the South Atlantic region IVT use in racial/ethnic minority groups was significantly lower than in racial/ethnic minority patients in the entire U.S. (the “national average”; p=0.002; Figure 1; Supplemental Table IV). Minority race/ethnicity by region interaction testing (global F-test p<0.001) showed that racial/ethnic IVT differences in the South Atlantic region differed significantly from the New England (p=0.029), the Middle Atlantic (p=0.040), and the West South Central (p<0.001) regions.
Figure 1. Regional variability in IVT disparities for all racial/ethnic minority groups.
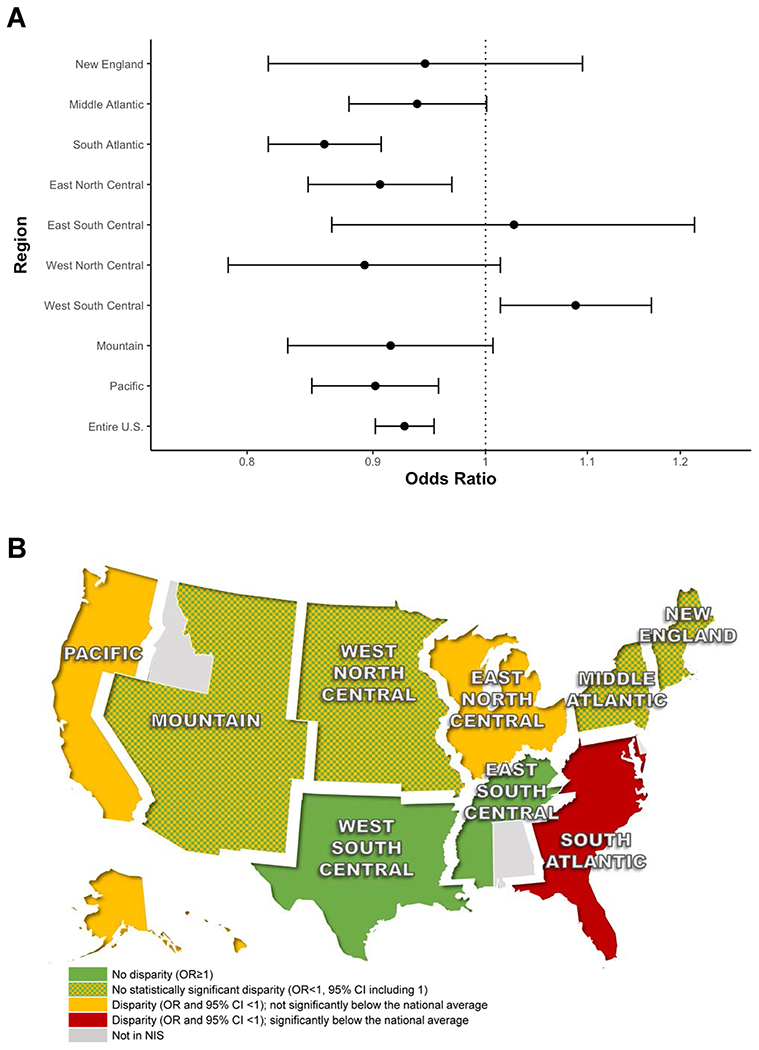
IVT use in racial/ethnic minority groups compared to White people stratified by geographic region (A); and color-coded U.S. map representing IVT treatment differences in racial/ethnic minority groups compared to White people by geographic region (B). Green areas indicate no disparity, i.e. no IVT underutilization compared to White people (OR>1); green-yellow checkered areas indicate no statistically significant disparity (OR<1, but 95% CI including 1); yellow areas indicate a disparity (i.e. lower use) comparable to the national average (OR and 95% CI <1, but not significantly below the national average); and the red areas indicate a disparity below the national average (OR and 95% CI <1, and statistically significantly below the national average).
In order to deconstruct the observed regional variability in IVT disparities by race/ethnicity, we compared IVT use within and between geographic regions among White, Black, Hispanic, and Asian/PI patients (Figure 2; Supplemental Table IV). Compared to White patients, Black patients had significantly lower odds of IVT in the Middle Atlantic (OR 0.84, 95% CI 0.78-0.91), South Atlantic (OR 0.78, 95% CI 0.74-0.82), and East North Central region (0.86, 95% CI 0.79-0.93; Figure 2A/B; Supplemental Table IV). In the South Atlantic region this difference was significantly lower than the national average for Black patients (p<0.001). Between-region differences in IVT use in Black vs. White patients (global F-test p<0.001 for Black by region interaction) were significantly greater in the South Atlantic region than in the East North Central and West South Central regions (p<0.001; and p=0.004, respectively, after adjusting for multiple comparisons). Hispanic patients had significantly lower IVT use only in the Pacific region (OR 0.92, 95% CI 0.85-0.99; Figure 2C/D; Supplemental Table IV). Hispanic vs. White differences in IVT use in the Pacific region differed significantly (global F-test p<0.001 for Hispanic by region interaction) from the New England, South Atlantic, East North Central, and West South Central regions (p=0.001; p<0.001; p=0.008; and p<0.001, respectively, adjusted for multiple comparisons). Compared to White people, Asian/PI patients had lower odds of IVT in the Mountain (OR 0.76, 95% CI 0.59-0.98) and Pacific region (OR 0.89, 95% CI 0.82-0.97; Figure 2E/F; Supplemental Table IV). There was no statistically significant between-region variability in IVT treatment differences for Asian/PI patients (global F-test p=0.229 for Asian/PI by region interaction).
Figure 2. Regional variability in IVT disparities by race/ethnicity.

IVT use in Black (A), Hispanic (C), and Asian/PI (E) patients compared to White people stratified by geographic region, and corresponding color-coded U.S. maps (B, D, and F, respectively).
Discussion
In this study, we show that racial/ethnic disparities in IVT use in the U.S. vary by region. While there were no significant racial/ethnic disparities in IVT use in several geographic regions, lower use of IVT in racial/ethnic minoritized groups was most pronounced in the South Atlantic region, driven by lower use of IVT in Black patients, and in the East North Central and Pacific regions.
Our data suggest that national racial/ethnic IVT disparities are largely driven by differences in a few geographic regions. Among Black patients the region with the lowest IVT use was also the region where Black people are numerically most represented (South Atlantic). This is in line with our previous finding that IVT use for some racial/ethnic minority patients is lower in hospitals serving predominantly racially/ethnically minoritized populations than in hospitals serving White people8. Downstream effects of structural racism, such as clustering of patients with low health literacy resulting in delay in stroke symptom recognition and/or lower utilization of emergency medical services, longer wait times for ambulance arrival, longer emergency department (ED) wait times, and a higher density of safety net hospitals providing low-quality care in areas and neighborhoods with a high proportion of racial/ethnic minoritized groups may contribute to the observed finding9–12. While our data did not allow us to discern the exact mechanism of the observed differences, strategies to mitigate the observed differences may include population-based interventions to improve health literacy, resources, and care access among racial/ethnic minoritized groups, and address systemic differences in care delivery to racial/ethnic minority patients with stroke.
The inter-regional variability of IVT disparities in Hispanic patients may highlight the unique diversity of Hispanic patient subpopulations across the U.S. While IVT disparities in stroke care are a national problem, our data may open the door for local implementation of solutions that consider the specific regional racial/ethnic make-up of communities, practice patterns, and legislative frameworks, and target specific “hotspots” rather than apply a one-size-fits-all approach.
Study limitations include the use of administrative discharge records to identify ischemic stroke cases. NIS does not include information on clinical stroke characteristics, ischemic stroke subtype and mechanism, medications, or IVT contraindications, including ED arrival times. Our geographic analysis was limited to the nine regions designated by the U.S. Census Bureau Divisions. More granular geographic information may have revealed “hotspots” of racial/ethnic disparities within some of the U.S. Census Bureau Divisions that we found to be absent of IVT disparities. Lastly, IVT treatment differences in some regions may not have reached statistical significance because of the low representation of specific racial/ethnic minority groups in these regions. Despite these limitations, our study suggests that racial/ethnic disparities in stroke thrombolysis in the U.S. cluster geographically. Resources and efforts to reduce racial/ethnic disparities in IVT use may be most effective in specific geographic regions where IVT disparities are most pronounced.
Supplementary Material
Funding Sources
Dr. Wang is supported by grant funding from the American Heart Association, and by the Johns Hopkins Institute for Clinical and Translational Research (ICTR) which is funded in part by Grant Number UL1 TR003098 from the National Center for Advancing Translational Sciences (NCATS) a component of the National Institutes of Health (NIH), and NIH Roadmap for Medical Research. Dr. Gottesman was supported by grant funding from the National Institute on Aging (K24AG052573). Dr. Faigle is supported by a National Institute of Neurological Disorders and Stroke career development award (K23NS101124).
Non-standard Abbreviations and Acronyms
- APR-DRG
All Patient Refined-Diagnosis Related Groups
- CCI
Charlson Comorbidity Index
- IVT
Intravenous thrombolysis
- NIS
National Inpatient Sample
- PI
Pacific Islander
Footnotes
Disclosures
None.
Publisher's Disclaimer: Disclaimer
This article was prepared while Dr. Rebecca Gottesman was employed at the Johns Hopkins University School of Medicine. The opinions expressed in this article are the author’s own and do not reflect the view of the National Institutes of Health, the Department of Health and Human Services, or the United States Government.
References
- 1.Aparicio HJ, Carr BG, Kasner SE, Kallan MJ, Albright KC, Kleindorfer DO, Mullen MT. Racial Disparities in Intravenous Recombinant Tissue Plasminogen Activator Use Persist at Primary Stroke Centers. J Am Heart Assoc. 2015;4:e001877. doi: 10.1161/JAHA.115.001877 [DOI] [PMC free article] [PubMed] [Google Scholar]
- 2.Faigle R, Urrutia VC, Cooper LA, Gottesman RF. Racial Differences in Utilization of Life-Sustaining vs Curative Inpatient Procedures After Stroke. JAMA Neurol. 2016;73:1151–1153. doi: 10.1001/jamaneurol.2016.1914 [DOI] [PMC free article] [PubMed] [Google Scholar]
- 3.Hsia AW, Edwards DF, Morgenstern LB, Wing JJ, Brown NC, Coles R, Loftin S, Wein A, Koslosky SS, Fatima S, et al. Racial disparities in tissue plasminogen activator treatment rate for stroke: a population-based study. Stroke. 2011;42:2217–2221. doi: 10.1161/STROKEAHA.111.613828 [DOI] [PMC free article] [PubMed] [Google Scholar]
- 4.Sacco RL, Gardener H, Wang K, Dong C, Ciliberti-Vargas MA, Gutierrez CM, Asdaghi N, Burgin WS, Carrasquillo O, Garcia-Rivera EJ, et al. Racial-Ethnic Disparities in Acute Stroke Care in the Florida-Puerto Rico Collaboration to Reduce Stroke Disparities Study. J Am Heart Assoc. 2017;6. doi: 10.1161/JAHA.116.004073 [DOI] [PMC free article] [PubMed] [Google Scholar]
- 5.Schwamm LH, Reeves MJ, Pan W, Smith EE, Frankel MR, Olson D, Zhao X, Peterson E, Fonarow GC. Race/ethnicity, quality of care, and outcomes in ischemic stroke. Circulation. 2010;121:1492–1501. doi: 10.1161/CIRCULATIONAHA.109.881490 [DOI] [PubMed] [Google Scholar]
- 6.Song S, Liang L, Fonarow GC, Smith EE, Bhatt DL, Matsouaka RA, Xian Y, Schwamm LH, Saver JL. Comparison of Clinical Care and In-Hospital Outcomes of Asian American and White Patients With Acute Ischemic Stroke. JAMA Neurol. 2019;76:430–439. doi: 10.1001/jamaneurol.2018.4410 [DOI] [PMC free article] [PubMed] [Google Scholar]
- 7.Goldstein LB, Samsa GP, Matchar DB, Horner RD. Charlson Index comorbidity adjustment for ischemic stroke outcome studies. Stroke. 2004;35:1941–1945. doi: 10.1161/01.STR.0000135225.80898.1c [DOI] [PubMed] [Google Scholar]
- 8.Faigle R, Urrutia VC, Cooper LA, Gottesman RF. Individual and System Contributions to Race and Sex Disparities in Thrombolysis Use for Stroke Patients in the United States. Stroke. 2017;48:990–997. doi: 10.1161/STROKEAHA.116.015056 [DOI] [PMC free article] [PubMed] [Google Scholar]
- 9.Churchwell K, Elkind MSV, Benjamin RM, Carson AP, Chang EK, Lawrence W, Mills A, Odom TM, Rodriguez CJ, Rodriguez F, et al. Call to Action: Structural Racism as a Fundamental Driver of Health Disparities: A Presidential Advisory From the American Heart Association. Circulation. 2020;142:e454–e468. doi: 10.1161/CIR.0000000000000936 [DOI] [PubMed] [Google Scholar]
- 10.Hsia RY, Huang D, Mann NC, Colwell C, Mercer MP, Dai M, Niedzwiecki MJ. A US National Study of the Association Between Income and Ambulance Response Time in Cardiac Arrest. JAMA Netw Open. 2018;1:e185202. doi: 10.1001/jamanetworkopen.2018.5202 [DOI] [PMC free article] [PubMed] [Google Scholar]
- 11.Jha AK, Orav EJ, Li Z, Epstein AM. Concentration and quality of hospitals that care for elderly black patients. Arch Intern Med. 2007;167:1177–1182. doi: 10.1001/archinte.167.11.1177 [DOI] [PubMed] [Google Scholar]
- 12.Karve SJ, Balkrishnan R, Mohammad YM, Levine DA. Racial/ethnic disparities in emergency department waiting time for stroke patients in the United States. J Stroke Cerebrovasc Dis. 2011;20:30–40. doi: 10.1016/j.jstrokecerebrovasdis.2009.10.006 [DOI] [PubMed] [Google Scholar]
Associated Data
This section collects any data citations, data availability statements, or supplementary materials included in this article.