Vertebrall fractures are the most common osteoporotic fractures and are associated with the highest risk of subsequent incident fractures [1]. The majority of vertebral fractures do not come to medical attention and thus remain undiagnosed [2]. In most osteoporosis guidelines [3, 4], vertebral fracture, unrelated to trauma and on its own, represents an intervention threshold for pharmacological treatment and may need no further risk assessment, including bone mineral density (BMD) measurement. Furthermore, the Endocrine Society has recently published a clinical practice guideline related to therapy of osteoporosis in menopausal women who are a year or more past their final menstruation, [5] in which they recommended treatment with bone-forming agents in these women with osteoporosis at very high risk of fracture, such as those with severe (Grade 3) or multiple vertebral fractures. Anabolic therapy has recently proven to be superior to antiresorptives for incident vertebral fracture prevention in randomized, controlled clinical trial data of teriparatide versus risedronate [6].
Although vertebral fractures are common and important in osteoporosis diagnosis and management, the definition of osteoporotic vertebral fracture remains controversial [7–10]. Our purpose is to clear confusion for clinicians.
In 2000, 21.5% of men and 23.5% of women in a population-based national cohort of 6433 persons aged ≥ 50 years showed a Grade 1 or higher vertebral fracture (VF) or deformity that were systematically assessed by lateral vertebral radiography [11]. This prevalence was based on technologist triage followed by determination of 20–25% anterior wedging or three standard deviations (3 SD) greater height deviation than unaffected vertebrae at the same anatomical level in the same cohort [12]. On spine radiographs, the method identified the anterior, posterior, and middle vertebral heights of the superior and inferior endplates and compared the morphometry with the same, unaffected vertebral body in the population, as had Eastell in Rochester data [13]. Further refinements of the morphometric approach to vertebral fractures were developed by the late Professor Harry Genant at the University of California, San Francisco [14] who further clarified vertebral deformities by grades of height loss—Grade 1 loss of 20–25%, Grade 2 of 26–40%, and Grade 3 of > 40% [14] that remain in common use. Although this now-classical text also mentions “endplate deformities and buckling of cortices” and “loss of vertical continuity of vertebral morphology” (page 1145), the persuasive powers of its diagram of changed vertebral shapes has since taken precedence [14].
However, not every vertebral deformity represents an osteoporotic vertebral fracture.
Cross-sectional Canadian Multicentre Osteoporosis Study (CaMos) data on vertebral deformities or VF from randomly sampled women (2/3) and men (1/3) around nine urban centers from coast to coast across Canada, published in 2000, were similar to results previously documented in large USA, British, and European cohorts [12]. (Note that these radiographic VF, no matter how evaluated, are distinct from clinical VF in which a person has focal, usually acute, back pain and an investigating spine radiograph shows evidence of fracture.)
At about the same time, one of us (JCP), an academic working in the Vancouver, Canada, osteoporosis clinic was referred a healthy 60-year old Chinese man for osteoporosis evaluation and treatment because his CaMos spine radiographs had been interpreted as revealing a Grade 1 “vertebral fracture” at T-8. He was healthy, of normal weight and height, and his bone mineral density (BMD) was normal. He had no family history of fragility fracture, no clinical risk factors, no major trauma, and no previous fracture. (Note that this was pre-FRAX but we estimate his major osteoporotic fracture risk would have been less than 3%.) Should this man be prescribed an osteoporosis therapy (etidronate, the bisphosphonate then available in Canada)? Said another way: Did this healthy fellow with a Grade 1 vertebral deformity have osteoporosis that required treatment?
The diagnosis of “vertebral fracture” is controversial. It is often remarked that there is no “gold standard” for diagnosis of osteoporotic vertebral fracture [15]. Two primary assessment methods currently compete: the morphometric method of Genant (called Genant Semiquantitative analysis, GSQ) [14] that relies on assessment of vertebral height, and the morphologic (or “structural”) method which depends on informed recognition of breaks in superior and inferior endplates as proposed by the Sheffield group (called Algorithm-Based Qualitative, ABQ) [16], and modified by Lentle et. al. to also include cortical breaks (mABQ) [7]. Others have questioned “short anterior height” vertebrae as part of systemic osteoporosis [17].
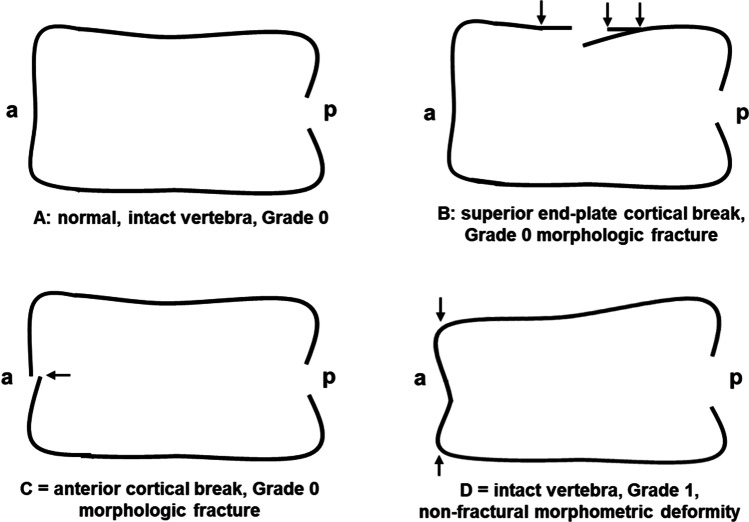
Figure 1 illustrates the fundamental issue in radiographic vertebral fracture/deformity diagnosis. It shows that vertebrae may have the same shape and dimensions as normal (called Grade 0), yet have morphologic vertebral endplate or anterior cortical breaks. In addition, an intact vertebra may have a shortened anterior height and be considered a Grade 1 morphometric “vertebral fracture” but have little relationship with what we know of clinical osteoporosis. Previous cross-sectional data have examined the frequency of morphometric versus morphologic fractures and shown that Grade 1 morphometric “VF” are a lot more prevalent than are morphologic VF [7, 8].
Fig. 1.
This diagram shows four vertebrae to illustrate the issues involved in differentiating Grade I morphometric “vertebral fractures” (assessed by the Genant Semiquantitative, GSQ method) from morphologic or structural vertebral fractures (by the modified Algorithm-Based Qualitative, ABQ method). (A) Grade 0, intact, normal-shaped vertebral body without a vertebral fracture; (B) Grade 0 morphologic fracture of the superior endplate (ABQ); (C) Grade 0 morphologic fracture of the anterior cortex (modified ABQ); (D) Grade 1 intact vertebral body with decreased anterior height that is a (GSQ) vertebral deformity. “a” = anterior and “p” = posterior (drawn by JCP and BCL with refinements by Dharani Kalidasan MSc)
To decide which of the two competing methods (barring a gold standard) is the more specific and accurate for radiographic vertebral fracture (VF) assessment (morphometric versus morphologic), we need to answer several questions:
Do morphometric or morphologic vertebral fractures similarly correlate with low or “osteoporotic” BMD levels (T-scores ≤ 2.5)?
Do morphometric or morphologic vertebral fractures better predict incident vertebral and non-vertebral fragility fractures?
Are morphometric and morphologic vertebral fractures of similar spine segmental (anatomical) distribution and gender prevalence as that expected given what is now known of the natural history of osteoporosis?
Using recently published, population-based data, primarily from the CaMos and the Rotterdam Study research, we seek to answer these key questions.
Relationship of vertebral fractures with low BMD
Using BMD in participants without a radiographic VF as the comparator, both morphometric and morphologic VF of all grades (Gr 0–3) are associated with lower BMD values. This was true for the femoral neck (FN) BMD measured in the Rotterdam Study [8] and for lumbar spine (L1–4), FN, and total hip (TH) BMD [7] data in CaMos. Regression assessment of BMD differences between Grade 1 morphometric and morphologic deformities in the entire CaMos baseline cohort (adjusted for age, height, BMI, and sex) documented significantly lower BMD values in those with Grade 1 morphologic than Grade 1 morphometric deformities: L1–4 (− 0.073 [95% CI − 0.122; − 0.024]), FN (− 0.047 [− 0.078; − 0.016]), and TH (− 0.052 [− 0.089; − 0.015]) [7]. However, in USA cross-sectional assessment of individuals selected to represent national data (NHANES), 26% of those with osteoporosis by BMD T-scores of ≤ 2.5 had prevalent morphometric vertebral fractures [18]. Thus, morphologic vertebral deformities and fractures are more strongly associated with the lower BMD values of osteoporosis than are morphometric vertebral deformities and fractures.
Vertebral fractures as predictors of incident fractures
Remarkably fewer incident morphometric than morphologic vertebral fractures are documented in prospective cohort data [7, 8, 19, 20]; reasons for this observation remain unclear.
Using a modified morphologic method that included anterior cortical breaks as well as endplate fractures (Fig. 1C), CaMos and the Rotterdam Study data documented that both morphometric and morphologic vertebral deformities/VF (of all grades) appear to predict incident VF [7, 8]. When prospectively examining all sites of incident osteoporotic fracture, however, vertebral deformities/VF by morphometric criteria were less consistently related to fractures at other sites. In the prospective Rotterdam Study, prevalent morphologic fractures predicted non-vertebral, hip, and clinical vertebral fractures but morphometric deformities/VF did not predict incident hip fractures [8]. In the CaMos prospective data, morphologic deformities/VF predicted all incident fractures but morphometric deformities/VF did not predict incident non-vertebral fractures. Thus, morphologic VF are more consistent and comprehensive predictors of osteoporotic incident fractures than are morphometric VF and deformities.
Vertebral fracture spinal anatomy and sex/gender distribution
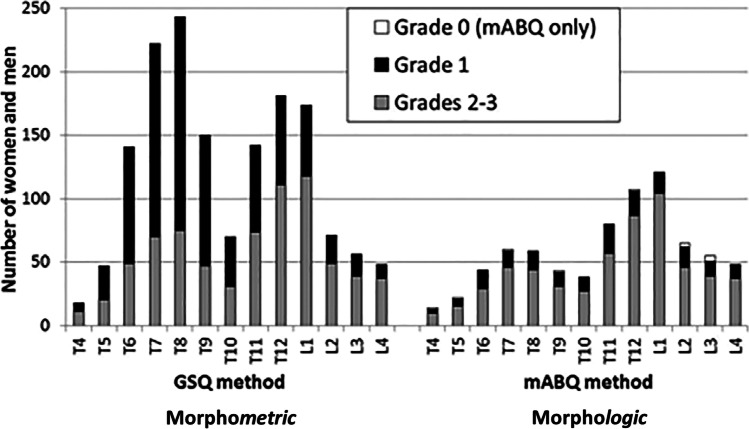
Multiple studies have shown that prevalent or baseline morphometric deformities/VF are more likely to be diagnosed in the mid-thoracic spine (T7–9) compared with morphologic deformities/VF that predominate in T11-L1 [7, 8, 19] (Fig. 2). This anatomical/segmental difference in prevalent vertebral Grade 1 deformities and VF is striking between the two methods of vertebral fracture assessment.
Fig. 2.
This diagram, reprinted from [7] with permission, contrasts the prevalent (baseline) anatomical/segmental distribution along the entire vertebral length, of Grade 1 and higher morphometric vertebral deformities and fractures versus similar grades of morphologic vertebral fractures. The morphometric assessment shows much more common prevalent fractures and a peak at T8 of Grade 1 vertebral deformities and a lesser one at T12. The morphologic method shows fewer baseline vertebral fractures of all grades with a Grade 1 maximum VF prevalence at L1
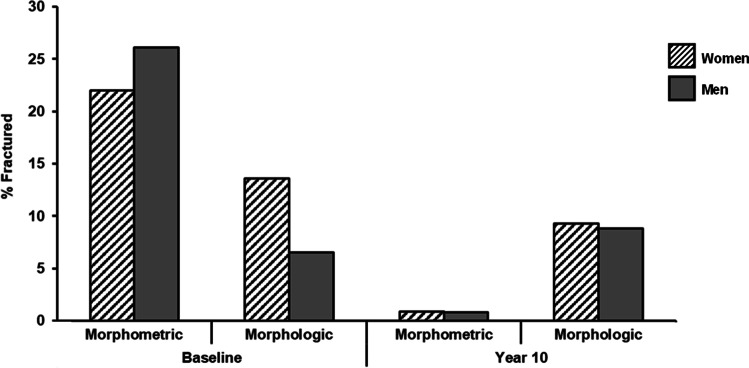
As CaMos initial, cross-sectional radiographic data so clearly showed, men are nearly equally likely to have morphometric VF and deformities as women [12]. This observation differs from the gendered natural history of other fractures that occur predominantly in women [14, 15, 21] (even when accounting for men’s competing risk of mortality and average higher BMD) [19, 22]. Furthermore, at baseline, examining percentage of VF by sex/gender, there were 2.1 times the proportion of women than men in CaMos with a prevalent morphologic VF although men slightly predominated in baseline morphometric ones (Fig. 3). In the same cohort over 10 years, the rate of incident morphometric and morphologic VF and deformities were similar in men and women [19].
Fig. 3.
This bar graph contrasts the baseline sex/gender distribution of vertebral deformities and fractures in the Canadian Multicentre Osteoporosis Study cohort of 828 individuals whose spine radiographs were systematically assessed at baseline and after 10 years using both morphometric (GSQ) and morphologic (mABQ) methods [7]. Morphometric methods showed a higher prevalence of VF and deformities as well as that vertebral deformities were more frequent in men than women. The morphologic assessment documented fewer prevalent VF and a more typical osteoporosis-related predominance in women. There were no sex/gender differences in incident VF and deformities by either assessment method (drawn by Dharani Kalidasan MSc)
It is interesting that the loss of a gender difference in incident morphometric VF 10 years later in CaMos is similar across the two VF assessment methods. This likely reflects the trend over time documented by CaMos related to incident hip fractures (both community-dwelling men and women aged ≥ 75 at baseline had a 7.0% 10-year likelihood of an incident hip fracture [22]) and in population-based data from Finland [23]. Given the importance of gender differences and their documentation in research [24], if a method of measurement does not reflect the gender/sex distribution that is known to occur in a disease entity, that method needs to be questioned.
In summary, in every carefully studied instance, vertebral fractures diagnosed by morphologic criteria (even when of Grades 0 and 1) are more specific (and accurate) for the diagnosis of osteoporosis by BMD criteria, and the prediction of incident osteoporotic fragility fractures than are morphometric deformities and VF. It seems likely that prevalent Grade 1 morphometric deformities may be the end result of a number of diverse processes yet are rarely or never related to osteoporosis.
What are the implications of answers to these three key vertebral fracture questions? We should stop referring to “wedge fractures” and vertebral “deformities” and measuring (or eye-balling) vertebral heights. It is also time to re-visit the issue of a missing gold standard for osteoporotic vertebral fracture. We now understand, that a vertebral endplate or cortex break, or discontinuity, with or without a change in vertebral height, is a bona fide vertebral fracture. Thus, the vertebral fracture gold standard is the same as we use for diagnosing any bone fracture at any site. To put it simply—we should generally ignore prevalent Grade 1 morphometric vertebral deformities. If there is no break, there is no vertebral fracture.
Footnotes
Publisher's note
Springer Nature remains neutral with regard to jurisdictional claims in published maps and institutional affiliations.
Contributor Information
J. C. Prior, Email: jerilynn.prior@ubc.ca
Brian C. Lentle, Email: bclentle@gmail.com
References
- 1.Danila MI, Outman RC, Rahn EJ, et al. Evaluation of a multimodal, direct-to-patient educational intervention targeting barriers to osteoporosis care: a randomized clinical trial. J Bone Miner Res. 2018;33:763–772. doi: 10.1002/jbmr.3395. [DOI] [PMC free article] [PubMed] [Google Scholar]
- 2.Fink HA, Milavetz DL, Palermo L, Nevitt MC, Cauley JA, Genant HK, Black DM, Ensrud KE. What proportion of incident radiographic vertebral deformities is clinically diagnosed and vice versa? J Bone MinerRes. 2005;20:1216–1222. doi: 10.1359/JBMR.050314. [DOI] [PubMed] [Google Scholar]
- 3.Kanis JA, Adachi JD, Cooper C, et al. (2013) Standardising the descriptive epidemiology of osteoporosis: recommendations from the Epidemiology and Quality of Life Working Group of IOF. 24:2763-2764 [DOI] [PMC free article] [PubMed]
- 4.Kanis JA, Cooper C, Rizzoli R, Reginster JY, Scientific Advisory Board of the European Society for C, Economic Aspects of O, the Committees of Scientific A, National Societies of the International Osteoporosis F (2019) European guidance for the diagnosis and management of osteoporosis in postmenopausal women. Osteoporos Int 30:3-44 [DOI] [PMC free article] [PubMed]
- 5.Eastell R, Rosen CJ, Black DM, Cheung AM, Murad MH, Shoback D. Pharmacological management of osteoporosis in postmenopausal women: an endocrine society* Clinical Practice Guideline. J Clin Endocrinol Metab. 2019;104:1595–1622. doi: 10.1210/jc.2019-00221. [DOI] [PubMed] [Google Scholar]
- 6.Kendler DL, Marin F, Zerbini CAF, et al. Effects of teriparatide and risedronate on new fractures in post-menopausal women with severe osteoporosis (VERO): a multicentre, double-blind, double-dummy, randomised controlled trial. Lancet. 2018;391:230–240. doi: 10.1016/S0140-6736(17)32137-2. [DOI] [PubMed] [Google Scholar]
- 7.Lentle BC, Berger C, Probyn L, et al. Comparative analysis of the radiology of osteoporotic vertebral fractures in women and men: cross-sectional and longitudinal observations from the Canadian Multicentre Osteoporosis Study (CaMos) J Bone Miner Res. 2018;33:569–579. doi: 10.1002/jbmr.3222. [DOI] [PubMed] [Google Scholar]
- 8.Oei L, Koromani F, Breda SJ, et al. Osteoporotic vertebral fracture prevalence varies widely between qualitative and quantitative radiological assessment methods: the Rotterdam Study. J Bone Miner Res. 2018;33:560–568. doi: 10.1002/jbmr.3220. [DOI] [PubMed] [Google Scholar]
- 9.Lentle B, Koromani F, Brown JP, et al. (2019) The radiology of osteoporotic vertebral fractures revisited. J Bone Mineral Res 34:e3669 [DOI] [PubMed]
- 10.Lentle BC, Oei EH, Goltzman D, et al. (2018) Vertebral fractures and morphometric deformities. 33: 1544–1545 correspondence [DOI] [PubMed]
- 11.Kreiger N, Tenenhouse A, Joseph L, Mackenzie T, Poliquin S, Brown JP, Prior JC, Rittmaster RS. Research notes: the Canadian Multicentre Osteoporosis Study (CaMos): background, rationale, methods. Can J Aging / La Revue canadienne du vieillissement. 1999;18:376–387. doi: 10.1017/S0714980800009934. [DOI] [Google Scholar]
- 12.Jackson SA, Tenenhouse A, Robertson L. Vertebral fracture definition from population-based data: preliminary results from the Canadian Multicenter Osteoporosis Study (CaMos) Osteoporos Int. 2000;11:680–687. doi: 10.1007/s001980070066. [DOI] [PubMed] [Google Scholar]
- 13.Eastell R, Cedel SL, Wahner HW, Riggs BL, Melton LJ., 3rd Classification of vertebral fractures. J Bone Miner Res. 1991;6:207–215. doi: 10.1002/jbmr.5650060302. [DOI] [PubMed] [Google Scholar]
- 14.Genant HK, Wu CY, van Kuijk C, Nevitt MC. Vertebral fracture assessment using a semiquantitative technique. J Bone Miner Res. 1993;8:1137–1148. doi: 10.1002/jbmr.5650080915. [DOI] [PubMed] [Google Scholar]
- 15.Lentle BC. Gender and the recognition of vertebral fractures. Quant Imaging Med Surg. 2020;10:1401–1407. doi: 10.21037/qims.2020.04.12. [DOI] [PMC free article] [PubMed] [Google Scholar]
- 16.Jiang G, Eastell R, Barrington NA, Ferrar L. Comparison of methods for the visual identification of prevalent vertebral fracture in osteoporosis. Osteoporos Int. 2004;15:887–896. doi: 10.1007/s00198-004-1626-1. [DOI] [PubMed] [Google Scholar]
- 17.Ferrar L, Jiang G, Armbrecht G, Reid DM, Roux C, Glüer CC, Felsenberg D, Eastell R. Is short vertebral height always an osteoporotic fracture? The Osteoporosis and Ultrasound Study (OPUS) Bone. 2007;41:5–12. doi: 10.1016/j.bone.2007.03.015. [DOI] [PubMed] [Google Scholar]
- 18.Cosman F, Krege JH, Looker AC, et al. Spine fracture prevalence in a nationally representative sample of US women and men aged ≥40 years: results from the National Health and Nutrition Examination Survey (NHANES) 2013–2014. Osteoporos Int. 2017;28:1857–1866. doi: 10.1007/s00198-017-3948-9. [DOI] [PMC free article] [PubMed] [Google Scholar]
- 19.Lentle BC, Berger C, Brown JP, et al. Vertebral fractures: which radiological criteria are better associated with the clinical course of osteoporosis? Can Assoc Radiol J. 2021;72:150–158. doi: 10.1177/0846537120943529. [DOI] [PubMed] [Google Scholar]
- 20.Leslie WD, Langsetmo L, Zhou W, et al. Choice of lumbar spine bone density reference database for fracture prediction in men and women: a population-based analysis. J Clin Densitom. 2014;17:295–300. doi: 10.1016/j.jocd.2013.09.003. [DOI] [PMC free article] [PubMed] [Google Scholar]
- 21.Orwoll ES, Bliziotes M. Heterogeneity in osteoporosis. Men versus women. Rheum Dis Clin North Am. 1994;20:671–689. doi: 10.1016/S0889-857X(21)00355-0. [DOI] [PubMed] [Google Scholar]
- 22.Prior JC, Langsetmo L, Lentle BC, et al. Ten-year incident osteoporosis-related fractures in the population-based Canadian Multicentre Osteoporosis Study - comparing site and age-specific risks in women and men. Bone. 2014;71C:237–243. doi: 10.1016/j.bone.2014.10.026. [DOI] [PMC free article] [PubMed] [Google Scholar]
- 23.Pekonen SR, Kopra J, Kröger H, Rikkonen T, Sund R. Regional and gender-specific analyses give new perspectives for secular trend in hip fracture incidence. Osteoporos Int. 2021;32:1725–1733. doi: 10.1007/s00198-021-05906-6. [DOI] [PMC free article] [PubMed] [Google Scholar]
- 24.Rich-Edwards JW, Kaiser UB, Chen GL, Manson JE, Goldstein JM. Sex and gender differences research design for basic, clinical, and population studies: essentials for investigators. Endocr Rev. 2018;39:424–439. doi: 10.1210/er.2017-00246. [DOI] [PMC free article] [PubMed] [Google Scholar]


