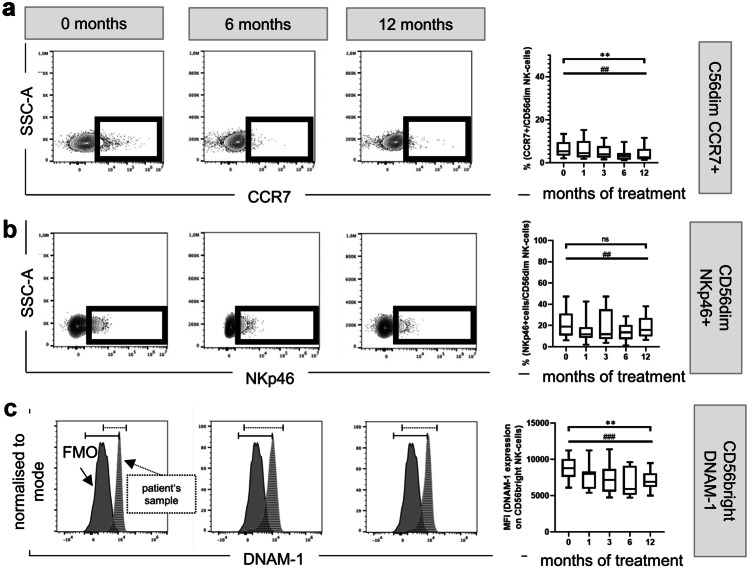
Fig. 4.
Effect of fingolimod therapy on NK cell activation and chemotactic responses. Representative FACS plots and a histogram displaying fingolimod-induced changes over time of CCR7 (a), NKp46 (b), and DNAM-1 (c) are depicted on the left-side. Box-and-whisker plots on the right-side show the corresponding quantification for all patients at all time points. MANOVA *p ≤ 0.05; **p ≤ 0.01; ***p ≤ 0.001; exact Wilcoxon test #p ≤ 0.05; ##p ≤ 0.01; ###p ≤ 0.001; SSC side scatter, -A pulse area, FMO fluorescence minus one, MFI median fluorescence intensity

