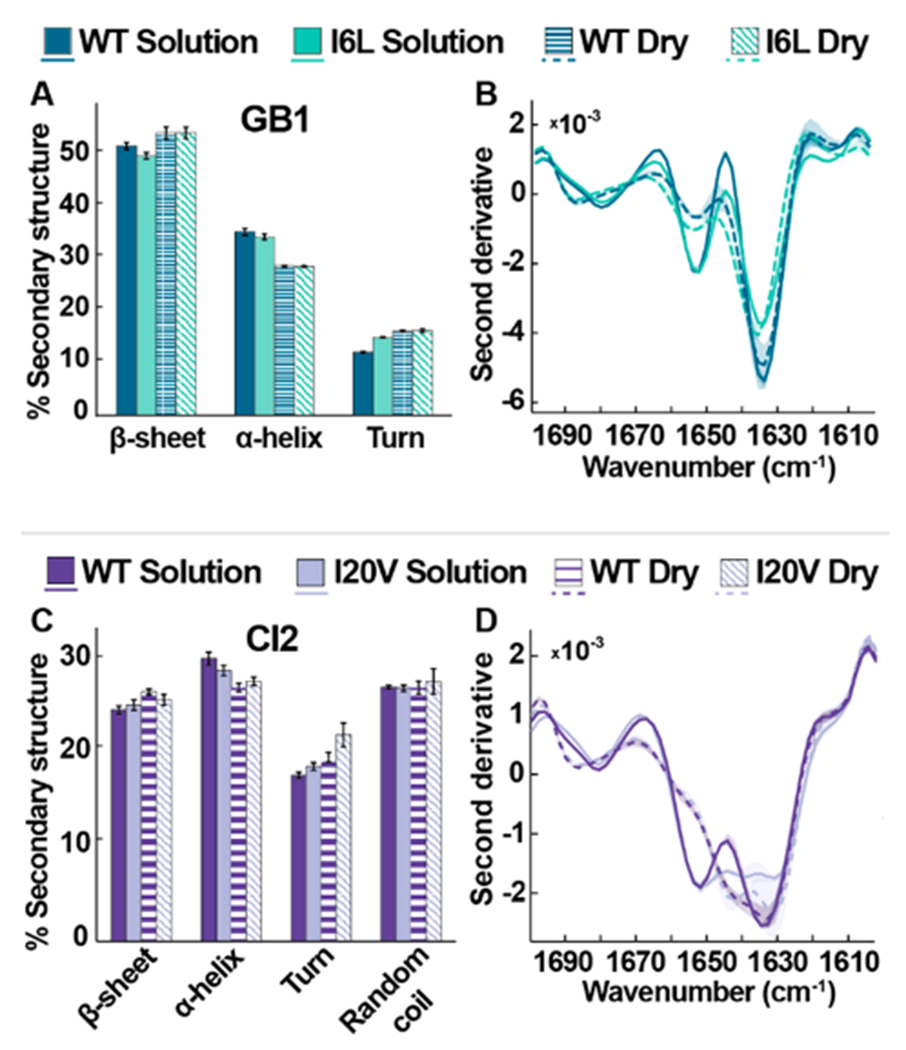
Figure 2.

FTIR studies of wild-type and variant proteins in solution (7.5 mM HEPES, pH 6.5) and the lyophilized state. (A, C) Average secondary structures of GB1 and CI2 variants. Error bars represent standard deviations from the mean. (B, D) Averaged second derivative spectra. Shadows represent the range of data from three independent experiments.
