Permanyer et al. (1) extend the analysis of human longevity by Vaupel et al. (2) to analyze trends in best-practice healthy life expectancy (BPHLE) in addition to best-practice life expectancy (BPLE) at birth. They estimate that, in the period 1990–2019, BPHLE increased at a slower pace than BPLE. We concur with Permanyer et al. (1) about the importance of healthy life expectancy. Differences in trends between BPHLE and BPLE, however, are not obvious when it is recognized that BPHLE estimates are uncertain.
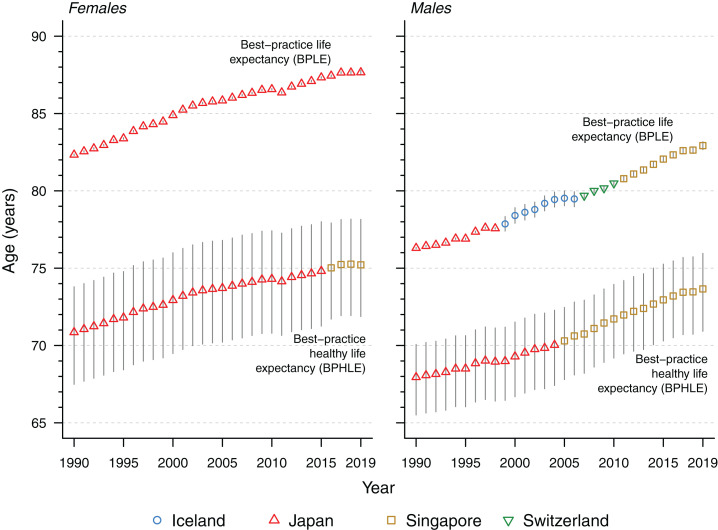
As life expectancy rises, it is unclear whether the extra years of life are being lived in good health. Mixed results have been found, depending on the age, population, and measure used (3). Since the seminal work by Sanders (4), there has not been a consensus on how to measure healthy life expectancy. The debate is ongoing, as acknowledged by Permanyer et al. (1). Fig. 1 replicates figure 1 in ref. 1 using the same data from the Global Burden of Disease (5) but incorporating the reported 95% uncertainty intervals (UIs) (vertical lines).
Fig. 1.
BPLE and BPHLE with 95% UIs (vertical lines), 1990–2019. Source: Global Burden of Disease (5).
All the analyses in ref. 1 are based on point estimates, with no mention of their uncertainty. Incorporating the uncertainty of each data point (5) in the calculation of the best-practice linear trends is not straightforward, and different approaches may be adopted. For simplicity, we assumed all the data are normally distributed with mean values equal to the point estimates. We approximated the SD as one-fourth of the range of the corresponding 95% UIs. With these assumptions, we carried out a Monte Carlo simulation by randomly sampling 20,000 draws of year- and sex-specific estimates of BPHLE and BPLE from the corresponding distributions. Next, we fitted a linear regression to each draw, obtaining 20,000 estimates of the slope for each set, and derived summary measures. Results are shown in Table 1. The point estimates match with the values reported in ref. 1, but the uncertainty intervals of the sex-specific slopes of BPHLE and BPLE overlap, which reveals an important fact: Differences in trends between BPHLE and BPLE described in ref. 1 are not statistically significant.
Table 1.
Regression slopes of BPHLE and BPLE trends, and their corresponding 95% UIs (within square brackets), 1990–2019
| Slope of BPHLE | Slope of BPLE | |
| Females | 0.150 [0.085 to 0.216] | 0.187 [0.186 to 0.188] |
| Males | 0.210 [0.161 to 0.261] | 0.237 [0.233 to 0.240] |
Source: Author’s calculations using data from ref. 5.
This example illustrates the importance of assessing and reporting uncertainty. Otherwise, conclusions should be formulated with caution. One of the main points of Vaupel et al. (2) is that forecasts are uncertain and the calculation of credible prediction intervals is essential. Definitions of healthy life expectancy vary greatly, and, given a definition, measurement is problematic. Some definitions focus on clinical conditions; others emphasize the ability to live independently (6). A person with a pacemaker, for instance, may be viewed as unhealthy in one study and healthy in another. The approach adopted in the Global Burden of Disease dataset (5) used in ref. 1 has many limitations because values had to be estimated for many countries. For these reasons, uncertainty about trends in BPHLE is even larger than shown in Table 1.
Acknowledgments
We are thankful to Fernando Colchero and Jamie Perin for input. This research was partially supported by the AXA Research Fund, and the European Research Council (Grant ERC-2019-AdG-884328). F.V. acknowledges funding from the Juan de la Cierva Programme, Spanish Ministry of Science and Innovation (Grant IJC2019-039144-I).
Footnotes
The authors declare no competing interest.
Data Availability
Code, data, and readme file have been deposited in GitHub (https://github.com/panchoVG/RiseOfLongevity- PNAS2021).
References
- 1.Permanyer I., Trias-Llimós S., Spijker J., Best-practice healthy life expectancy vs. life expectancy: Catching up or lagging behind? Proc. Natl. Acad. Sci. U.S.A., 10.1073/pnas.2115273118 (2021). [DOI] [PMC free article] [PubMed] [Google Scholar]
- 2.Vaupel J. W., Villavicencio F., Bergeron-Boucher M.-P., Demographic perspectives on the rise of longevity. Proc. Natl. Acad. Sci. U.S.A. 118, e2019536118 (2021). [DOI] [PMC free article] [PubMed] [Google Scholar]
- 3.Beltrán-Sánchez H., Soneji S., Crimmins E. M., Past, present, and future of healthy life expectancy. Cold Spring Harb. Perspect. Med. 5, a025957 (2015). [DOI] [PMC free article] [PubMed] [Google Scholar]
- 4.Sanders B. S., Measuring community health levels. Am. J. Public Health Nations Health 54, 1063–1070 (1964). [DOI] [PMC free article] [PubMed] [Google Scholar]
- 5.Institute for Health Metrics and Evaluation, Global Burden of Disease Study 2019 (GBD 2019) results. http://ghdx.healthdata.org/gbd-results-tool. Accessed 27 August 2021.
- 6.Christensen K., Doblhammer G., Rau R., Vaupel J. W., Ageing populations: The challenges ahead. Lancet 374, 1196–1208 (2009). [DOI] [PMC free article] [PubMed] [Google Scholar]
Associated Data
This section collects any data citations, data availability statements, or supplementary materials included in this article.
Data Availability Statement
Code, data, and readme file have been deposited in GitHub (https://github.com/panchoVG/RiseOfLongevity- PNAS2021).


