Vaupel et al. (1) update previous important work on demographic perspectives on longevity and life expectancy (LE) based on the steady increase in best-practice life expectancy (BPLE) since 1840 (2). In those studies, Vaupel and coworkers state that BPLE has been steadily increasing 0.25 y per annum since 1840 and speculate that most children born in low-mortality countries since 2000 will celebrate their 100th birthday. We aim to revisit the previous analyses, shifting our attention to the trends in healthy life expectancy (HLE), that is, an indicator that measures the number of years individuals are expected to live free of disease or disability (3, 4). We argue here that the slower pace at which best-practice healthy life expectancy (BPHLE) increases paints a less optimistic picture than the one obtaining after inspecting BPLE trends alone.
While death is retreating to increasingly higher ages, it is unclear whether the onset of disease and disability are doing the same, an issue that could endanger the proper functioning of contemporary societies (e.g., by threatening the sustainability of pension systems, or the provision of health care to increasingly older populations). The so-called “compression vs. expansion of morbidity” debate, which tries to elucidate whether morbidity retreats to older ages at higher or lower speed than mortality does (5–7), has been raging for a long time. So far, the evidence supporting the different hypotheses is mixed, as the extent to which HLE compares with LE trends depends on the morbidity measures used to calculate HLE and country and time contexts (e.g., refs. 3 and 8).
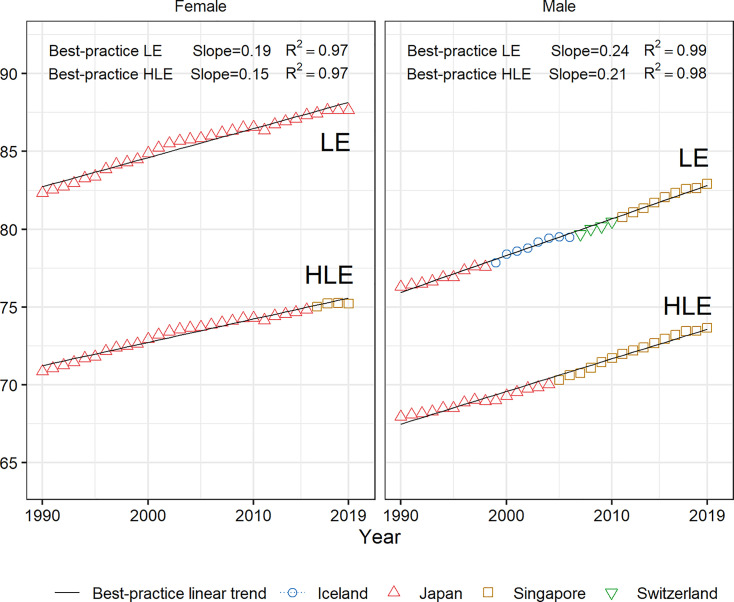
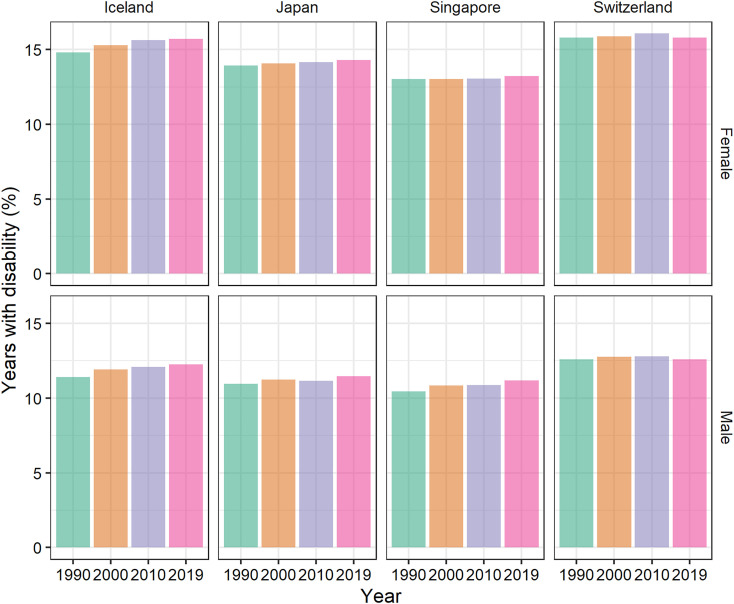
Here we investigate the trends in BPHLE and BPLE using the 1990–2019 estimates from the Global Burden of Disease Study (9). For females, BPHLE increases at a slower pace than BPLE (Fig. 1), and the fit is very high (). The regression slopes are 0.15 and 0.19, respectively—the latter being clearly lower than the 0.25 presented in refs. 1 and 2. For males, the BPLE slope is again higher than the one for BPHLE (0.24 vs. 0.21) (). BPLE and BPHLE therefore increase at a faster pace for men, although they start at considerably lower levels than is observed for women. Fig. 2 shows how the fraction of life expectancy spent in less-than-good health for the four countries featuring as best performers in Fig. 1 tends to increase between 1990 and 2019. These trends lend support to the “expansion side” of the debate; that is, mortality seems to decline at a faster pace than morbidity does when focusing on best-practice countries.
Fig. 1.
BPLE (Top) and BPHLE (Bottom) for females and males between 1990 and 2019 (excluding Kuwait, San Marino, and Andorra). Source is authors’ elaboration based on the Global Burden of Disease Study 2019 data (9, 11).
Fig. 2.
Fraction of life expectancy spent with disability for Iceland, Japan, Singapore, and Switzerland in 1990, 2000, 2010, and 2019. Source is authors’ elaboration based on the Global Burden of Disease Study 2019 data (9, 11).
The expected future rises of longevity, perhaps even to an LE of 100 y (1), represent major social challenges, as they may be accompanied by rising morbidity (as suggested here) as well as widespread comorbidity (10). This urges the need to mobilize resources toward reducing morbidity, either through preventive policies that delay the onset of disease and disability (e.g., promoting healthy lifestyles and environments) or through treatments and/or technological innovations reducing the burden of disease and disability among individuals already living in morbid states.
Acknowledgments
The study is supported with funding provided by the European Research Council (ERC-2019-COG Grant Agreement 864616, HEALIN). S.T.-L. and J.S. acknowledge research funding from the Juan de la Cierva-Formación (Grant FJC-2019-039314-I) and Ramón y Cajal I3 (Grant RYC-2013-14851) programs of the Spanish Ministry of Science and Innovation, respectively.
Footnotes
The authors declare no competing interest.
Data Availability
Data used in this study can be easily downloaded at Global Health Data Exchange, http://ghdx.healthdata.org/gbd-results-tool (11).
References
- 1.Vaupel J. W., Villavicencio F., Bergeron-Boucher M.-P., Demographic perspectives on the rise of longevity. Proc. Natl. Acad. Sci. U.S.A. 118, e2019536118 (2021). [DOI] [PMC free article] [PubMed] [Google Scholar]
- 2.Oeppen J., Vaupel J. W., Demography. Broken limits to life expectancy. Science 296, 1029–1031 (2002). [DOI] [PubMed] [Google Scholar]
- 3.Jagger C., Robine J.-M., “Healthy life expectancy” in International Handbook of Adult Mortality, Rogers R. G., Crimmins E. M., Eds. (Springer, 2011), pp. 551–568. [Google Scholar]
- 4.Robine J.-M., Saito Y., Jagger C., The relationship between longevity and healthy life expectancy. Qual. Ageing Older Adults 10, 5–14 (2009). [Google Scholar]
- 5.Fries J. F., The compression of morbidity. Milbank Mem. Fund Q. Health Soc. 61, 397–419 (1983). [PubMed] [Google Scholar]
- 6.Gruenberg E. M., The failures of success. Milbank Mem. Fund Q. Health Soc. 55, 3–24 (1977). [PubMed] [Google Scholar]
- 7.Manton K. G., Changing concepts of morbidity and mortality in the elderly population. Milbank Mem. Fund Q. Health Soc. 60, 183–244 (1982). [PubMed] [Google Scholar]
- 8.Crimmins E. M., Zhang Y., Saito Y., Trends over 4 decades in disability-free life expectancy in the United States. Am. J. Public Health 106, 1287–1293 (2016). [DOI] [PMC free article] [PubMed] [Google Scholar]
- 9.Wang H., et al. ; GBD 2019 Demographics Collaborators, Global age-sex-specific fertility, mortality, healthy life expectancy (HALE), and population estimates in 204 countries and territories, 1950-2019: A comprehensive demographic analysis for the Global Burden of Disease Study 2019. Lancet 396, 1160–1203 (2020). [DOI] [PMC free article] [PubMed] [Google Scholar]
- 10.Head A., et al. , Inequalities in incident and prevalent multimorbidity in England, 2004–19: A population-based, descriptive study. Lancet Healthy Longevity 2, E489–E497 (2021). [DOI] [PubMed] [Google Scholar]
- 11.Institute for Health Metrics and Evaluation. GBD Results Tool. Global Health Data Exchange. http://ghdx.healthdata.org/gbd-results-tool. Accessed 19 April 2021.
Associated Data
This section collects any data citations, data availability statements, or supplementary materials included in this article.
Data Availability Statement
Data used in this study can be easily downloaded at Global Health Data Exchange, http://ghdx.healthdata.org/gbd-results-tool (11).


