Significance
Studies have shown that long-term damages from unmitigated climate change are greater than the mitigation costs worldwide, but costs greatly exceed climate benefits in the near term, undermining action now. Emissions reductions affect more than just climate, however. We show that near-term US benefits of decarbonization are dominated by improved air quality for human health, labor productivity, and agriculture whereas climate-related benefits are realized largely after 2050. Additionally, using recent health research, we show that health benefits of both clean air and reduced climate change are far larger than previously estimated. Considering these additional benefits of emissions reductions, benefits outweigh costs even in the near term. Near-term benefits stem primarily from US actions, whereas long-term climate-related benefits require global cooperation.
Keywords: climate change, air pollution, decarbonization, health impacts, labor impacts
Abstract
Societal benefits from climate change mitigation accrue via multiple pathways. We examine the US impacts of emission changes on several factors that are affected by both climate and air quality responses. Nationwide benefits through midcentury stem primarily from air quality improvements, which are realized rapidly, and include human health, labor productivity, and crop yield benefits. Benefits from reduced heat exposure become large around 2060, thereafter often dominating over those from improved air quality. Monetized benefits are in the tens of trillions of dollars for avoided deaths and tens of billions for labor productivity and crop yield increases and reduced hospital expenditures. Total monetized benefits this century are dominated by health and are much larger than in previous analyses due to improved understanding of the human health impacts of exposure to both heat and air pollution. Benefit–cost ratios are therefore much larger than in prior studies, especially those that neglected clean air benefits. Specifically, benefits from clean air exceed costs in the first decade, whereas benefits from climate alone exceed costs in the latter half of the century. Furthermore, monetized US benefits largely stem from US emissions reductions. Increased emphasis on the localized, near-term air quality–related impacts would better align policies with societal benefits and, by reducing the mismatch between perception of climate as a risk distant in space and time and the need for rapid action to mitigate long-term climate change, might help increase acceptance of mitigation policies.
Climate change mitigation involves a global transition to low carbon energy, energy efficiency, low demand for carbon-intensive goods and services, and a reduction in emissions of non-CO2 climate-altering pollutants. It is useful to see the effects of this type of worldwide, all-sector transition, as assessed for climate (1). However, mitigation of climate change is intertwined with other sustainable development goals, and it has been argued that it is more useful to evaluate the impacts on society such as health and food security regardless of the physical pathway by which they occur (e.g., refs. 2 and 3). We therefore analyze the effects of this transition on human health, labor productivity, and crop productivity in the United States due to multiple quantifiable pathways related to climate and air pollution, as decarbonization policies affect the emissions driving both of these environmental conditions. The relative impact of these factors varies by region and through time, and hence an analysis of the impacts of policies on climate or air quality alone provides an incomplete picture of the total effect on human welfare. This is especially important given that although policies to mitigate climate change need to be implemented rapidly to meet internationally agreed upon targets (4), even aggressive action yields only modest benefits for society via reduced climate-related damages through midcentury. Our study provides analysis of several impacts that have a strong evidence base and occur via multiple pathways, localizes those impacts to the state level as well as nationwide, and quantifies the relative roles of US and global actions. This work is based upon extensive modeling of the physical response to a diverse set of socioeconomic scenarios followed by analysis of the societal impacts of those physical responses.
For the global transitions, future emissions come from nine scenarios based on the Shared Socio-economic Pathways (SSPs) used in the Coupled Model Intercomparison Project phase 6 (CMIP6) simulations. The five SSPs characterize a wide range of potential future developments in factors such as population, wealth, technology, education, and sustainability preferences (5). Scenarios are characterized by radiative forcing targets for 2100, with the most aggressive mitigation reaching 2.6 or 1.9 W m−2, values consistent with global mean surface temperature increases of ∼2 °C or 1.5 °C, respectively, relative to preindustrial. We refer to these hereafter as SSPN_F, with N indicating the SSP number and F the forcing target (see also SI Appendix). We treat the scenarios with the highest targets (SSP3_70 and SSP5_85) as reference cases.
We complement those simulations with three energy sector scenarios created for this study: 1) decarbonization of the energy sector worldwide, 2) decarbonization of the energy sector in the United States, and 3) a current path reference case (SI Appendix). Comparison reveals how much of a given impact is under national control.
Air Pollution and Climate Change Results
Under aggressive US climate change mitigation policies, emissions of aerosol or ozone precursors such as NOx and SO2 decrease rapidly whereas they decrease only modestly or increase under reference scenarios (SI Appendix). For example, US NOx emissions decrease 42 and 56% by 2030 in 2 °C and 1.5 °C scenarios, respectively. Surface ozone and particulate responses are essentially synchronous with those changes. In contrast, due to CO2’s long atmospheric residence time, even the most ambitious scenarios do not show decreases in CO2 concentrations over the next 50 y despite large cuts in worldwide emissions (SI Appendix).
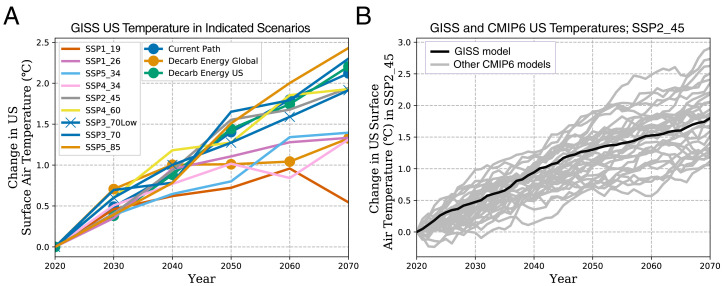
As a result, US surface temperatures continue to rise, with increases that are generally proportional to the intended SSP radiative forcing (Fig. 1; reference SI Appendix for global results). Decarbonization of the US energy sector alone does not have a statistically significant impact on surface temperatures at any time during our simulation (uncertainties in the Goddard Institute for Space Studies [GISS] model projected US decadal mean values are ∼0.4 °C [95% CI]). This is not surprising given that those simulations examined the effects of mitigation in a single sector within a single nation, albeit one with a large economy, and that we only explored the response over the next 50 y whereas the total climate impact would be larger further into the future.
Fig. 1.
US mean annual average surface air temperature change relative to the 2020 value in the NASA GISS climate model in the indicated SSP and energy-sector decarbonization scenarios (A) and under the midrange SSP2_45 in the GISS model used in this study (ensemble mean of five members) and in all available CMIP6 climate models (B). Values are decadal (A) or 10-y running (B) means. Decarb is short for decarbonization.
Differences in US temperatures between most global mitigation and reference scenarios only become significant around 2060 (Fig. 1A) (∼2050 at the global level; SI Appendix). The slow emergence of a climate-related signal is not unique to our model, which shows a faster than average warming across the CMIP6 models over the next 10 to 30 y and warming near the multimodel mean in the latter half of the century. The fastest warming CMIP6 model reaches US-average warming equal to GISS 2060 values in 2043. This suggests that despite uncertainties in transient climate response, impacts of changes in heat exposure due to climate change mitigation have a minimal chance of emerging prior to 2040 (as high sensitivity would be systematic across scenarios). This finding is consistent with past analyses showing little temperature divergence across scenarios in the first few decades after policies are implemented, even for policies with markedly different longer-term warming (6, 7).
In marked contrast to surface temperatures, changes in air pollutants show statistically significant changes in most simulations in 2030, the first decadal mean analyzed after the scenarios diverge in 2020. Both the relatively slow climate response and the rapid air pollution response are consistent with basic understanding of the comparatively long timescales for atmospheric CO2 and ocean warming relative to the short atmospheric residence time for particulates and tropospheric ozone. Concentrations of air pollutants are affected by climate change as well as emissions changes. While these effects are included in our modeling, we do not have simulations that isolate their impacts. However, prior studies have found that the effects of climate change on both ozone and fine particulate matter (PM2.5) are typically small in comparison with the effects of emissions changes (8, 9).
Health, Labor, and Crop Impacts
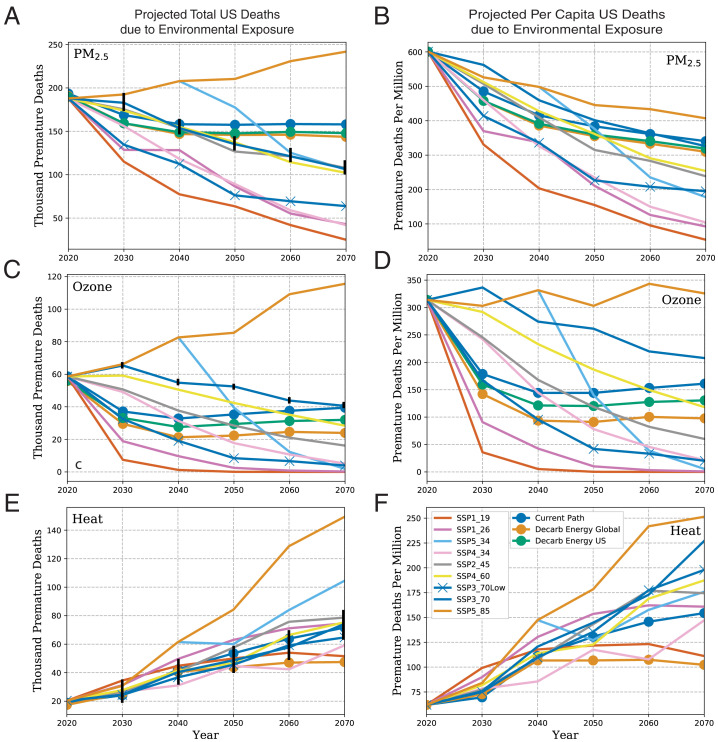
To explore the human health consequences of these physical changes, we first examine the evolution of national totals over the next 50 y, looking at the impacts on premature deaths of improved air quality, of reduced climate change, and subsequently of both together. In all scenarios except SSP5_85, US premature deaths due to air pollution decrease whereas those due to heat exposure increase (Fig. 2). The high emission reference SSP5_85 shows steady increases in total premature deaths due to both causes. Health benefits of climate change mitigation via improved air quality occur immediately following emissions reductions and hence are large by 2030 under mitigation scenarios such as SSP1_19, SSP1_26, SSP2_45, and SSP4_34. In contrast, the health benefits due to reduced heat exposure relative to the SSP3_70 reference case in those scenarios only become discernable in the latter half of the century. Across the scenarios, air pollution–related deaths follow national NOx emissions in all cases, whereas heat-related deaths are roughly proportional to global CO2 concentrations (SI Appendix) and therefore for most scenarios scale according to their long-term forcing targets. Consistent with this behavior, the overshoot scenario SSP5_34 leads to millions of additional premature deaths due to air pollution (and hundreds of thousands of additional deaths due to heat exposure) relative to a scenario with a similar climate target but without overshoot (e.g., SSP4_34). Likewise, the SSP3_70Low scenario, with air pollution controls and methane reductions but without CO2 mitigation, greatly reduces air pollution–related premature deaths relative to SSP3_70 but does little to reduce health effects of heat exposure (SI Appendix). US action alone provides ∼79% of the health benefits from air pollution relative to worldwide action over the next decade and ∼60 to 65% over the entire 50-y period analyzed.
Fig. 2.
Annual premature deaths in the United States due to PM2.5 (A and B), ozone (C and D), and heat (E and F) in the indicated SSP and energy-sector decarbonization scenarios as totals (Left column) and per million persons (Right column). Values for premature deaths due to heat exposure in the decarbonization of the US energy sector simulation are not shown as these are indistinguishable from the reference case (Current Path). CI (95%) based on internal variability in our model are shown as vertical bars for the SSP3_70 scenario totals to illustrate when scenarios are distinct (overall uncertainty, including exposure-response functions, is much larger but that additional uncertainty is systematic). Uncertainty in physical modeling would add an additional contribution of ∼25% for air pollution and ∼38% for heat to the range of projected changes.
Comparing the premature deaths attributable to different exposures, PM2.5 has ∼3× more impact than ozone and nearly 10× more impact than heat in 2020. Under both the 1.5 °C and 2 °C pathways (SSP1_19 and SSP1_26), exposure to heat becomes the largest impact by 2060 and by 2070 causes roughly double the number of premature deaths as air pollution. In contrast, scenarios with weak mitigation targets show much less improvement in air quality and hence despite greater heat exposure the effects of air pollution remain as much as 2 to 3× those due to heat exposure in 2070. In all cases, the influence of heat exposure relative to air pollution exposure increases dramatically over that seen today.
These total US premature deaths include changes in population and urbanization as well as changes in environmental exposures. US population nearly doubles by 2070 under SSP5, increases nearly 50% under SSP1 and SSP2, increases ∼20% under SSP4, and decreases by ∼5% under SSP3. Combined with an increase in the urban share of population from 85% in 2020 to 94% in 2070, population growth leads to increases in health impacts in some scenarios despite improvements in air quality. In particular, the increase in PM2.5-related premature deaths under SSP5_85 is primarily attributable to the large increase of population that overwhelms the relatively weak reductions in PM2.5 (Fig. 2). In contrast, the strongest decreases in total air pollution–related premature deaths under the aggressive 1.5 °C and 2 °C scenarios (SSP1_19 and SSP1_26) occur despite increases in US population in that SSP and so are even larger when viewed in per capita terms.
To put our results into context, we compared GISS results for PM2.5 and ozone change with those from other CMIP6 models (10) (SI Appendix). That analysis suggests that 25% is a reasonable estimate of physical uncertainty in national-level pollutant projections, a range comparable to the uncertainty stemming from the exposure-response functions [∼16% for PM2.5 (11); ∼33% for ozone (12)].
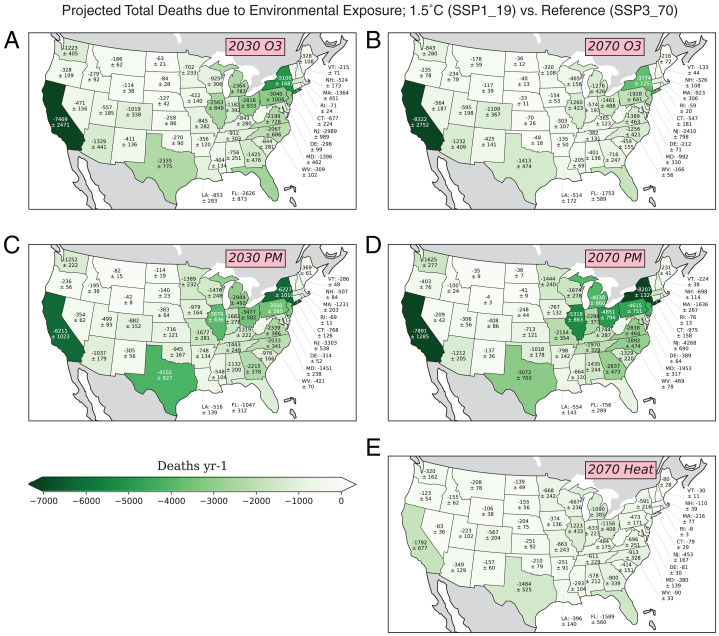
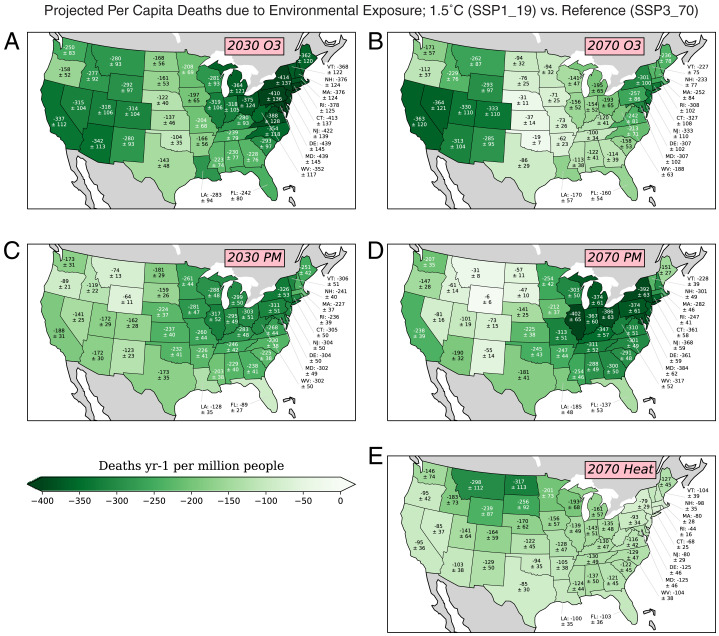
So far, we have examined aggregate, country-level impacts of climate change mitigation on premature deaths via air pollution and heat exposure, but these impacts have distinct spatial as well as temporal signatures. In contrast to the transient changes shown previously, we now illustrate these geographic distributions by focusing on a comparison between the 1.5 °C (SSP1_19) and lower reference case (SSP3_70). We examine both 2030 and 2070 to highlight rapid and slow responses. For air pollution, avoided premature deaths due to reduced PM2.5 and ozone exposure in 2030 under the 1.5 °C scenario are concentrated in California, Texas, and the Ohio River Valley to New York (Fig. 3). On a per capita basis, rapid benefits from ozone reduction are largest in a wide area of the upper Midwest through the Northeast and extending down to the Carolinas, with another regional maximum in California and the Southwest (Fig. 4A). Per capita benefits from reduced PM2.5 exposure are largest in the upper Midwest and the Northeast (Fig. 4C). Ozone benefits shift slightly across regions by 2070, with larger values in the West and smaller values in the Northeast, and decrease overall due to the decline in the reference scenario. This behavior is a function of the relatively high minimum exposure threshold for ozone impacts, resulting in 21 states having zero premature deaths remaining by 2030 under the 1.5 °C scenario and hence no possibility of additional decreases in later decades. Benefits associated with PM have similar patterns in 2070 and 2030 but larger values in 2070 since, with a very low minimum exposure threshold, they continue to decline over time in both mitigation and reference scenarios, but more quickly in the former.
Fig. 3.
Total state-level premature deaths in the 1.5 °C–consistent (SSP1_19), relative to the lower reference (SSP3_70), scenario for the indicated years due to ozone (A and B), PM2.5 (C and D), and heat (E). Uncertainties are based upon internal variability in our model and the characterization of the exposure-response function (Figs. 3, 4, and 6). Negative values mean fewer deaths in the 1.5 °C–consistent scenario.
Fig. 4.
As in Fig. 3 but showing per capita premature deaths due to ozone (A and B), PM2.5 (C and D), and heat (E). Negative values mean fewer deaths in the 1.5 °C–consistent scenario.
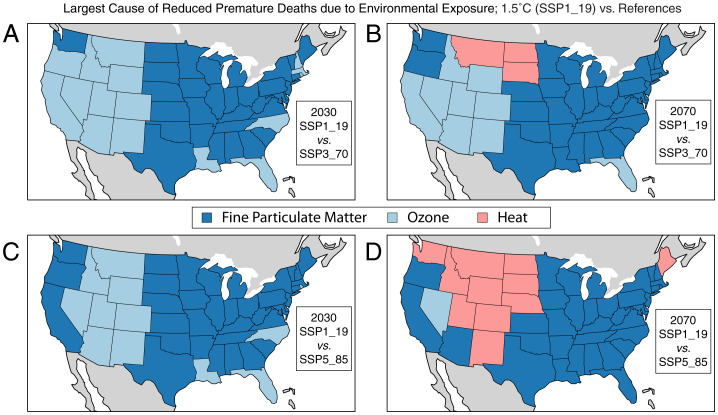
Although avoided premature deaths due to reduced air pollution are realized rapidly (Fig. 3), avoided premature deaths due to reduced heat exposure are not significant in 2030. They become significant by 2070, with the largest totals in California, Texas, Florida, and the upper Midwest (Fig. 3E). In general, per capita benefits of reduced heat exposure tend to be largest from the Pacific Northwest across to the upper Midwest and so have a markedly different pattern than benefits of reduced air pollution exposure that tend to maximize in the Southwest and in the lower Midwest through the Northeast (Fig. 4). Spatial patterns for other scenarios are fairly similar. At the national level, the reduction in premature deaths under 1.5 °C relative to the SSP3_70 reference in 2070 due to decreased heat exposure (∼23,000 y−1) is much smaller than that due to either ozone (∼41,000 y−1) or PM2.5 (∼81,000 y−1) exposures. However, the effects of heat changes in some states in the northern Mountains/Plains are larger than those of air pollution (Fig. 5). The area over which benefits of reduced heat under 1.5 °C exceed those from either ozone or PM2.5 by 2070 expands to cover much of the Mountain West and Pacific Northwest as well as Maine (Fig. 5D) when comparing with the much warmer SSP5_85 reference case owing to the high sensitivity of Americans living in cool climates to heat exposure (13, 14).
Fig. 5.
State-level indication of largest cause of avoided premature deaths in the 1.5 °C–consistent (SSP1_19), relative to the lower reference (SSP3_70), scenario (A and B) and relative to the higher reference (SSP5_85) scenario (C and D) for the indicated years in which blue colors indicate avoided premature deaths from air pollution (ozone in light blue and PM2.5 in dark blue) and light red indicates avoided premature deaths from heat.
These state-level impacts projected by the GISS model are highly statistically significant as we use multiyear averages and ensembles of simulations (Figs. 3 and 4). However, comparisons with results from other CMIP6 models suggest that there is substantial additional uncertainty associated with the projection of the physical processes at regional scales, especially for heat exposure (SI Appendix). Our primary conclusions about the relative magnitude and temporal development of heat-related versus air pollution–related impacts appear robust to uncertainties in environmental modeling but state-specific values would have larger uncertainty ranges than those evaluated for our model alone (Figs. 3 and 4) including those additional uncertainties.
Turning from mortality to morbidity impacts, PM2.5-related morbidity burdens tend to follow those for PM2.5-related mortality across the scenarios and across space and time (SI Appendix). We again illustrate impacts of climate change mitigation by comparing 1.5 °C with the SSP3_70 reference. Over the next 50 y, national cumulative total benefits include 650,000 fewer cardiovascular and 540,000 fewer respiratory hospitalizations, 750,000 fewer asthma emergency room visits, 70,000 fewer child and 18,000 fewer adult asthma hospitalizations, 2.4 million fewer cases of acute child bronchitis, and 2.2 million fewer onsets of dementia.
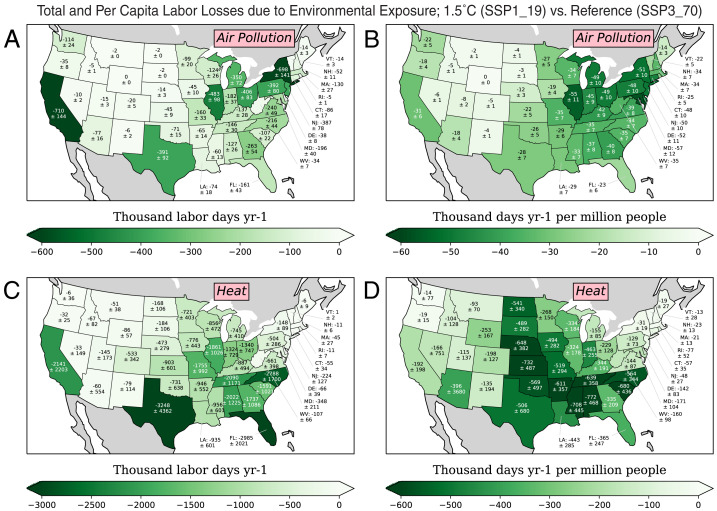
Labor losses due to air pollution and heat also generally follow the premature mortalities attributable to those two factors over time and across scenarios but have distinct spatial patterns. Examining impacts in 2070, the benefits from reduced air pollution are greatest in California, the Northeast, and the Ohio River Valley, where particulate-related emissions are currently high and population is dense (Fig. 6). In contrast, the benefits of reduced heat, which have clearly emerged by 2070, are greatest in the South and the Plains states, especially on a per capita basis. This is due to the greater fraction of employment in jobs strongly affected by heat such as agriculture and construction and to occurrence of heat-related labor losses past a threshold temperature that makes warmer states more susceptible to additional warming (15). In comparison with mortality spatial patterns (Figs. 3 and 4), PM2.5 impacts on labor are very similar to PM2.5-induced premature deaths, whereas heat impacts on labor show a markedly different pattern to heat-related deaths. This distinction reflects acclimatization to heat exposures in the general population that causes those in warmer climates to be less sensitive, especially to heat extremes, than those in cooler regions (16). Note that the threshold for the onset of heat effects on labor makes those impacts highly sensitive to uncertainties in temperature projections. Based on comparison with other CMIP6 models (SI Appendix) and analysis of an alternative methodology (17), the labor benefits from reduced heat exposure seen in our analysis are likely to be conservative.
Fig. 6.
Total (A and C) and per capita (B and D) avoided labor losses due to exposure to air pollution (A and B) and heat (C and D) in the 1.5 °C–consistent scenario SSP1_19 relative to the reference case SSP3_70 for 2070. Negative values mean reduced labor losses in the 1.5 °C–consistent scenario.
Agricultural impacts exhibit distinct spatial patterns and unique temporal responses to air pollution and climate change (temperature, precipitation, and CO2) relative to other impacts. Ozone decreases under ambitious climate change mitigation scenarios increase yields over all timescales, with the bulk of these increases occurring within the first decade (SI Appendix). Climate change mitigation leads to modest yield decreases (from CO2 reductions) through 2040, but these are smaller than the benefits from reduced ozone. From midcentury onward, the net impact of avoided “climate change” shifts to benefits. For all analyzed health, labor, and crop impacts, air quality changes dominate over the coming decades whereas climate impacts become comparable in magnitude around the 2060s.
Valuation Results
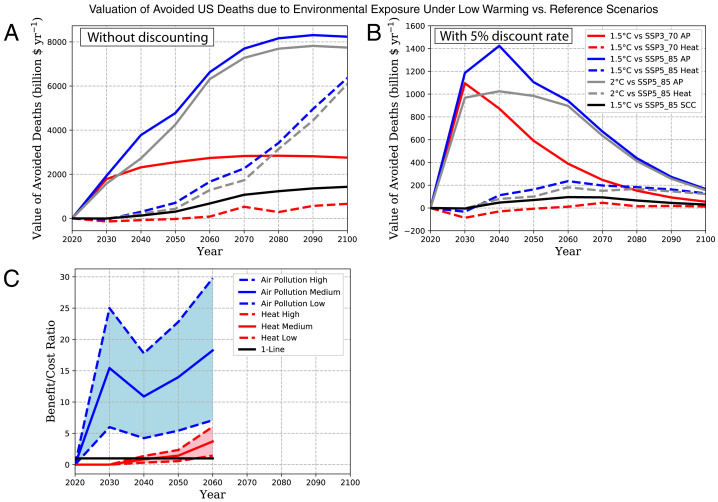
We evaluated multiple benefits associated with climate change mitigation (Figs. 3–6), but reduced risk of premature death dominates our economic valuation of benefits of climate change mitigation, providing ∼99% of the total (SI Appendix). This mortality valuation is in turn dominated by air quality–related effects (Fig. 7). Over the rest of the century, the value of US public health benefits from following a 2 °C (SSP1_26) scenario relative to the lower (SSP3_70) and higher (SSP5_85) reference cases are $56 and $163 trillion, respectively, with 2.5% discounting. Approximately 80% of these benefits occur via improved air quality, with the remainder due to reduced heat exposure. Over the 2020 to 2050 period, the comparable values are $24 and $39 trillion, virtually all from improved air quality.
Fig. 7.
Valuation of avoided US premature deaths attributable to air pollution and heat exposure under the 1.5 °C (SSP1_19) and 2 °C (SSP1_26) scenarios relative to the lower (SSP3_70) and higher (SSP5_85) reference cases evaluated both without discounting future impacts (A) and with a 5% discount rate (B). Benefit/cost ratios for 2 °C (SSP1_26) relative to the higher (SSP5_85) reference case over the next several decades using costs from Williams et al. (23) as “High,” Markanya et al. (22) as “Low,” and McCollum et al. (24) as “Medium” (C). Lines labeled “AP” are impacts due to air pollution and valuation using a standard social cost of carbon approach is labeled SCC. The valuation analysis extends to 2100 to include long-term impacts of heat (SI Appendix).
Valuations of heat-related and air pollution–related avoided premature deaths become comparable in 1.5° or 2 °C scenarios in comparison with the high reference case (SSP5_85) by 2100, though air quality improvements are responsible for >90% of avoided premature deaths through midcentury. Air pollution–related impacts account for ∼73% of the total valuation over the century with no discounting and an even larger 85% share with 5% discounting of future damages given their more rapid onset. Valuation relative to the lower SSP3_70 reference case is much less over long timescales, and heat-related impacts do not reach levels comparable to air pollution by 2100 so that air quality improvements dominate even more than in comparison with the higher SSP5_85 reference. Climate change will affect population health via additional pathways, including severe storms, wildfires, and disease vectors [though heat exposure is projected to have the largest impact in the near future (18)] and will also affect society via sea-level rise, droughts, etc. Given our limited leverage on climate change over the next several decades via decarbonization, however, our finding that air pollution–related responses dominate valuation through midcentury would hold even with a fuller accounting of climate-related responses to mitigation policies.
To compare with prior estimates of climate damages, we examine the impacts of climate change alone, focusing on comparison of the 2 °C (SSP1_26) scenario relative to the higher (SSP5_85) reference case. Undiscounted avoided losses are ∼$400 billion per year in 2050 and ∼$6 trillion per year in 2100. We also use a social cost of carbon (SCC) framework to evaluate climate-related damages, finding avoided losses of $300 billion in 2050 and $1.4 trillion for 2100 (Fig. 7). Those SCC-based values are similar to prior literature that reported climate-related avoided damages of ∼$150 to 350 billion per year in 2050 and ∼$1 to 4 trillion in 2100 (19–21), and both are smaller than our valuation of heat-related deaths alone.
Our estimates of heat-related and air pollution–related deaths are both larger than in prior studies, primarily due to our use of updated and expanded exposure-response functions (SI Appendix), leading to larger valuations. As there is a solid evidence base for our increased valuations, we now compare benefits with mitigation costs (22–24). The latter are often evaluated over 2020 to 2050, the timeframe for approaching economy-wide net zero CO2 emissions in low warming scenarios (4). We find that the climate benefits (i.e., associated with heat) alone are less than mitigation costs over the next two decades, reaching parity with mitigation costs around 2040 to 2055 (Fig. 7C). In the longer term, those benefits clearly outweigh costs, in line with much documentation that the costs of inaction would eventually be higher than the costs of action (e.g., ref. 25). The inclusion of air pollution, however, changes this evaluation dramatically relative to analyses including climate damages only (19–21). With this broader valuation, benefits greatly outweigh costs immediately with a benefit/cost ratio of 5 to 25 in 2030 under a 2 °C scenario that remains fairly stable through midcentury (Fig. 7C). Hence, including our broad analysis of societal well-being, benefits outweigh costs even during the critical 2020 to 2050 period when the energy transformation is projected to require substantial additional spending as a primary part of the transition to a sustainable, low warming society (ref. 4 and reference SI Appendix).
Discussion
Our results provide a multifaceted analysis of the societal impacts of climate change mitigation, including both impacts directly related to avoided climate change as well as those related to air quality. They show that broad societal action now to limit climate change in the future means benefits now and that those benefits would largely stem from US actions, even if those benefits are mostly not from avoided climate change itself. We find that over the next 50 y, keeping to the 2 °C pathway instead of the lower reference case (SSP3_70) in which climate change is left largely unmitigated would prevent roughly 4.5 million premature deaths, about 1.4 million hospitalizations and emergency room visits, ∼300 million lost workdays, about 1.7 million incidences of dementia, and about 440 million tons of crop losses in the United States. As part of these longer-term benefits, roughly 1.4 million lives could be saved from improved air quality during the next 20 y. Benefits would be larger in comparison with the higher reference case (SSP5_85) or for the 1.5 °C pathway. A rapid shift to a 2 °C pathway could reduce the toll of air pollution, which using updated epidemiology we estimate currently leads to nearly 250,000 premature deaths per year in the United States, by 40% in just a decade. Monetized benefits are in the tens of trillions of dollars for avoided premature deaths and tens to hundreds of billions for labor productivity, crop yield increases, and reduced medical expenditures. Benefits related to air pollution are statistically significant down to the state level in the first decade of mitigation scenarios whereas climate-related benefits become significant much later.
Our study provides a more comprehensive evaluation of social costs than narrower climate-focused estimates, with important implications. For instance, under Executive Order 13783, the Trump Administration altered the US government’s methodology for evaluating climate damages (the social cost of carbon) to value only benefits occurring within the borders of the United States and replacing a low discount rate with a high value typical of conventional business decisions. Since the SCC includes only climate-related impacts and these are spatially diffuse and slow to manifest, these two changes reduced the SCC by factors of ∼7 and ∼6, respectively (GAO-20-254). In contrast, our broader valuation is less sensitive to either of these methodological changes and would decrease by factors of ∼2 and ∼4, respectively. Therefore, our analysis not only provides a more complete value of societal impacts but is also more robust to subjective choices (though it is clearly still sensitive to the choice of discount rate in particular).
Quantification of the near-term benefits to society may be helpful in overcoming the widespread perception of climate change as a nonurgent and distant risk by highlighting both what can be gained from immediate action (26) and the local benefits that citizens find compelling (27). Our state-level results are therefore publicly available at: http://shindellgroup.rc.duke.edu/apps/decarb/ and several are described in Congressional reports (e.g., ref. 28). Framing decarbonization as a way to improve public health and the economy as well as mitigating climate change may therefore be more persuasive (26, 27), and this broader analysis provides more complete and robust cost/benefit estimates.
Materials and Methods
Simulations are performed using the version of NASA’s global composition-climate model developed at the GISS, GISS-E2.1-G (29), used in the current CMIP6 (SI Appendix). Exposure to air pollution is clearly linked to increased risk of heart disease, stroke, chronic obstructive pulmonary disease, lower respiratory infection, lung cancer, pneumonia, and diabetes, all of which can lead to premature death. Heat exposure is linked to premature deaths via heat exhaustion, hyperthermia, worsening of chronic conditions, and heatstroke. Health impact analyses use up-to-date epidemiological relationships based on decades of public health data. The analysis of the impacts of PM2.5 exposure on premature death is based upon the results of a meta-analysis including 41 cohort studies from around the world, including the United States (11). That study reported impacts ∼120% larger than those found with widely used older risk functions produced by the same researchers, consistent with high impacts reported based on another recent meta-analysis (30, 31). The impacts of ozone exposure on premature death are based upon the responses reported in one of the largest studies to date that uses the American Cancer Society Cancer Prevention Study-II cohort (12). As with PM, ozone impacts evaluated using this newer risk function are several times large than those obtained using older functions (32). The impacts of heat exposure are based on a study evaluating risk across the full area of the contiguous United States (13), which again produces larger values than prior analyses based on response over a subset of cities for which data were available (e.g., ref. 33). Morbidity impacts of PM2.5 are based on a systematic review and meta-analysis of literature (34, 35). Impacts on labor are evaluated based on both exposure to air pollution and heat (15, 34, 36), the latter for specific professions where heat exposure is both difficult to avoid and impactful. Agricultural impacts include responses to temperature and precipitation and to changes in CO2 and surface ozone (37). The analysis includes projected changes in population, baseline health, and gross domestic product but does not include changes in the workforce or cultivated areas (SI Appendix). Air pollution impacts are quantified over the contiguous United States through 2070 on a grid of ∼50 × 50 km, a fine enough resolution to capture urban exposures (38). Finally, all impacts are monetized (SI Appendix). Additional climate impacts that are not quantified here include flooding, droughts, and fires, but the valuation of health impacts is likely to dominate over other climate-related impacts (21).
Acknowledgments
We thank Steven Turnock for CMIP6 surface PM data and the NASA High-End Computing Program through the NASA Center for Climate Simulation at Goddard Space Flight Center and the Duke Compute Cluster for computational resources. We acknowledge the World Climate Research Program for coordinating and promoting CMIP6, the climate modeling groups for producing and making available their model output, the Earth System Grid Federation (ESGF) for archiving the data and providing access, and the multiple funding agencies who support CMIP6 and ESGF. Funding was provided by NASA Cooperative Agreement 80NSSC19M0138 and UCAR SUBAWD001356.
Footnotes
Author contributions: D.S. designed research; D.S., M.R., Y.Z., K.S., G.F., L.N., and L.P. performed research; A.C. contributed new analytic tools; D.S., L.Y., and A.G. analyzed data; and D.S., G.A.S., and L.P. wrote the paper.
The authors declare no competing interest.
This article is a PNAS Direct Submission. S.I.S. is a guest editor invited by the Editorial Board.
2Present address: Earth Institute, Columbia University, New York, NY 10025.
This article contains supporting information online at https://www.pnas.org/lookup/suppl/doi:10.1073/pnas.2104061118/-/DCSupplemental.
Data Availability
The GISS model is available at https://www.giss.nasa.gov/tools/modelE/. CMIP6 simulations from GISS and other groups are available at the Earth System Grid Federation; https://esgf-node.llnl.gov/projects/esgf-llnl/. Impact data are available at: http://shindellgroup.rc.duke.edu/apps/decarb/.
References
- 1.Hoegh-Guldberg O., et al., The human imperative of stabilizing global climate change at 1.5 ºC. Science 365, eaaw6974 (2019). [DOI] [PubMed] [Google Scholar]
- 2.Tollefsen P., Rypdal K., Torvanger A., Rive N., Air pollution policies in Europe: Efficiency gains from integrating climate effects with damage costs to health and crops. Environ. Sci. Policy 12, 870–881 (2009). [Google Scholar]
- 3.Shindell D. T., Fuglestvedt J. S., Collins W. J., The social cost of methane: Theory and applications. Faraday Discuss. 200, 429–451 (2017). [DOI] [PubMed] [Google Scholar]
- 4.Rogelj J., et al., Global Warming of 1.5°C. An IPCC Special Report on the Impacts of Global Warming of 1.5°C Above Pre-industrial Levels and Related Global Greenhouse Gas Emission Pathways, in the Context of Strengthening the Global Response to the Threat of Climate Change, Sustainable Development, and Efforts to Eradicate Poverty, Masson-Delmotte V., et al., Eds. (Cambridge University Press, Cambridge, UK, 2018). [Google Scholar]
- 5.Riahi K., et al., The shared socioeconomic pathways and their energy, land use, and greenhouse gas emissions implications: An overview. Glob. Environ. Change 42, 153–168 (2017). [Google Scholar]
- 6.Kirtman B., et al., Climate Change 2013: The Physical Science Basis. Contribution of Working Group I to the Fifth Assessment Report of the Intergovernmental Panel on Climate Change, Stocker T. F., et al., Eds. (Cambridge University Press, Cambridge, UK and New York, NY, 2013). [Google Scholar]
- 7.Lehner F., et al., Partitioning climate projection uncertainty with multiple large ensembles and CMIP5/6. Earth Syst. Dyn. 11, 491–508 (2020). [Google Scholar]
- 8.Silva R. A., et al., The effect of future ambient air pollution on human premature mortality to 2100 using output from the ACCMIP model ensemble. Atmos. Chem. Phys. 16, 9847–9862 (2016). [DOI] [PMC free article] [PubMed] [Google Scholar]
- 9.Silva R. A., et al., Future global mortality from changes in air pollution attributable to climate change. Nat. Clim. Change 7, 647–651 (2017). [DOI] [PMC free article] [PubMed] [Google Scholar]
- 10.Turnock S. T., et al., Historical and future changes in air pollutants from CMIP6 models. Atmos. Chem. Phys. 20, 14547–14579 (2020). [Google Scholar]
- 11.Burnett R., et al., Global estimates of mortality associated with long-term exposure to outdoor fine particulate matter. Proc. Natl. Acad. Sci. U.S.A. 115, 9592–9597 (2018). [DOI] [PMC free article] [PubMed] [Google Scholar]
- 12.Turner M. C., et al., Long-term ozone exposure and mortality in a large prospective study. Am. J. Respir. Crit. Care Med. 193, 1134–1142 (2016). [DOI] [PMC free article] [PubMed] [Google Scholar]
- 13.Shindell D., et al., The effects of heat exposure on human mortality throughout the United States. Geohealth 4, GH000234 (2020). [DOI] [PMC free article] [PubMed] [Google Scholar]
- 14.Weinberger K. R., et al., Projected temperature-related deaths in ten large U.S. metropolitan areas under different climate change scenarios. Environ. Int. 107, 196–204 (2017). [DOI] [PMC free article] [PubMed] [Google Scholar]
- 15.Zivin J. G., Neidell M., Temperature and the allocation of time: Implications for climate change. J. Labor Econ. 32, 1–26 (2014). [Google Scholar]
- 16.Curriero F. C., et al., Temperature and mortality in 11 cities of the eastern United States. Am. J. Epidemiol. 155, 80–87 (2002). [DOI] [PubMed] [Google Scholar]
- 17.Zhang Y., Shindell D., Costs from labor losses due to extreme heat in the United States attributable to climate change. Clim. Change 164, 35 (2021). [Google Scholar]
- 18.World Health Organization,Quantitative Risk Assessment of the Effects of Climate Change on Selected Causes of Death, 2030s and 2050s, Hales S., Kovats S., Lloyd S., Campbell-Lendrum D., Eds. (World Health Organization, 2014). [Google Scholar]
- 19.Hoegh-Guldberg O., et al., Global Warming of 1.5°C. An IPCC Special Report on the Impacts of Global Warming of 1.5°C Above Pre-industrial Levels and Related Global Greenhouse Gas Emission Pathways, in the Context of Strengthening the Global Response to the Threat of Climate Change, Sustainable Development, and Efforts to Eradicate Poverty, Masson-Delmotte P. Z. V., et al., Eds. (Cambridge University Press, Cambridge, UK, 2018). [Google Scholar]
- 20.Yohe G. W., Characterizing transient temperature trajectories for assessing the value of achieving alternative temperature targets. Clim. Change 145, 469–479 (2017). [Google Scholar]
- 21.Hsiang S., et al., Estimating economic damage from climate change in the United States. Science 356, 1362–1369 (2017). [DOI] [PubMed] [Google Scholar]
- 22.Markandya A., et al., Health co-benefits from air pollution and mitigation costs of the Paris Agreement: A modelling study. Lancet Planet. Health 2, e126–e133 (2018). [DOI] [PubMed] [Google Scholar]
- 23.Williams J. H., et al., Carbon‐neutral pathways for the United States. AGU Advances 2, e2020AV000284 (2021). [Google Scholar]
- 24.McCollum D. L., et al., Energy investment needs for fulfilling the Paris Agreement and achieving the sustainable development goals. Nat. Energy 3, 589–599 (2018). [Google Scholar]
- 25.Stern N., Stern Review on the Economics of Climate Change (UK Treasury, London, 2006). [Google Scholar]
- 26.van der Linden S., Maibach E., Leiserowitz A., Improving public engagement with climate change: Five “best practice” insights from psychological science. Perspect. Psychol. Sci. 10, 758–763 (2015). [DOI] [PubMed] [Google Scholar]
- 27.Scannell L., Gifford R., Personally relevant climate change: The role of place attachment and local versus global message framing in engagement. Environ. Behav. 45, 60–85 (2013). [Google Scholar]
- 28.“Health Benefits for the State of New York if the United States meets the Goals of the Paris Agreement,” Committee on Oversight and Reform and Subcommittee on Environment, U. S. House of Representatives, https://maloney.house.gov/sites/maloney.house.gov/files/NY%20State%20Climate%20Report.pdf (September 2020).
- 29.Kelley M., et al., GISS-E2.1: Configurations and climatology. J. Adv. Model. Earth Syst. 12, MS002025 (2020). [DOI] [PMC free article] [PubMed] [Google Scholar]
- 30.Vodonos A., Awad Y. A., Schwartz J., The concentration-response between long-term PM2.5 exposure and mortality; A meta-regression approach. Environ. Res. 166, 677–689 (2018). [DOI] [PubMed] [Google Scholar]
- 31.Vohra K., et al., Global mortality from outdoor fine particle pollution generated by fossil fuel combustion: Results from GEOS-Chem. Environ. Res. 195, 110754 (2021). [DOI] [PubMed] [Google Scholar]
- 32.Seltzer K. M., Shindell D. T., Malley C. S., Measurement-based assessment of health burdens from long-term ozone exposure in the United States, Europe, and China. Environ. Res. Lett. 13, 104018 (2018). [Google Scholar]
- 33.“Multi-model Framework for Quantitative Sectoral Impacts Analysis: A Technical Report for the Fourth National Climate Assessment” (U.S. Environmental Protection Agency, Washington, D.C. 2017).
- 34.Ru M., “Pollution, health and the economy: Understanding and modeling their interaction,” PhD thesis, Earth and Ocean Sciences Division, Nicholas School of the Environment, Duke University, Durham, NC (2020).
- 35.Ru M., Brauer M., Lamarque J.-F., Shindell D., Exploration of the global burden of dementia attributable to PM2.5: What do we know based on current evidence? Geohealth 5, GH000356 (2021). [DOI] [PMC free article] [PubMed] [Google Scholar]
- 36.Zhang Y., Shindell D., Costs from labor losses due to extreme heat in the United States attributable to climate change. Clim. Change 164, 35 (2021). [Google Scholar]
- 37.Shindell D., Faluvegi G., Kasibhatla P., Van Dingenen R., Spatial patterns of crop yield change by emitted pollutant. Earths Futur. 7, 101–112 (2019). [DOI] [PMC free article] [PubMed] [Google Scholar]
- 38.Shindell D., Faluvegi G., Seltzer K., Shindell C., Quantified, localized health benefits of accelerated carbon dioxide emissions reductions. Nat. Clim. Change 8, 291–295 (2018). [DOI] [PMC free article] [PubMed] [Google Scholar]
Associated Data
This section collects any data citations, data availability statements, or supplementary materials included in this article.
Data Availability Statement
The GISS model is available at https://www.giss.nasa.gov/tools/modelE/. CMIP6 simulations from GISS and other groups are available at the Earth System Grid Federation; https://esgf-node.llnl.gov/projects/esgf-llnl/. Impact data are available at: http://shindellgroup.rc.duke.edu/apps/decarb/.


