Abstract
Selective inversion recovery (SIR) is a quantitative magnetization transfer (qMT) method that provides estimates of parameters related to myelin content in white matter, namely the macromolecular pool-size-ratio (PSR) and the spin-lattice relaxation rate of the free pool (R1f), without the need for independent estimates of ∆B0, B1+, and T1. Although the feasibility of performing SIR in the human brain has been demonstrated, the scan times reported previously were too long for whole-brain applications. In this work, we combined optimized, short-TR acquisitions, SENSE/partial-Fourier accelerations, and efficient 3D readouts (turbo spin-echo, SIR-TSE; echo-planar imaging, SIR-EPI; and turbo field echo, SIR-TFE) to obtain whole-brain data in 7, 10, and 18 minutes for SIR-TFE, SIR-EPI, SIR-TSE, respectively. Based on numerical simulations, all schemes provided accurate parameter estimates in large, homogenous regions; however, the shorter SIR-TFE scans underestimated focal changes in smaller lesions due to blurring. Experimental studies in healthy subjects (n=8) yielded parameters that were consistent with literature values and repeatable across scans (coefficient of variation: PSR=2.2–6.4%, R1f=0.6–1.4%) for all readouts. Overall, SIR-TFE parameters exhibited the lowest variability, while SIR-EPI parameters were adversely affected by susceptibility-related image distortions. In patients with relapsing remitting multiple sclerosis (n=2), focal changes in SIR parameters were observed in lesions using all three readouts; however, contrast was reduced in smaller lesions for SIR-TFE, which was consistent with the numerical simulations. Together, these findings demonstrate that efficient, accurate, and repeatable whole-brain SIR can be performed using 3D TFE, EPI, or TSE readouts; however, the appropriate readout should be tailored to the application.
INTRODUCTION
Conventional magnetization transfer (MT) imaging indirectly probes the macromolecular content of biological tissue through the off-resonance saturation of the bound macromolecular proton magnetization (1Hm), which is transferred to the observed free water proton magnetization (1Hf) through chemical exchange and dipolar coupling (Wolff and Balaban 1989). The resulting reduction in the observed MRI signal is often characterized using the magnetization transfer ratio (MTR), or the reduction of observed signal following saturation normalized to the signal without such preparation. While MTR correlates with macromolecular content (e.g. myelin content in brain tissue (Schmierer, Scaravilli et al. 2004)), it is also sensitive to experimental parameters, hardware, and other NMR properties such as relaxation times (Henkelman, Huang et al. 1993, Berry, Barker et al. 1999), which reduces its specificity and reproducibility across scanners and time.
Quantitative magnetization transfer (qMT) approaches (Edzes and Samulski 1977, Henkelman, Huang et al. 1993) employ a two-pool model of the MT effect to isolate and quantify a number of distinct tissue parameters. Among these parameters, the macromolecular-to-free water pool-size-ratio (PSR) is of particular interest because it has been shown to correlate more closely with myelin content than MTR (Schmierer, Scaravilli et al. 2004, Ou, Sun et al. 2009, Underhill, Rostomily et al. 2011). While qMT offers more reproducible and specific parameters than conventional MTR measurements, it requires multiple MT-weighted measurements and independent estimates of ∆B0, B1+, or T1 to invert the model. This results in whole-brain qMT protocols that are often prohibitively time-consuming, even when optimized acquisition strategies are employed (Yarnykh 2012),. As a result. development of faster qMT acquisition protocols remains an active area of research (Dortch, Bagnato et al. 2018, Battiston, Schneider et al. 2019).
Selective inversion recovery (SIR) (Edzes and Samulski 1977, Gochberg, Kennan et al. 1997) is an alternative qMT method that uses a low-power, on-resonance inversion pulse to invert the water protons with minimal effect on the macromolecular protons. The resulting bi-exponential recovery of the free water signal is then sampled at various inversion times (tI) (Dortch, Li et al. 2011) to estimate five qMT parameters: PSR, k mf (the rate of exchange from the macromolecular to free pools), R1f (spin-lattice relaxation rate of the free pool), M0f (equilibrium magnetization of the free pool), and Sf (the efficiency of the on-resonance inversion pulse). The SIR approach has notable advantages over saturation-based qMT methods, including reduced specific absorption rate (SAR) (Gochberg and Gore 2003, Gochberg and Gore 2007) and no requirement for additional scans to estimate ∆B0, B1+, and T1.
We previously translated a SIR sequence with a fast spin-echo (SIR-FSE) acquisition for applications in human brain at 3.0 T (Dortch, Li et al. 2011); however, the proposed 2D SIR-FSE protocol was too slow for whole-brain applications (≈4 minutes/slice). Li et al. (Li, Zu et al. 2010) demonstrated that large efficiency gains can be achieved by varying the pre-delay time (tD), or time from the end of the FSE train to the next inversion pulse, in addition to varying tI in the SIR-FSE sequence using a 9.4 T preclinical MR system. Therefore, we recently translated the more efficient variable-tD approach to a human scanner and showed that additional gains in efficiency were possible in 2D SIR-FSE imaging by constraining the value of k mf during the fitting process (Dortch, Bagnato et al. 2018). This resulted in a model with only four free parameters (PSR, R1f, M0f, and Sf), which could be estimated with minimal bias from SIR-FSE images acquired at four optimized combinations of tI and tD within ≈40 seconds/slice. In addition to improving efficiency, fixing k mf improved the robustness of parameter estimates against partial-volume induced artifacts.
Even with these previous developments, the optimized single-slice SIR protocol is too long for most whole-brain scans in the clinic. For example, the existing protocol requires ≈20 minutes to independently acquire data from 30 slices. The studies herein sought to overcome this barrier to clinical adoption by evaluating the compatibility of SIR with the following efficient 3D readouts: turbo spin-echo (SIR-TSE), spin-echo echo-planar imaging (SIR-EPI), and turbo field-echo (SIR-TFE). Each 3D acquisition was then combined with SENSE and partial-Fourier acquisitions in multiple directions, with the goal of obtaining whole-brain SIR acquisitions within clinically viable scan times. More specifically, we first evaluated the effect of each readout on the point-spread function (PSF) of the SIR parameter maps using numerical simulations. Each 3D protocol was then deployed in the brains of healthy volunteers over two scan sessions, and the resulting qMT parameters were evaluated for repeatability across time and consistency with published values. Finally, to demonstrate the applicability of each technique in neurodegenerative diseases, two patients with relapsing-remitting multiple sclerosis (RRMS) were studied.
THEORY
SIR sequences are based on an inversion recovery preparation, in which a low-power inversion pulse is used to selectively invert the 1Hf longitudinal magnetization (Mzf) with minimal saturation of the 1Hm longitudinal magnetization (Mzm) (Edzes and Samulski 1977). This preparation results in the maximum difference in magnetization between the two pools and, thus, the greatest sensitivity to MT. This inversion preparation can be followed by any acquisition sequence, such as TSE (Gochberg and Gore 2007, Dortch, Li et al. 2011), EPI (Gochberg and Gore 2003, Xu, Li et al. 2014), or TFE (Dortch, Moore et al. 2013). For TSE readouts, Mzf and Mzm have been found to be nulled at the end of the readout of sufficient length (≈100–200 ms) (Gochberg and Gore 2007) because i) the FSE refocusing pulses minimize any T1 recovery of Mzf and ii) MT pulls Mzm toward the nulled Mzf. Satisfaction of this condition allows one to account for a short-tD in the signal model, increasing the time efficiency relative to simpler inversion recovery models that require tD≈5T1 for full recovery of Mzf and Mzm. For the other readouts (EPI and TFE), these assumptions are usually not met; however, a dedicated train of “reset” 90° RF pulses can be applied after the readout to achieve a similar effect (Dortch, Moore et al. 2013) (Xu, Li et al. 2014). In the current work, we adopted this idea and implemented a train of “reset” RF pulses to accelerate 3D SIR-TFE and SIR-EPI pulses as shown in Figure 1.
Figure 1.
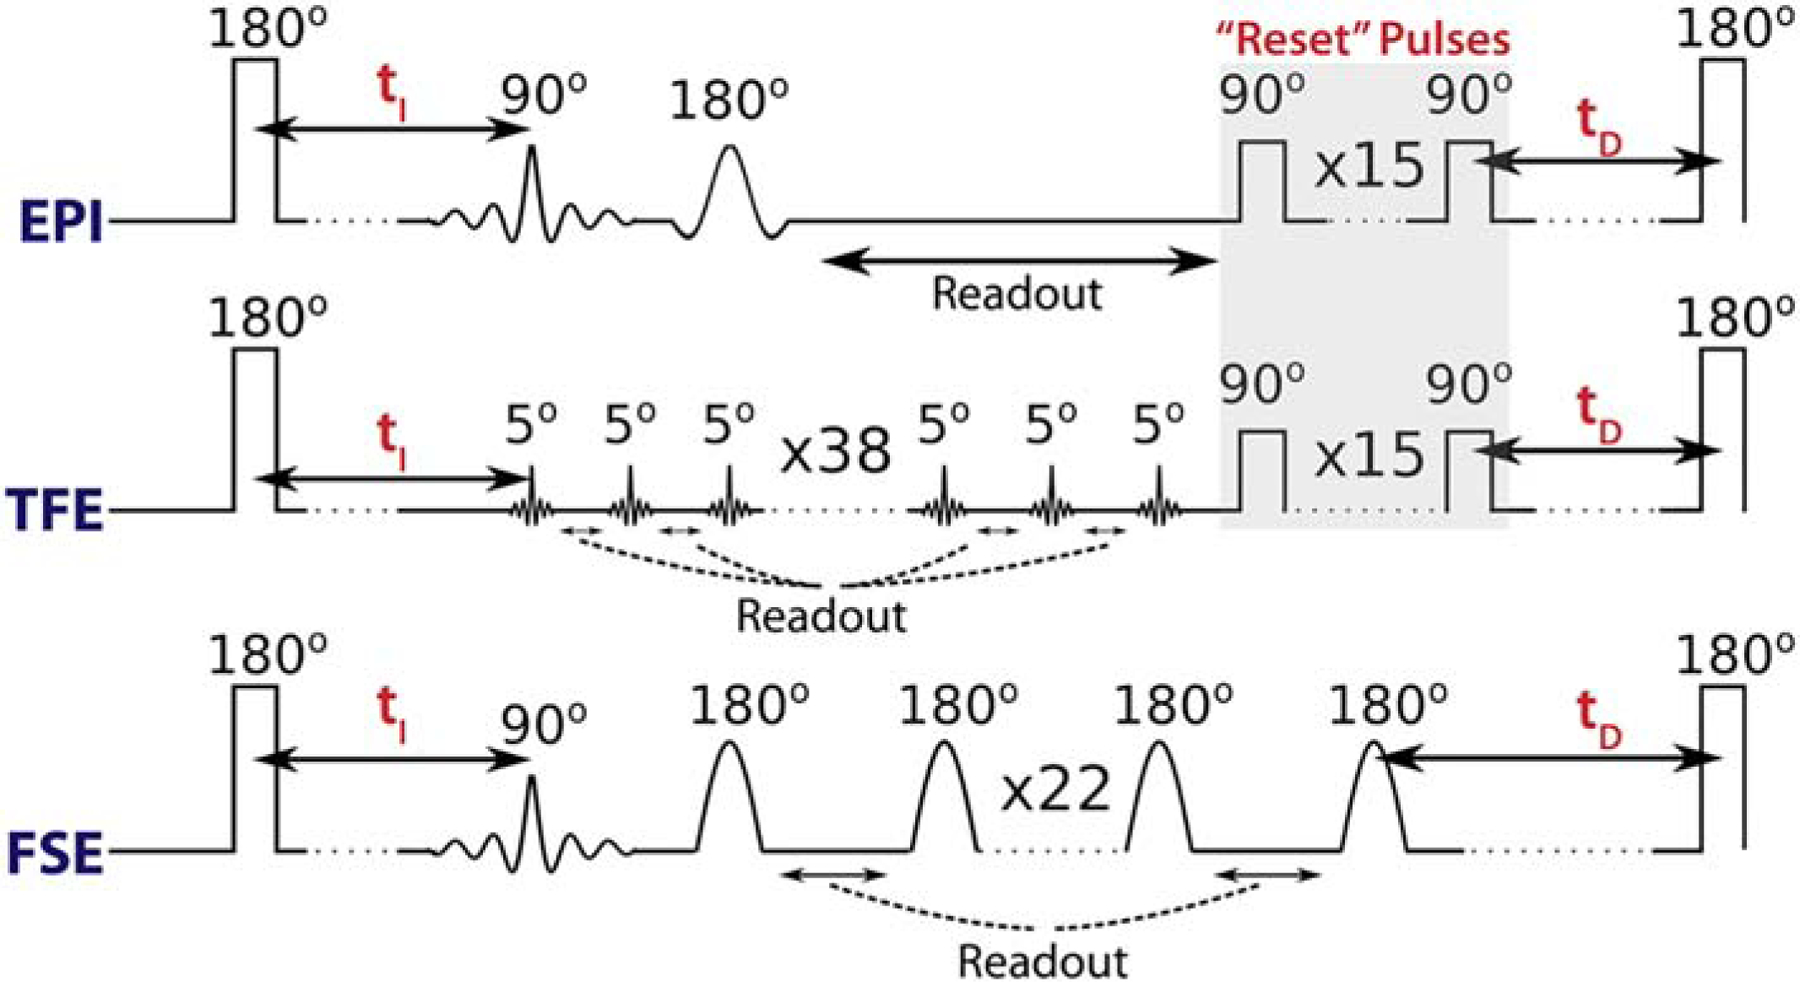
RF pulse diagrams for the SIR-EPI, SIR-TFE, and SIR-FSE sequences. Note the “reset” RF pulses after the EPI and TFE readouts, which serve to saturate the water and macromolecular longitudinal magnetization at tD=0. This is not required for the FSE readout, which inherently saturates both pools when the readout train is sufficiently long (≳100 ms).
As shown previously (Dortch, Moore et al. 2013, Dortch, Bagnato et al. 2018), the longitudinal magnetization vector under the assumption of nulled longitudinal magnetization can described by
| (1) |
where I is the identity matrix, is a vector of equilibrium magnetizations, S = diag(Sf, Sm) accounts for the effects of the inversion pulse on each pools (Sf = −1 represents complete inversion of Mzf, and Sm = 1 represents no saturation of Mzm), and the matrix
| (2) |
incorporates the R1 of each pool and the rate of MT exchange between pools. As only the 1Hf pool is directly observable in conventional MRI experiments, the SIR signal corresponds to the Mzf component of Eq. 1, assuming that M0 captures additional experimental scaling parameters (e.g. coil sensitivities, T2 decay). The resulting model has seven independent parameters: R1m, R1f, Sm, Sf, M0f, PSR=M0f/M0m, and k mf. As shown previously (Gochberg and Gore 2007), Sm can be estimated numerically (Sm=0.83±0.07 for a 1 ms block inversion pulse, Gaussian lineshape, and T2m=10–20 microseconds), and it can be assumed that R1f=R1m due to the relative insensitivity of the SIR signal to R1m (Li, Zu et al. 2010). These assumptions allow the calculation of five independent model parameters (R1f, Sf, M0f, PSR, and kmf) by least-squares fitting of SIR data with the Mzf component of Equation 1. The dimensionality of the problem can be further reduced by assuming a constant value for k mf during fitting because the optimized SIR acquisition is relatively insensitive to variation of this parameter (Dortch, Bagnato et al. 2018).
MATERIALS AND METHODS
Pulse Sequences
All numerical and experimental studies were performed with the 3D SIR sequences shown in Figure 1. Each sequence was repeated at four optimized combinations of tI and tD (Dortch, Bagnato et al. 2018) and covered the entire cerebrum (field-of view = 211×211×99 mm3) at a resolution = 2.2×2.2×3.0 mm3. The additional parameters listed in Table 1 were heuristically optimized to balance the competing issues of scan time, SNR, and blurring from the different readouts (see Numerical Simulations). Single-shot readouts were employed for both SIR-TFE and SIR-EPI acquisitions. As in previous work (Dortch, Li et al. 2011, Dortch, Bagnato et al. 2018), two shots were used for the SIR-TSE acquisition as the long readout train required for single-shot TSE yields a level of blurring that is unacceptable for the studies herein. This resulted in total scan times for the SIR-TSE, SIR-EPI, and SIR-TFE sequences of approximately 18, 10, and 7 minutes, respectively. Note that an additional SIR-EPI acquisition (tI/tD = 278/2730 ms) was carried out with a reversed phase-encode direction to allow distortion correction with FSL’s topup function (Andersson, Skare et al. 2003, Smith, Jenkinson et al. 2004). This was included in the scan time calculation for SIR-EPI. In addition, SIR-EPI data employed fat suppression via a gradient reversal technique to minimize the impact of chemical shift displacement from lipids surrounding the skull.
Table 1.
Parameters used for the SIR-qMT sequences shown in Figure 1. For all acquisitions, the x-direction is assumed to be the readout direction, while the y- and z-directions represent phase encode directions. For SIR-EPI scans, an additional reversed y-phase-encoding acquisition was acquired with the bolded tI/tD for distortion correction.
| 3D SIR-TSE | 3D SIR-EPI | 3D SIR-TFE | |
|---|---|---|---|
| Number of shots/kz-value | 2 | 1 | 1 |
| Number of k-space lines/shot | 22 | 38 | 38 |
| Halfscan (% of total ky x kz) | 100 × 100 | 60 × 60 | 60 × 60 |
| SENSE acceleration factor (ky x kz) | 2.2 × 1.5 | 1.5 × 1.5 | 1.5 × 1.5 |
| Echo spacing (ms) | 5.9 | - | 2.6 |
| Number of “reset” pulses | - | 15 | 15 |
| “Reset” pulse angle (deg.) | - | 90 | 90 |
| TE (ms) | 68 | 20 | 1.32 |
| Field-of-view (mm3) | 211 × 211 × 99 | 211 × 211 × 99 | 211 × 211 × 99 |
| Acquired voxel size (mm3) | 2.20 × 2.24 × 3.00 | 2.20 × 2.24 × 3.00 | 2.20 × 2.24 × 3.00 |
| Reconstructed voxel size (mm3) | 1.65 × 1.65 × 3.00 | 1.65 × 1.65 × 3.00 | 1.65 × 1.65 × 3.00 |
| Excitation flip angle (deg.) | 90 | 90 | 5 |
| Fat suppression technique | - | gradient reversal | - |
| tI (ms) | 15, 15, 278, 1007 | 15, 15, 278, 1007 | 15, 15, 278, 1007 |
| tD (ms) | 684, 4171, 2730, 10 | 684, 4171, 2730, 10 | 684, 4171, 2730, 10 |
| k-space ordering | linear | linear | centric |
| Total scan time (minutes) | 18 | 10 | 7 |
Numerical Simulations
The different readouts described herein act as a k-space filter that blurs the image along the phase-encoding direction according to each readout PSF, which is a complex function of the sequence timings and the NMR parameters of the tissue (Constable and Gore 1992). For TSE and EPI readouts, the k-space filter and resulting PSF are constant as a function of tI, and hence the filter simply blurs the final SIR parameter maps. For the TFE readout, the k-space filter and PSF change as a function of tI; therefore, each image will be blurred to a different degree, potentially biasing the final parameter maps.
Similar to our previous work (Dortch, Moore et al. 2013), the effect of each readout on the estimated SIR parameters was numerically evaluated using a digital phantom. For simplicity but without loss of generality, only a one-dimensional (1D) case was used in the simulations but 2D and 3D cases can be evaluated in a similar way. The digital phantom consists of alternating regions representing normal-appearing white matter (NAWM, 10 voxels wide) and lesions (2–10 voxels wide, mimicking lesions with different sizes). The effect of each readout was numerically simulated for each tI/tD combination and tissue type with the imaging parameters in Table 1 and the model parameters in Figure 2 as described in (Dortch, Moore et al. 2013). The resulting signal evolution was then re-ordered into a k-space filter, taking into account the k-space ordering (centric or linear), number of shots/slices, SENSE acceleration, and partial-Fourier acquisitions. Because our goal was to evaluate the impact of the readout on the estimated parameter maps rather than partial-Fourier reconstruction methods, a linear ramp was assumed for the unacquired regions in each simulated partial-Fourier acquisition to minimize the impact of sharp discontinuities in k-space on the reconstructed test objects. To apply the k-space filters to the 1D test objects, each uniform object region was Fourier transformed into k-space, multiplied by its corresponding k-space filter, and inverse Fourier transformed back into image space. The resulting object regions were then summed to generate the final blurred 1D object for each readout and tI/tD combination. Finally, to assess the effect of the readouts on SIR parameter maps, the magnitude of the blurred test object signal at each voxel was fit to the SIR model as described below (see Data Analysis section). All simulations used the sequence parameters listed in Table 1, and the following tissue-specific parameters in NAWM/lesion (gray/white regions): PSR=10/5%, and R1m= R1f=1.0/0.5 s−1, and T2f= T2f*=70/100 ms. The remaining parameters kmf=12 s−1, Sm=0.83, Sf=0.95) were assumed to be the same across tissues.
Figure 2.
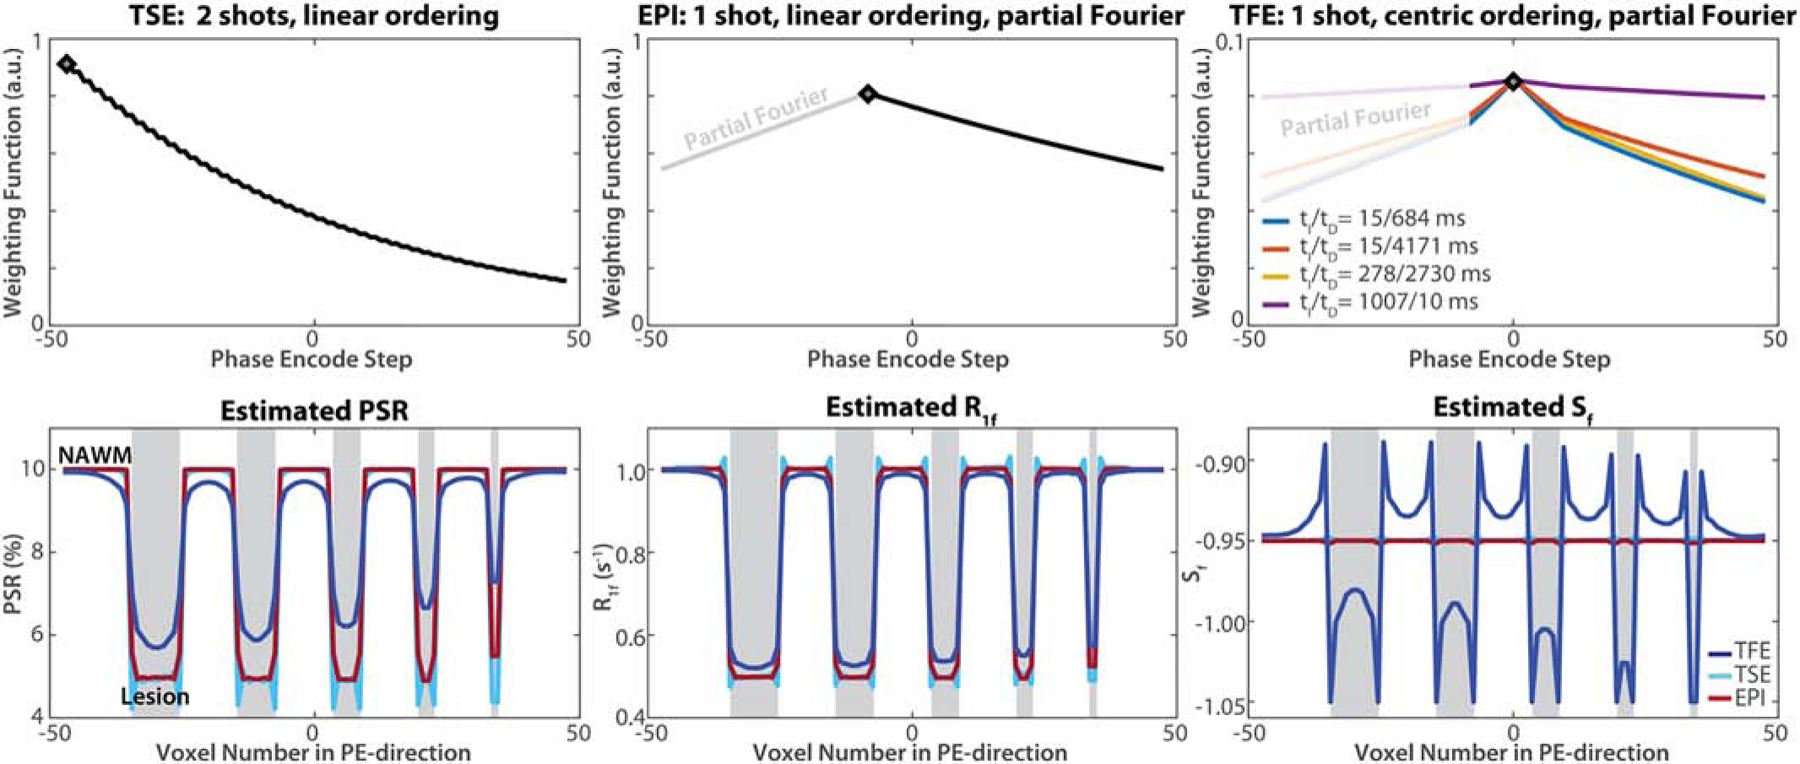
Numerical simulations of the k-space weighting function for each SIR readout (top row, left-to-right: two-shot TSE with linear encoding, single-shot EPI with linear encoding and partial Fourier reconstruction, and single-shot TFE with centric encoding and partial Fourier reconstruction) and its corresponding effect on estimated SIR parameters (bottom row). The first acquired line of k-space for each readout is indicated via a gray diamond in the k-space weighting function, and regions filled to account for partial Fourier acquisitions are indicated via gray text/lines. In the SIR parameter plots, regions representing ‘lesion’ voxels are shaded grey, regions representing normal appearing tissue are shaded white, and coloured lines represent the spatial variation in calculated SIR parameters.
Experimental Studies
Data were acquired in eight healthy volunteers (1 female, 7 males, mean age ± std. = 29.9 ± 4.9 years) using a 3.0 Tesla Philips Ingenia whole-body MR scanner (Philips Healthcare, Best, The Netherlands) equipped with two-channel body transmit and 32-channel head-only receive coils. Healthy subjects were scanned twice, with visits separated by a minimum of 5 days (mean±SD=10±8 days) to assess scan-rescan repeatability. In addition, two subjects with clinically defined relapsing-remitting multiple sclerosis (RRMS) underwent a single scan session to compare the performance of each method in the visualization of focal lesions. The study was approved by the VUMC Institutional Review Board and informed consent was obtained from all subjects prior to scanning.
Whole-brain 3D SIR-TSE, -EPI, and -TFE data were acquired as described in the Pulse Sequences section using the parameters listed in Table 1. Additional anatomical images were acquired in all subjects for region-of-interest (ROI) delineation using a multi-shot 3D T1-weighted MP-RAGE sequence (Mugler III and Brookeman 1990) (inversion time tI=665 ms, TE=3.8 ms, TR=8.1 ms, TFE factor = 154, shot interval=3000 ms, SENSE factor = 2) at 1 mm3 isotropic resolution over a 211×211×120 mm3 FOV. For the patients with RRMS, FLAIR images were also acquired for lesion identification using a multi-slice acquisition at 1×1×2 mm3 resolution with TR/ tI /TE=11,000/2800/125 ms, TSE factor=31, and refocusing angle=120°.
Data Analysis
For SIR-EPI, an unwarping transformation was first estimated via topup in FSL (Andersson, Skare et al. 2003, Smith, Jenkinson et al. 2004). The deformation field was estimated using volumes acquired with opposite phase-encode directions at tI/tD = 278/2730 ms and then applied to the other tI/tD combinations. To correct for motion, each SIR dataset was then registered to the tI/tD = 278/2730 ms image via an affine transformation using FLIRT in FSL (Jenkinson, Wilson et al. 2002, Jenkinson, Wilson et al. 2004, Greve and Fischl 2009), as this image had the highest anatomical contrast. Finally, skull stripping was performed using BET in FSL (Smith 2002).
SIR model parameters (PSR, R1f, Sf, and M0f) were estimated by fitting the magnitude of each voxel with the Mzf component of Eq (1) using in-house written software (MATLAB R2017b, The Mathworks Inc., Natick, MA, USA). For these estimates, kmf was fixed to the mean value reported in brain (12.5 s−1, see previous publications for additional details (Dortch, Li et al. 2011, Dortch, Moore et al. 2013, Dortch, Bagnato et al. 2018)).
For the first scan in each subject, all parameter maps were co-registered into the MP-RAGE space from the same scan session via a rigid transformation (9 degrees-of-freedom) calculated using FLIRT. ROIs were then defined in this space using ITK-SNAP (Yushkevich, Piven et al. 2006) (www.itksnap.org) in the corona radiata (CR), occipital white matter (OWM), frontal white matter (FWM), genu of the corpus callosum (GCC), splenium of the corpus callosum (SCC), internal capsule (IC), caudate nucleus (CdN), and putamen (Pu). For the healthy subjects that underwent a second scan, the parameter maps from the second scan session were co-registered with the MP-RAGE images from the first scan session so that the same ROIs could be used to assess scan-rescan repeatability.
Statistics
In healthy subjects, the mean and standard deviation of PSR and R1 f values were calculated in each ROI. Sf and M0f were excluded from these analyses because they are not biologically relevant. Using data from the first scan session, differences between readout types (EPI, TSE, TFE) were evaluated using Bland-Altman analyses, in which the mean difference and the limits of agreement (LOA = mean difference ± 1.96*SD) were tabulated across the different readouts. Scan-rescan repeatability of PSR and R1f was also evaluated via a Bland-Altman analysis, in which the mean difference and the LOA were tabulated across scans. Scan-rescan repeatability was further quantified using the coefficient of variation (COV), which was calculated in each ROI and subject by taking the ratio of the standard deviation to the mean value over both visits. For each readout, the mean COV was then tabulated over all ROIs and subjects.
RESULTS
Numerical Simulations
The results of the numerical simulations using a digital phantom to assess the effect of each readout on estimated parameter maps are shown in Figure 2. In the top row, the k-space filters for simulated regions as a function of tI and tD are shown. It can be seen that the shape (width and rate of decay) of the k-space filter is constant for EPI and TSE for all tI/tD values because these filters are defined solely by the transverse decay during the readout (i.e., all longitudinal magnetization is converted to transverse magnetization by the excitation pulse). The sawtooth pattern in the TSE weighting function is due to the two-shot acquisition. From the fit parameters, it can be seen that the TSE and EPI yield little bias, although some edge enhancement in seen in PSR from the TSE readout. This is because the k-space weightings function for TSE and EPI (black lines) are driven by the decay of transverse magnetization during the readout (T2 or T2*) and are, therefore, independent of tI and tD. In contrast, the k-space filter for TFE is a function of the recovery of longitudinal magnetization, which changes as a function of tI and tD (color lines in upper-right panel) and results in PSR values that are increasingly overestimated in smaller lesions.
SIR Readout Comparison in Healthy Controls
Figure 3 shows representative 4-point SIR magnitude images acquired with TSE, EPI, and TFE readouts. Markedly different contrast is apparent between the tI/tD combinations within each readout scheme, with additional differences in contrast between readout schemes due to different TEs. In addition, note the differences in blurring across readouts, which is consistent with simulations in Figure 2. Figure 4 shows representative PSR and R1f maps acquired with these readouts. The SIR-EPI data show increased artifacts relative to SIR-TSE and SIR-TFE data, potentially due to the increased distortion inherent in the EPI readout and the subsequent distortion correction applied during image reconstruction. The TFE data also show slightly less contrast between GM, WM, and CSF compared to the TSE data, likely due to the variable PSF inherent in the TFE readout.
Figure 3.
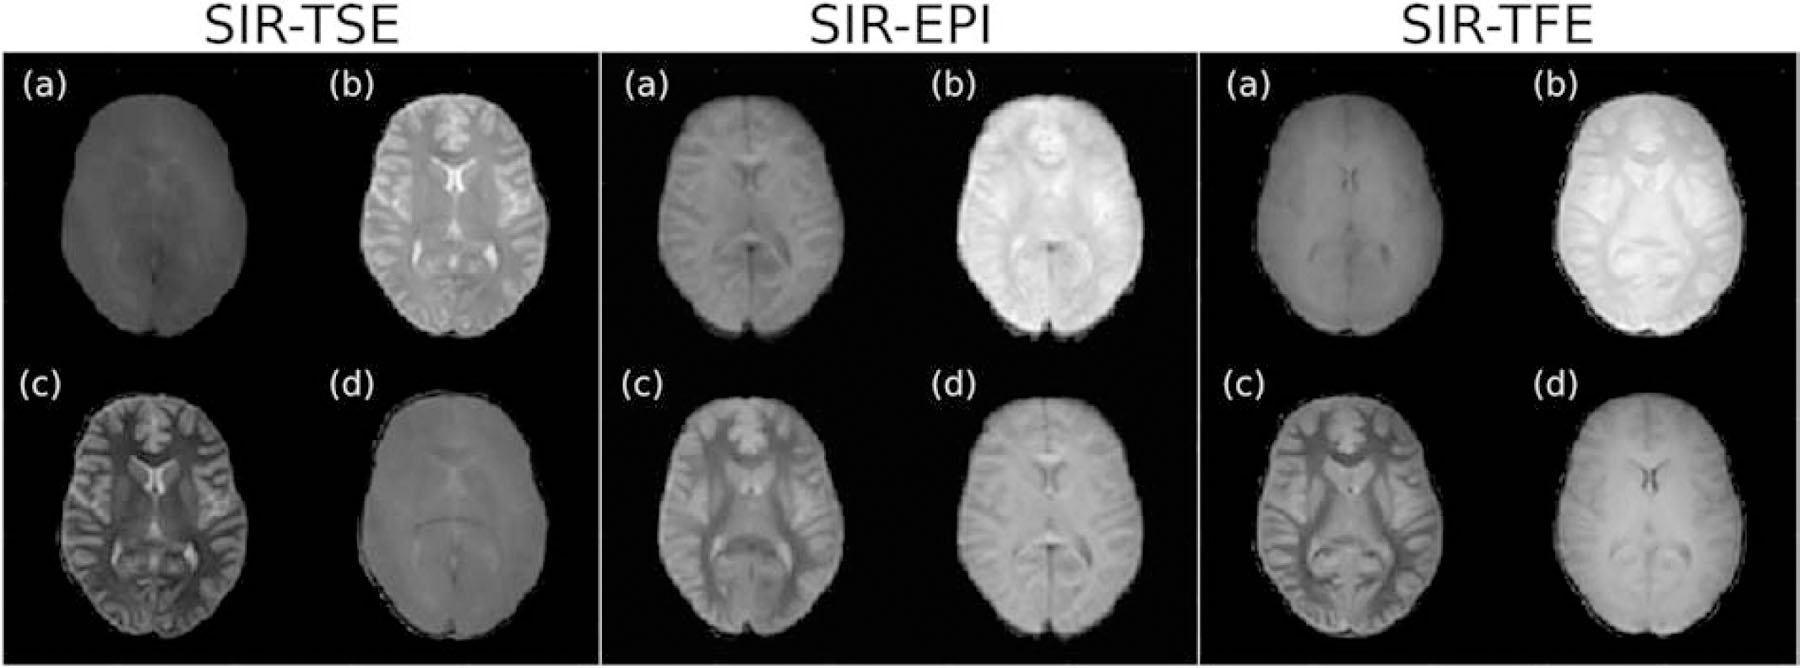
Representative 4-point SIR magnitude images for each tI and tD combination and each readout scheme: (a) tI/tD = 15/684 ms, (b) tI/tD = 15/4171 ms, (c) tI/tD = 278/2730 ms, (d) tI/tD = 1007/10 ms. Contrast varies due to the different TE used in each scheme, while blurring is defined by the different readout as described in Fig. 2.
Figure 4.
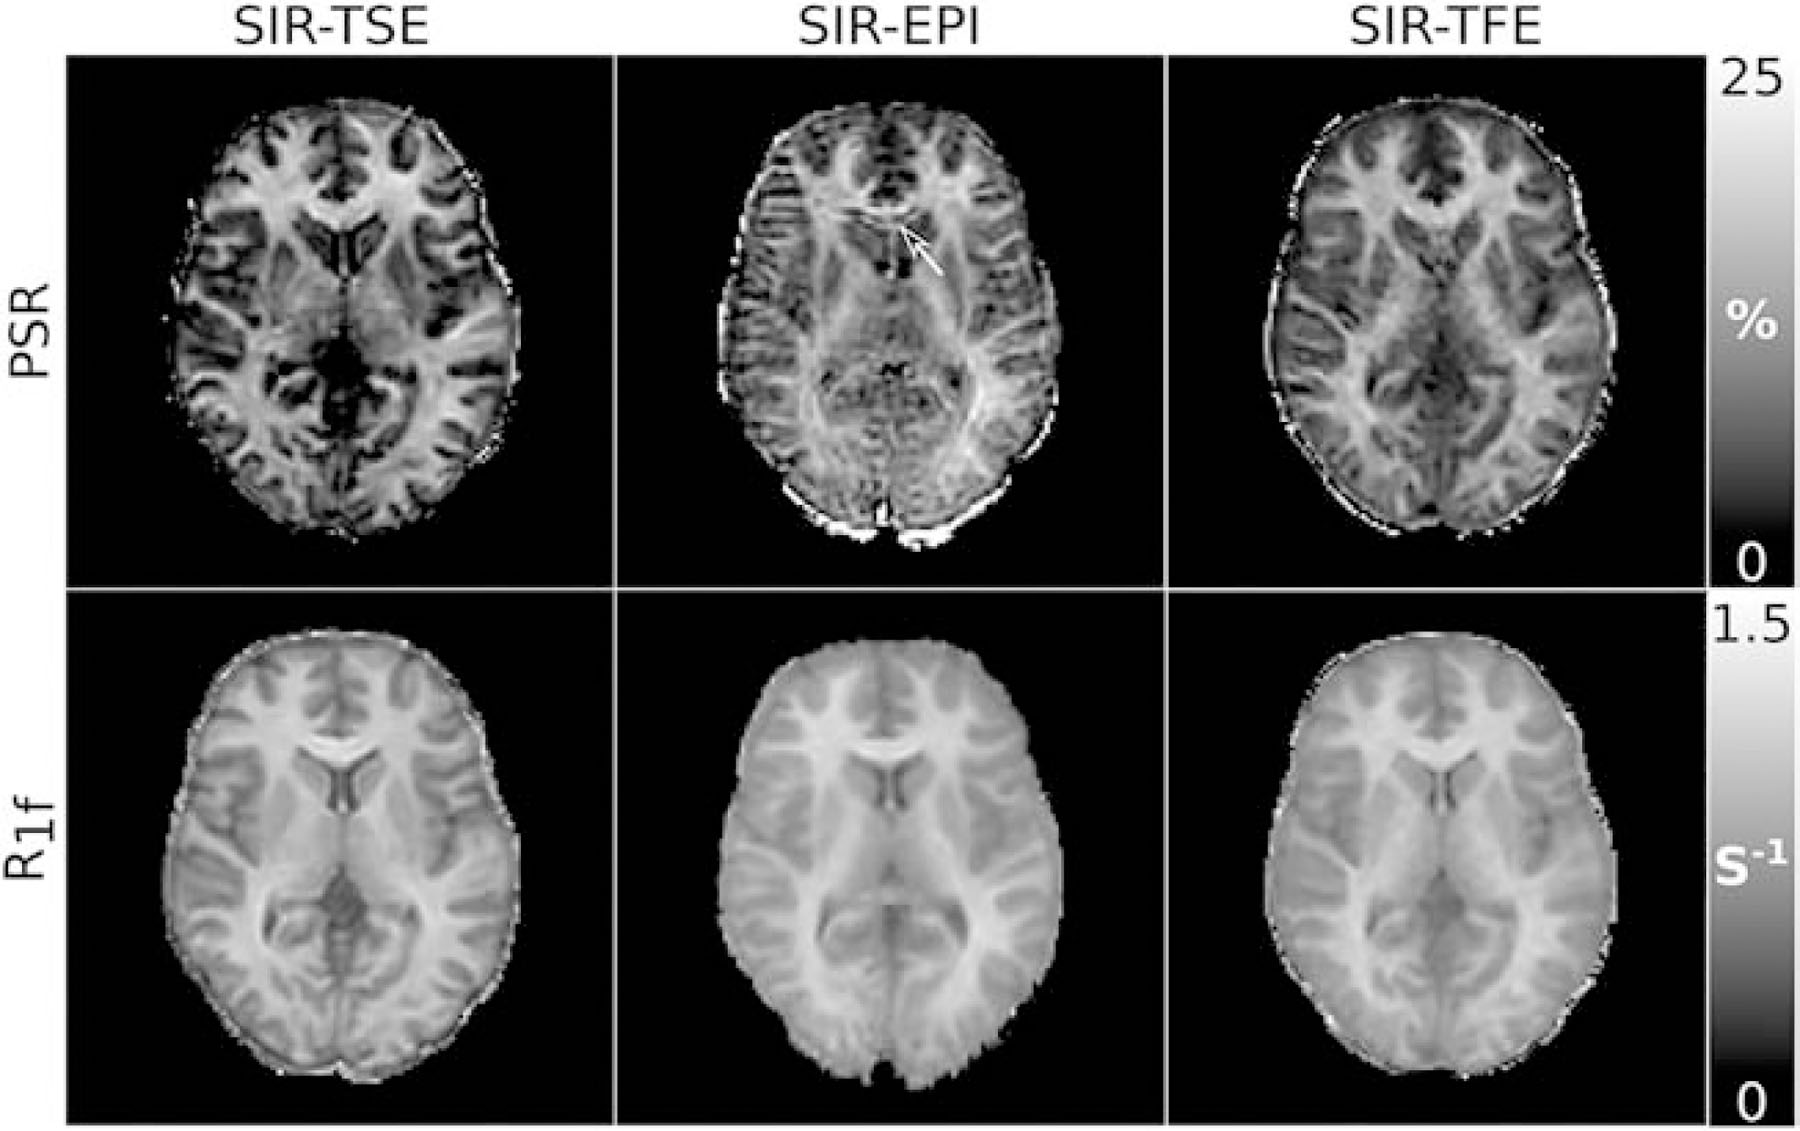
Representative PSR and R1f maps from the SIR-TSE, SIR-EPI, and SIR-TFE data. Artifacts (see arrow in the genu of the corpus callosum) can be seen in the PSR values from SIR-EPI, which are presumably due to errors in the distortion correction scheme.
Figure 5 shows boxplots of PSR and R1f values in the ROIs derived from the first visit data for each healthy subject. For all schemes, the resulting PSR and R1f were consistent with values reported in the literature (Dortch, Li et al. 2011, Dortch, Bagnato et al. 2018). A more detailed examination of the boxplot in Figure 5, did, however, indicate subtle systematic differences between readouts in some ROIs (e.g., TSE-derived PSR and R1f values are lower than the other readout for the corona radiata, occipital white matter), which may be related to the aforementioned differences in the PSFs. Furthermore, the precision of PSR estimates in the genu of the corpus callosum was reduced for the EPI readout, possibly due to the combined effect of partial-volume contamination from nearby CSF and imperfect distortion correction. Figures 6 and 7 show Bland-Altman plots comparing inter-readout reliability and scan-rescan reliability for each readout. Figure 6 shows close agreement between TFE- and EPI-derived PSR and R1f values, while TSE-derived values showed poorer agreement with the other readouts. From Figure 7, it can be seen that SIR-TFE (COV of PSR/R1f=2.2/0.6%) clearly outperforms the SIR-TSE (COV of PSR/R1f=4.5/1.1%) and SIR-EPI (COV of PSR/R1f=6.4/1.4%) acquisitions in terms of lower scan-rescan variability.
Figure 5.
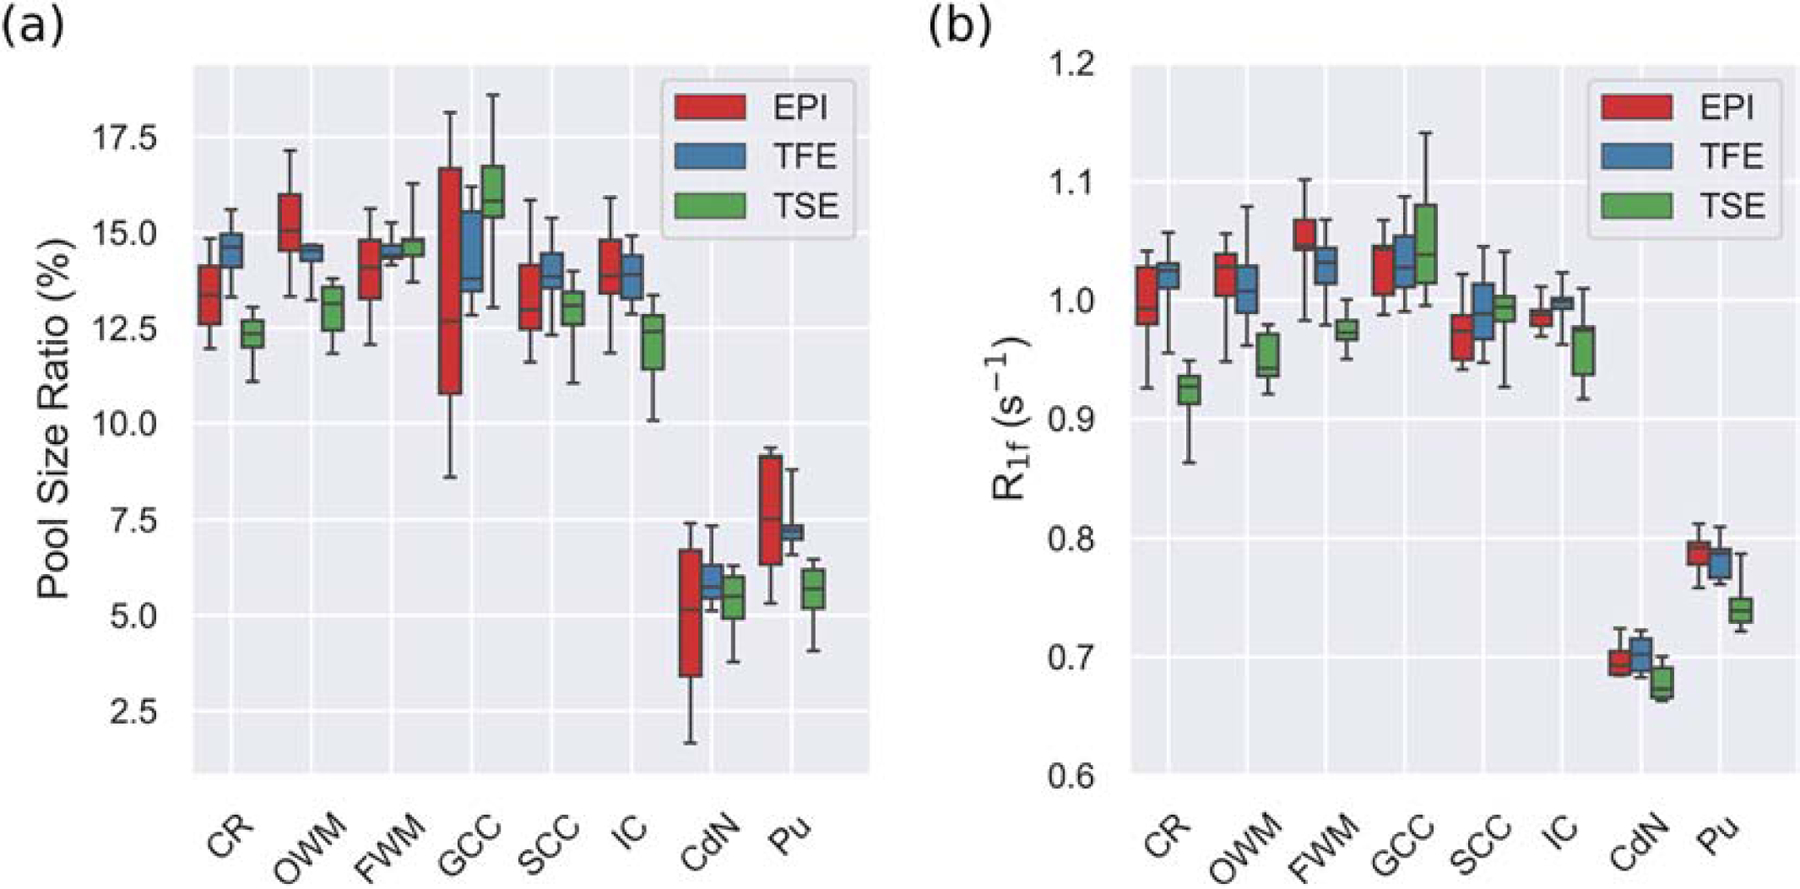
Boxplots of mean ROI (a) PSR values and (b) R1f values in healthy WM and GM ROIs. Shown are the median (black line) and inter-quartile range (box) and total spread (whiskers) derived from all healthy subjects during their first scan. Data are presented for the following ROIs: the corona radiata (CR), occipital white matter (OWM), frontal white matter (FWM), genu of the corpus callosum (GCC), splenium of the corpus callosum (SCC), internal capsule (IC), caudate nucleus (CdN), and putamen (Pu).
Figure 6.
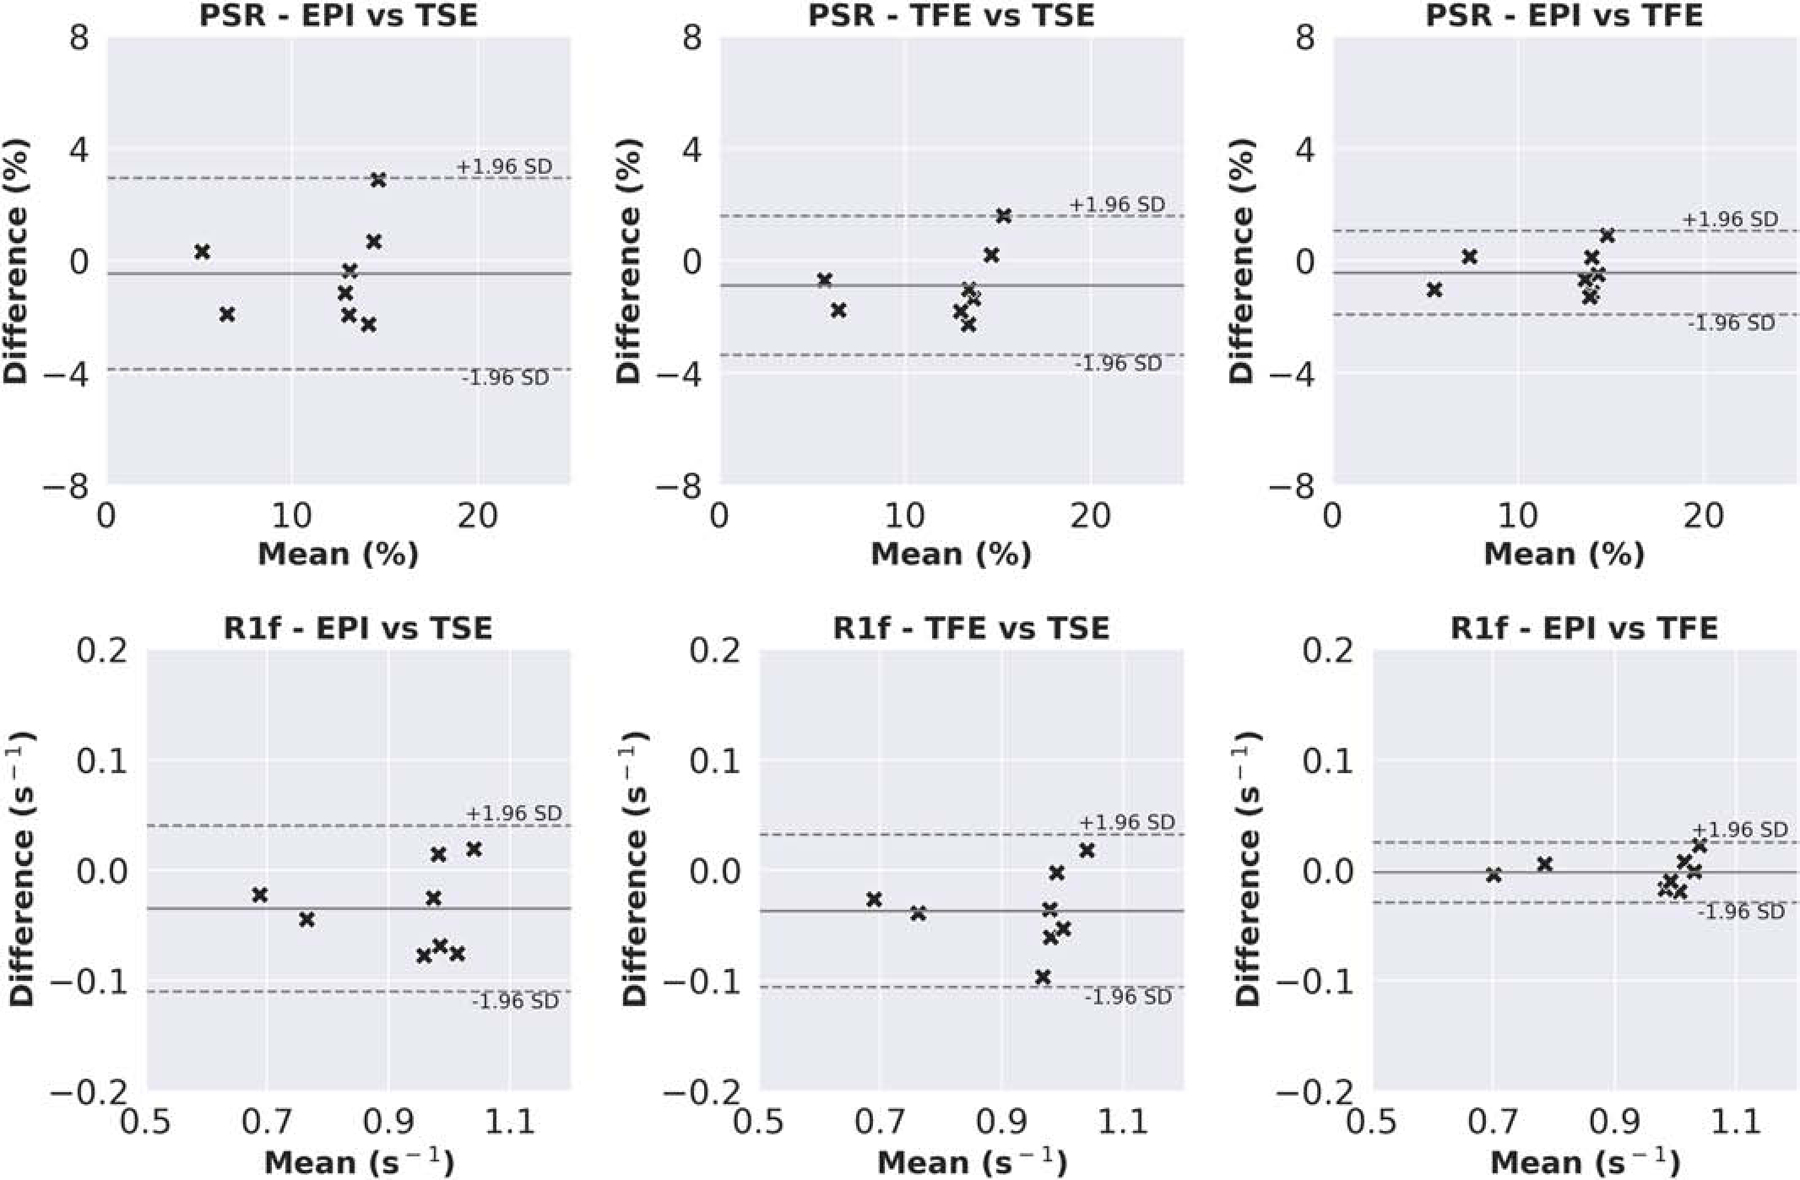
Bland-Altman plots indicating the inter-readout reliability of PSR and R1f measurements derived from the SIR-TSE, SIR-EPI, and SIR-TFE acquisitions. The solid line is the mean difference, and the dashed lines are the limits of agreement (mean difference ± 1.96 SD).
Figure 7.
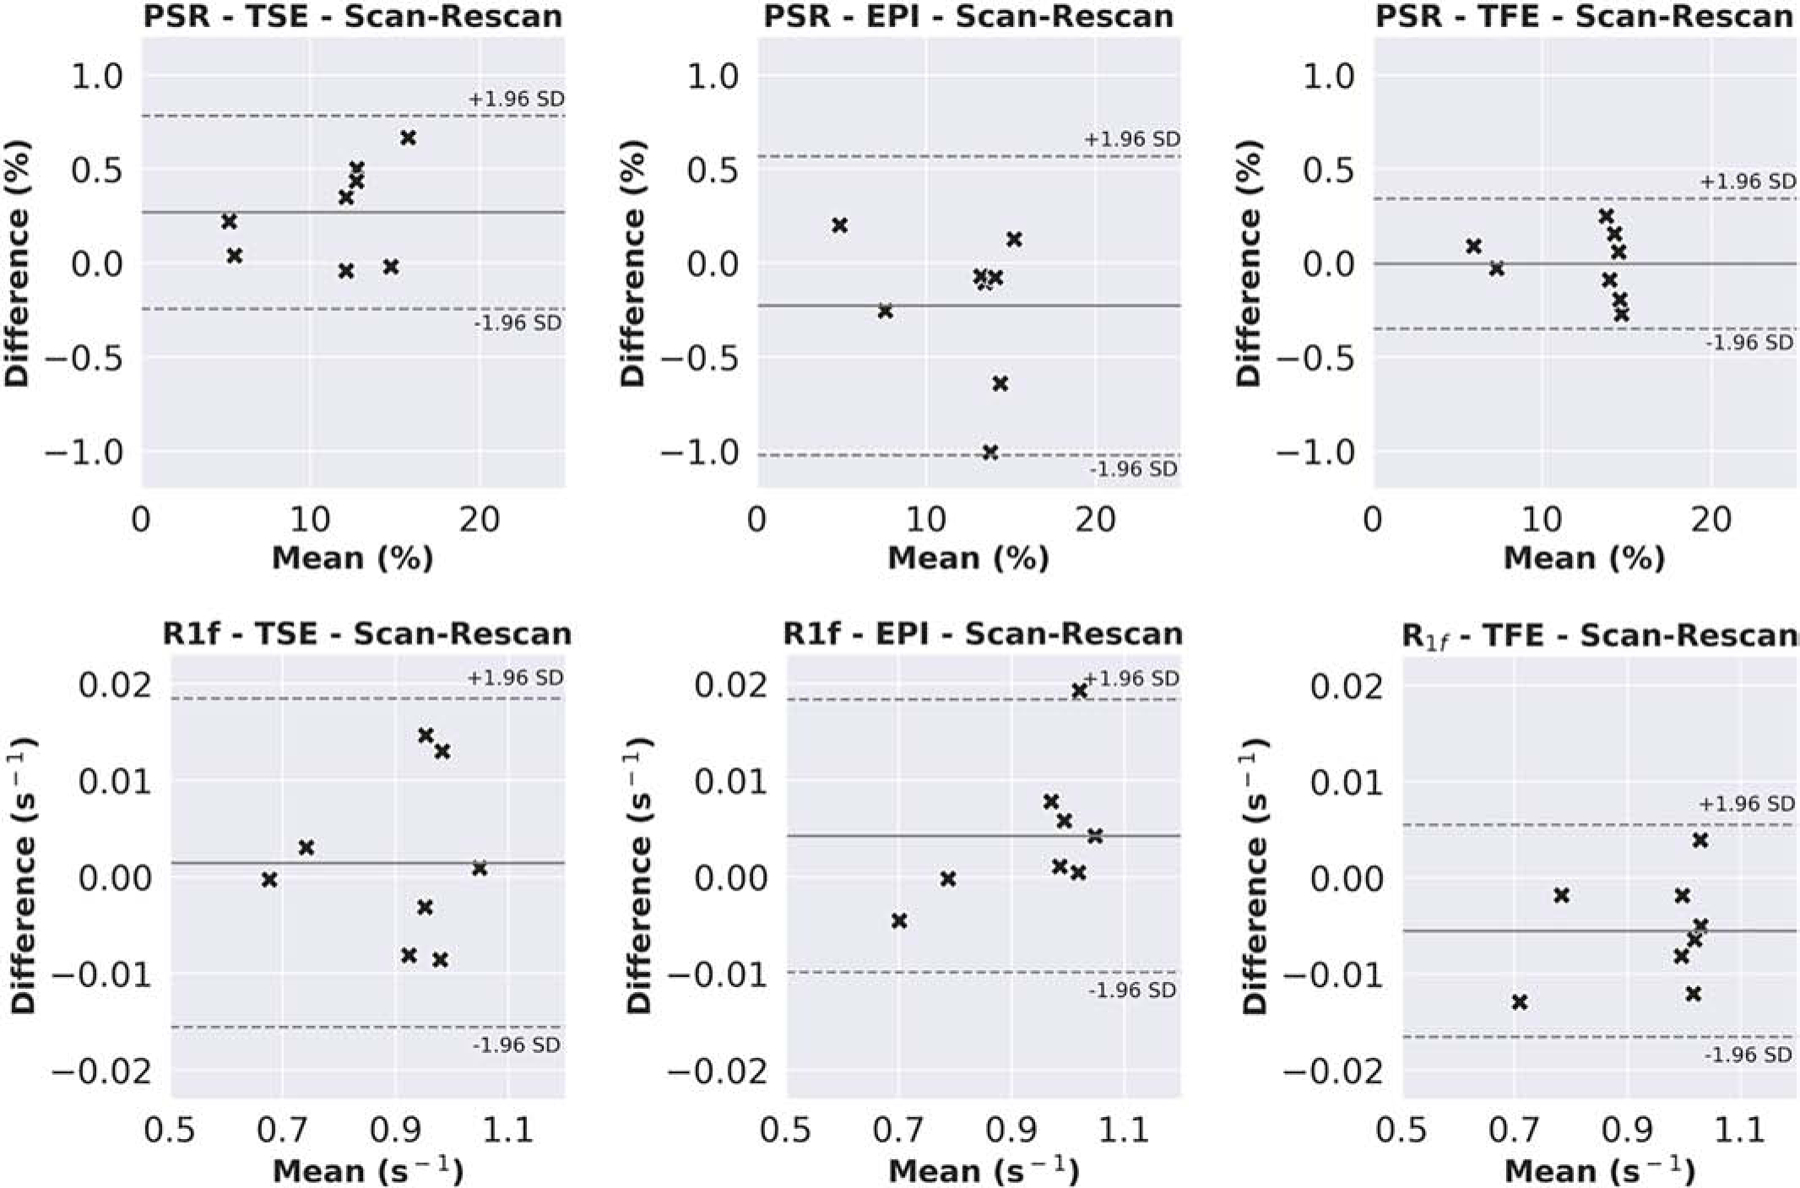
Bland-Altman plots indicating the scan-rescan reliability of PSR and R1f measurements derived from the SIR-TSE, SIR-EPI, and SIR-TFE acquisitions. The solid line is the mean difference, and the dashed lines are the limits of agreement (mean difference ± 1.96 SD).
SIR Readout Comparison in Patients with RRMS
Figure 8 shows representative slices from FLAIR images as well as PSR and R1f maps derived from each readout in two subjects with clinically definite RRMS. Lesions are clearly visible in the FLAIR images as indicated with arrows. Lesions appear as hypointense in both PSR and R1f maps, with a smaller apparent spatial extent and less sharply defined boundaries in the SIR-TFE. This is due in part to the lower resolution of the SIR acquisition (2.2×2.2×3 mm3) relative to the FLAIR acquisition (1×1×3 mm3), and the PSF inherent in the TFE readout. In addition, SIR parameter maps and FLAIR images highlight different pathological features (e.g., myelination and inflammation); therefore, the spatial extent of lesions defined from each method may be different. Finally, although some artifacts were apparent in the PSR (e.g., hyperintense region in the genu of subject 2 using SIR-TSE) and R1f images of some subjects, these were not present in the scans from a majority of the subjects. These are likely due to partial volume effects and motion.
Figure 8.
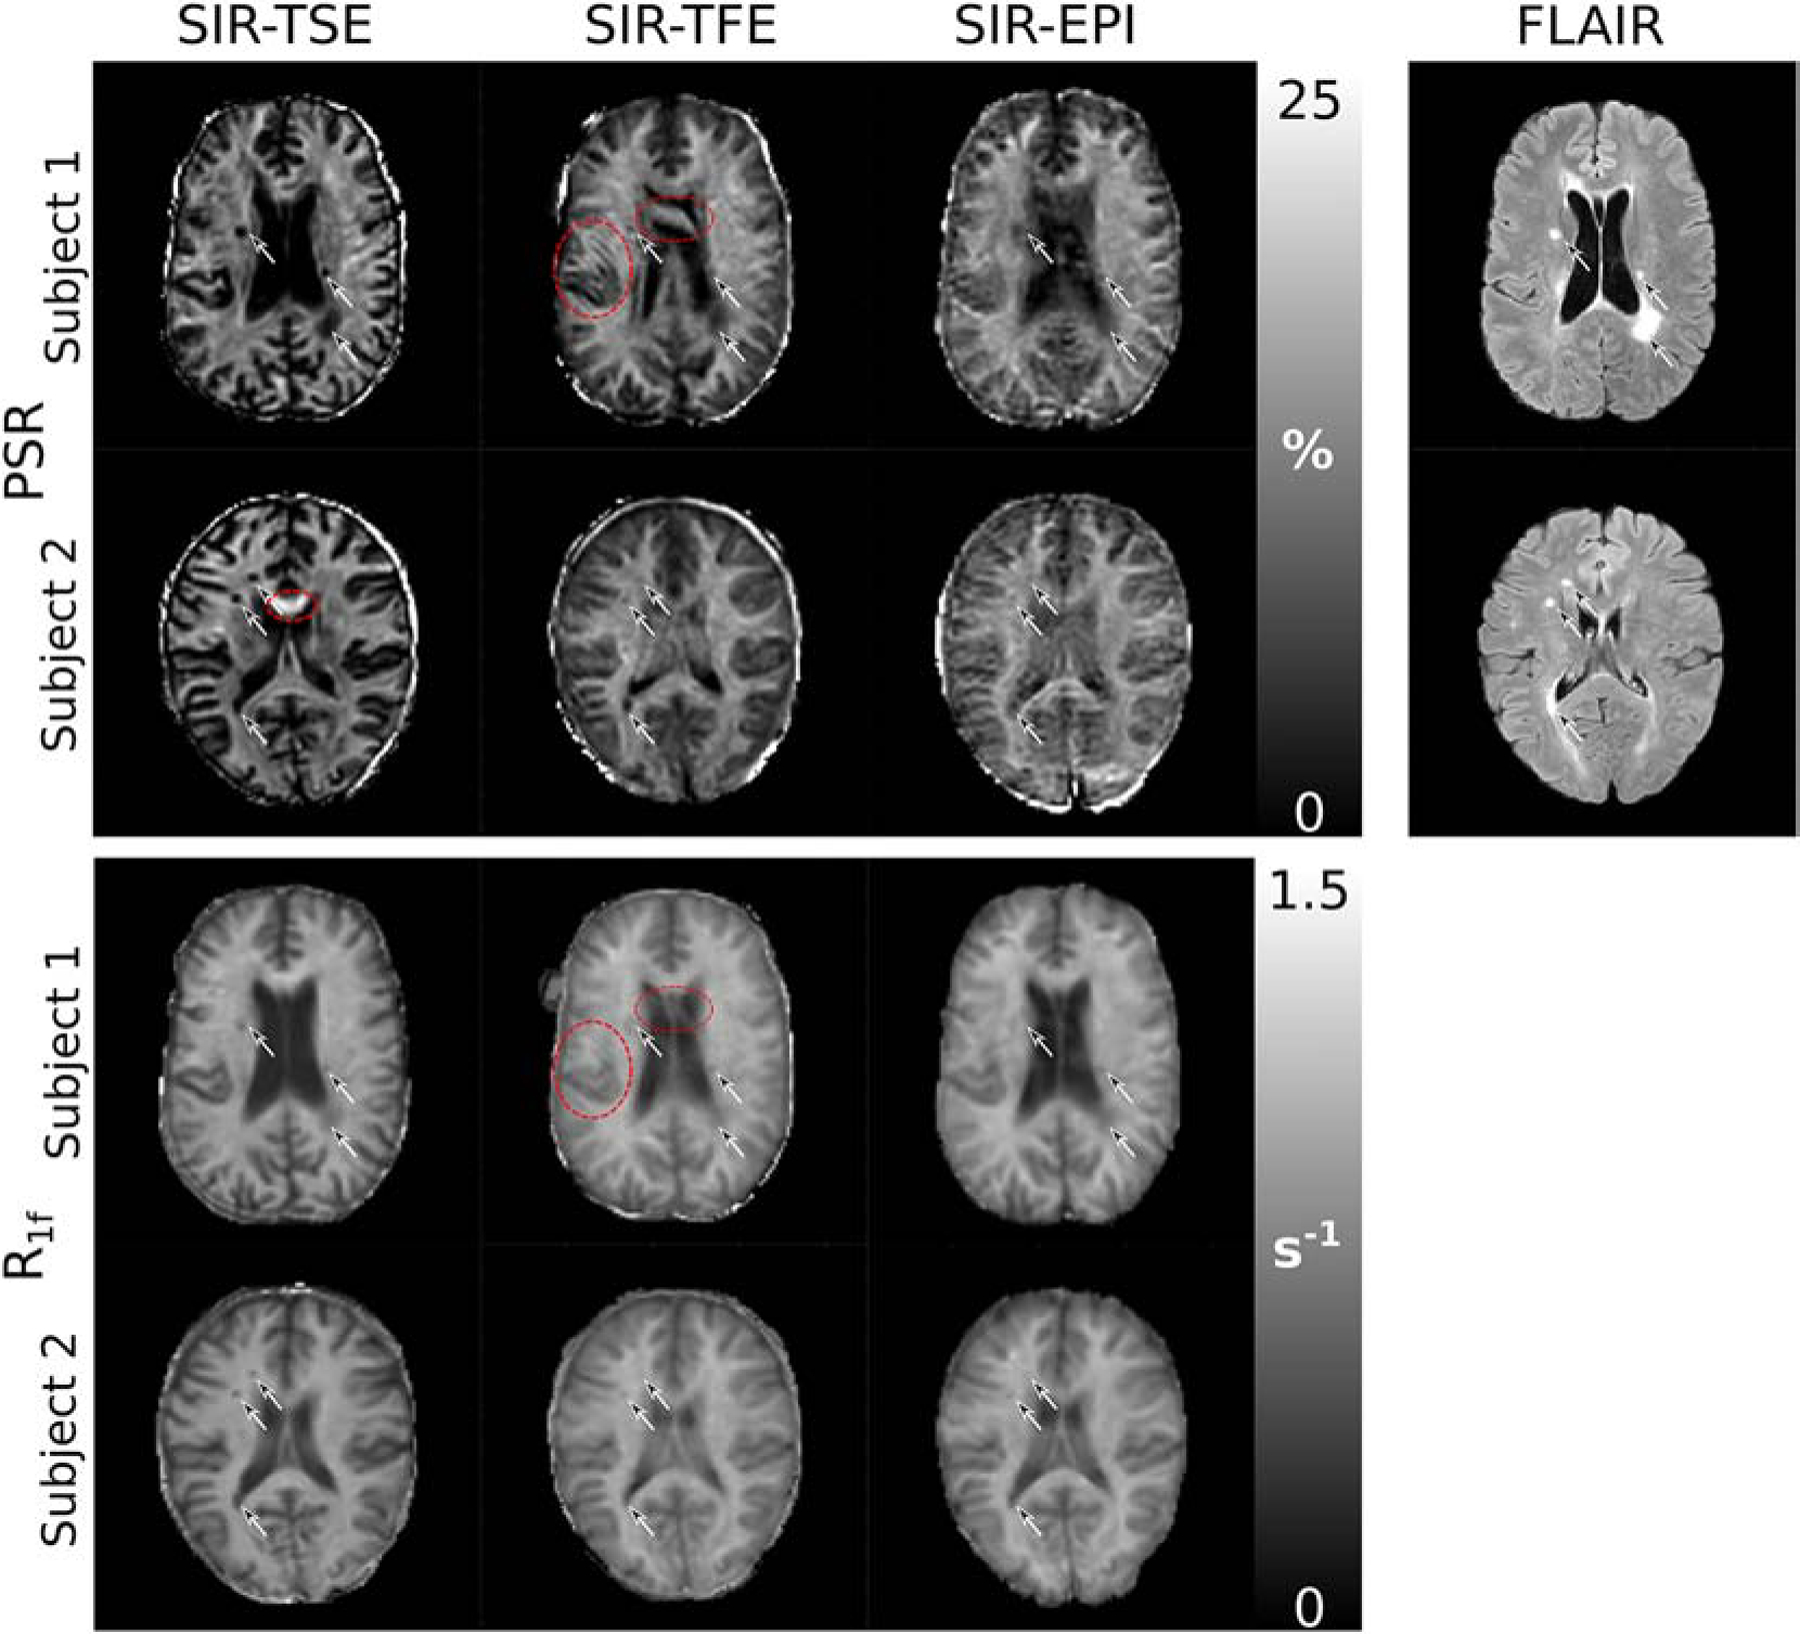
Representative slices from PSR, R1f, and FLAIR images derived from two patients with RRMS (top-to-bottom). Lesions of various sizes appear hyperintense in the FLAIR images (arrows), and hypointense in the PSR and R1f maps. Contrast between lesions and surrounding normal appearing white matter is reduced in the SIR-TFE and SIR-EPI data compared to the SIR-TSE data, which is likely due to the PSF of the TFE readout and distortion inherent in the EPI readout, respectively. The red circles indicate regions with artifactual values due to motion and/or partial volume averaging with surrounding CSF.
DISCUSSION
In this study, we used previously described optimized sampling schemes (Dortch, Bagnato et al. 2018) and accelerated MRI readouts to acquire whole-brain SIR measurements with scan durations as low as 7 minutes, opening the door to wider use of SIR in clinical settings. Comparison of SIR-derived PSR and R1f values acquired with TSE, EPI, and TFE readout schemes showed that significant time savings were achieved using EPI and TFE readouts (7–10 minutes) over TSE readouts (18 minutes). While data from the EPI acquisitions, particularly in the PSR images, were compromised by the image artifacts inherent in this readout scheme (Figure 4), the TFE data both offer the greatest time efficiency and images free of any obvious artifacts. This does, however, come at the cost of inherent smoothing due to the PSF of the readout; therefore, further study is needed to validate the use of accelerated SIR acquisitions in clinical applications, particularly where structures of interest are small relative to the resolution of the images. Finally, ROI analyses showed agreement between PSR and R1f values derived from the different readouts along with acceptable levels of scan-rescan reliability.
ROI analysis of the PSR derived from TSE, TFE and EPI protocols presented here showed good agreement with previous studies of qMT in the human brain, which have reported PSR values in the range of 10–16% and 3–8% for WM and GM structures, respectively (Sled and Pike 2001, Sled, Levesque et al. 2004, Yarnykh and Yuan 2004, Underhill, Yuan et al. 2009, Dortch, Li et al. 2011). The range of R1f values from all sampling schemes reported here in GM and WM were also consistent with reported observed T1 values from monoexponential models in brain tissue at 3T (Wright, Mougin et al. 2008) as well as previous reports of R1f by Dortch et al. (Dortch, Bagnato et al. 2018).
The SIR model eliminates the need for separate B0, B1, and T1 measurements (Gochberg and Gore 2007); however, this typically comes with the cost of increased scan times. To-date, this has significantly restricted the practicality of using SIR in both research and clinical settings due to issues related to subject tolerance, scanner availability, and costs. Previous work developed short-TR models (Gochberg and Gore 2007) and optimized sampling schemes (Dortch, Bagnato et al. 2018) to improve this efficiency. Here, these previous developments were combined with efficient 3D readouts along with SENSE and partial-Fourier accelerations to perform whole-brain SIR within clinically feasible scan times. Another advantage of the SIR method is the use of a low-power on-resonance inversion pulse in place of a higher-power saturation pulse used in conventional qMT methods. This allows SIR imaging to be carried out with significantly reduced SAR (Gochberg, Kennan et al. 1997, Gochberg and Gore 2003), which may be beneficial in SAR-limited applications (e.g., in patients with metal implants) or at higher magnetic field strengths.
While the SIR protocols presented here offer improved efficiency when compared to previously reported methods, they are subject to limitations. The SIR-TSE data offer the highest fidelity, being free from both the inherent distortions of the SIR-EPI data and the increased PSF of the SIR-TFE data, but take 18 minutes to acquire, so that compromises may have to be made in terms of FOV or spatial resolution. In contrast, the SIR-TFE acquisition is the most time-efficient, but the increased blurring relative to the SIR-TSE acquisition may compromise the resolution and fidelity of the qMT values in small structures or at tissue boundaries. In this study, these compromises manifested in the reduced contrast between PSR and R1f in RRMS lesions relative to surrounding NAWM. Future work will investigate alternate k-space trajectories and/or modulating of the flip angle during the TFE readout to minimize this effect, although this would require modifications to the SIR model and an increased sensitivity to B1+ errors.
For all readouts, the optimized sampling schemes may also come at the cost of potential bias in the estimated parameter maps. For example, the assumption of a fixed kmf value introduces a risk of bias in the calculated PSR and R1f values in tissue where the true kmf varies (for example, differences have been observed in the grey matter between MS patients and healthy controls (McKeithan, Lyttle et al. 2019)), however previous work has shown this has a minimal effect on the SIR-qMT model used here in both normal and RRMS brain tissue (Dortch, Bagnato et al. 2018). Furthermore, one of the acquisitions used a relatively short tD (10 ms), which may introduce a non-negligible sensitivity to any deviation to the nulling of Mz by the “reset” pulses. Such a deviation could both bias the fitting of the SIR model and vary between the sequences using 90° and 180° “reset” pulses; thus, accounting for some of the observed differences between the SIR-TSE and the SIR-TFE/SIR-EPI results in this work. Future work will more closely study the potential impact of these factors.
Nevertheless, these optimized readouts offer significant improvements in efficiency and stabilize the fitting procedure in the presence of partial volume effects. As a result, the techniques presented here significantly expand the circumstances under which SIR may be practically applied. In addition to the technical developments described above, future clinically oriented work will focus on the application of the method in a larger cohort of RRMS patients and validation in postmortem tissue.
CONCLUSIONS
This study combines optimized, short-TR SIR acquisitions with 3D TSE, TFE, and EPI readouts and SENSE/partial-Fourier acceleration techniques. Together, these approaches allow for whole-brain SIR-qMT to be acquired at 2.2×2.2×3 mm3 resolution in as little as 7 minutes. ROI analysis shows good inter-readout and scan-rescan reliability of PSR and R1f values derived from these sequences, and these values were broadly consistent with those previously reported in the literature.
ACKNOWLEDGEMENTS
This work was supported NIH/NINDS R01 NS097821 (RDD), R01CA184693 (DG), NIH/NCI R01CA109106 (JG and JZ). We thank Leslie McIntosh, Kristen George-Durrett, Clair Jones, and Chris Thompson for their help with data acquisition.
Financial Disclosures:
This work was supported by NIH/NINDS R01 NS97821 (RDD), R01CA184693 (DG), NIH/NCI R01CA109106 (JG and JZ)
Footnotes
Publisher's Disclaimer: This is a PDF file of an unedited manuscript that has been accepted for publication. As a service to our customers we are providing this early version of the manuscript. The manuscript will undergo copyediting, typesetting, and review of the resulting proof before it is published in its final form. Please note that during the production process errors may be discovered which could affect the content, and all legal disclaimers that apply to the journal pertain.
CRediT author statement
Matthew J. Cronin: Methodology, Software, Validation, Formal Analysis, Investigation, Data Curation, Writing - Original Draft, Writing - Review & Editing, Visualization
Junzhong Xu: Methodology, Funding Acquisition, Writing - Review & Editing
Francesca Bagnato: Supervision, Writing - Review & Editing
Daniel F. Gochberg: Conceptualization, Methodology, Funding Acquisition, Writing - Review & Editing
John C. Gore: Conceptualization, Funding Acquisition, Writing - Review & Editing
Richard D. Dortch: Conceptualization, Methodology, Software, Validation, Formal Analysis, Resources, Writing - Original Draft, Writing - Review & Editing, Visualization, Project Administration, Funding Acquisition
BIBLIOGRAPHY
- Andersson JL, et al. (2003). “How to correct susceptibility distortions in spin-echo echo-planar images: application to diffusion tensor imaging.” Neuroimage 20(2): 870–888. [DOI] [PubMed] [Google Scholar]
- Battiston M., et al. (2019). “Fast bound pool fraction mapping via steady-state magnetization transfer saturation using single-shot EPI.” Magnetic Resonance in Medicine. [DOI] [PubMed]
- Berry I., et al. (1999). “A multicenter measurement of magnetization transfer ratio in normal white matter.” Journal of Magnetic Resonance Imaging: An Official Journal of the International Society for Magnetic Resonance in Medicine 9(3): 441–446. [DOI] [PubMed] [Google Scholar]
- Constable RT and Gore JC (1992). “The loss of small objects in variable TE imaging: implications for FSE, RARE, and EPI.” Magnetic Resonance in Medicine 28(1): 9–24. [DOI] [PubMed] [Google Scholar]
- Dortch RD, et al. (2018). “Optimization of selective inversion recovery magnetization transfer imaging for macromolecular content mapping in the human brain.” Magnetic Resonance in Medicine 80(5): 1824–1835. [DOI] [PMC free article] [PubMed] [Google Scholar]
- Dortch RD, et al. (2011). “Quantitative magnetization transfer imaging in human brain at 3 T via selective inversion recovery.” Magn Reson Med 66(5): 1346–1352. [DOI] [PMC free article] [PubMed] [Google Scholar]
- Dortch RD, et al. (2011). “Quantitative magnetization transfer imaging in human brain at 3 T via selective inversion recovery.” Magnetic Resonance in Medicine 66(5): 1346–1352. [DOI] [PMC free article] [PubMed] [Google Scholar]
- Dortch RD, et al. (2013). “Quantitative magnetization transfer imaging of human brain at 7 T.” Neuroimage 64: 640–649. [DOI] [PMC free article] [PubMed] [Google Scholar]
- Dortch RD, et al. (2013). “Quantitative magnetization transfer imaging of human brain at 7 T.” Neuroimage 64: 640–649. [DOI] [PMC free article] [PubMed] [Google Scholar]
- Edzes HT and Samulski ET (1977). “Cross relaxation and spin diffusion in the proton NMR of hydrated collagen.” Nature 265(5594): 521. [DOI] [PubMed] [Google Scholar]
- Gochberg DF and Gore JC (2003). “Quantitative imaging of magnetization transfer using an inversion recovery sequence.” Magn Reson Med 49(3): 501–505. [DOI] [PubMed] [Google Scholar]
- Gochberg DF and Gore JC (2003). “Quantitative imaging of magnetization transfer using an inversion recovery sequence.” Magnetic Resonance in Medicine: An Official Journal of the International Society for Magnetic Resonance in Medicine 49(3): 501–505. [DOI] [PubMed] [Google Scholar]
- Gochberg DF and Gore JC (2007). “Quantitative magnetization transfer imaging via selective inversion recovery with short repetition times.” Magn Reson Med 57(2): 437–441. [DOI] [PMC free article] [PubMed] [Google Scholar]
- Gochberg DF and Gore JC (2007). “Quantitative magnetization transfer imaging via selective inversion recovery with short repetition times.” Magnetic Resonance in Medicine: An Official Journal of the International Society for Magnetic Resonance in Medicine 57(2): 437–441. [DOI] [PMC free article] [PubMed] [Google Scholar]
- Gochberg DF, et al. (1997). “Quantitative studies of magnetization transfer by selective excitation and T1 recovery.” Magnetic Resonance in Medicine 38(2): 224–231. [DOI] [PubMed] [Google Scholar]
- Greve DN and Fischl B. (2009). “Accurate and robust brain image alignment using boundary-based registration.” Neuroimage 48(1): 63–72. [DOI] [PMC free article] [PubMed] [Google Scholar]
- Henkelman RM, et al. (1993). “Quantitative interpretation of magnetization transfer.” Magnetic Resonance in Medicine 29(6): 759–766. [DOI] [PubMed] [Google Scholar]
- Jenkinson M., et al. (2002). Perturbation calculation of B0 field for non-conducting materials. Proc. Int. Soc. of Magnetic Resonance in Medicine.
- Jenkinson M., et al. (2004). “Perturbation method for magnetic field calculations of nonconductive objects.” Magnetic Resonance in Medicine 52(3): 471–477. [DOI] [PubMed] [Google Scholar]
- Li K., et al. (2010). “Optimized inversion recovery sequences for quantitative T1 and magnetization transfer imaging.” Magnetic Resonance in Medicine 64(2): 491–500. [DOI] [PMC free article] [PubMed] [Google Scholar]
- McKeithan LJ, et al. (2019). “7T quantitative magnetization transfer (qMT) of cortical gray matter in multiple sclerosis correlates with cognitive impairment.” Neuroimage 203: 116190. [DOI] [PMC free article] [PubMed] [Google Scholar]
- Mugler III JP and Brookeman JR (1990). “Three-dimensional magnetization-prepared rapid gradient-echo imaging (3D MP RAGE).” Magnetic Resonance in Medicine 15(1): 152–157. [DOI] [PubMed] [Google Scholar]
- Ou X., et al. (2009). “The MT pool size ratio and the DTI radial diffusivity may reflect the myelination in shiverer and control mice.” NMR in Biomedicine: An International Journal Devoted to the Development and Application of Magnetic Resonance In vivo 22(5): 480–487. [DOI] [PMC free article] [PubMed] [Google Scholar]
- Schmierer K., et al. (2004). “Magnetization transfer ratio and myelin in postmortem multiple sclerosis brain.” Annals of neurology 56(3): 407–415. [DOI] [PubMed] [Google Scholar]
- Sled JG, et al. (2004). “Regional variations in normal brain shown by quantitative magnetization transfer imaging.” Magnetic Resonance in Medicine: An Official Journal of the International Society for Magnetic Resonance in Medicine 51(2): 299–303. [DOI] [PubMed] [Google Scholar]
- Sled JG and Pike GB (2001). “Quantitative imaging of magnetization transfer exchange and relaxation properties in vivo using MRI.” Magnetic Resonance in Medicine: An Official Journal of the International Society for Magnetic Resonance in Medicine 46(5): 923–931. [DOI] [PubMed] [Google Scholar]
- Smith SM (2002). “Fast robust automated brain extraction.” Human brain mapping 17(3): 143–155. [DOI] [PMC free article] [PubMed] [Google Scholar]
- Smith SM, et al. (2004). “Advances in functional and structural MR image analysis and implementation as FSL.” Neuroimage 23: S208–S219. [DOI] [PubMed] [Google Scholar]
- Underhill HR, et al. (2011). “Fast bound pool fraction imaging of the in vivo rat brain: association with myelin content and validation in the C6 glioma model.” Neuroimage 54(3): 2052–2065. [DOI] [PMC free article] [PubMed] [Google Scholar]
- Underhill HR, et al. (2009). “Direct quantitative comparison between cross-relaxation imaging and diffusion tensor imaging of the human brain at 3.0 T.” Neuroimage 47(4): 1568–1578. [DOI] [PubMed] [Google Scholar]
- Wolff SD and Balaban RS (1989). “Magnetization transfer contrast (MTC) and tissue water proton relaxation in vivo.” Magnetic Resonance in Medicine 10(1): 135–144. [DOI] [PubMed] [Google Scholar]
- Wright PJ, et al. (2008). “Water proton T 1 measurements in brain tissue at 7, 3, and 1.5T using IR-EPI, IR-TSE, and MPRAGE: results and optimization.” Magnetic Resonance Materials in Physics, Biology and Medicine 21(1–2): 121–130. [DOI] [PubMed] [Google Scholar]
- Xu J., et al. (2014). “Quantitative magnetization transfer imaging of rodent glioma using selective inversion recovery.” NMR Biomed 27(3): 253–260. [DOI] [PMC free article] [PubMed] [Google Scholar]
- Yarnykh VL (2012). “Fast macromolecular proton fraction mapping from a single off-resonance magnetization transfer measurement.” Magnetic Resonance in Medicine 68(1): 166–178. [DOI] [PMC free article] [PubMed] [Google Scholar]
- Yarnykh VL and Yuan C. (2004). “Cross-relaxation imaging reveals detailed anatomy of white matter fiber tracts in the human brain.” Neuroimage 23(1): 409–424. [DOI] [PubMed] [Google Scholar]
- Yushkevich PA, et al. (2006). “User-guided 3D active contour segmentation of anatomical structures: significantly improved efficiency and reliability.” Neuroimage 31(3): 1116–1128. [DOI] [PubMed] [Google Scholar]


