

Abstract
Background:
Multifood Oral Immunotherapy (mOIT) with adjunctive anti-IgE (omalizumab, Xolair®) treatment affords safe, effective, and rapid desensitization to multiple foods, although the specific immune mechanisms mediating this desensitization remain to be fully elucidated.
Methods:
Participants in our phase 2 mOIT trial (NCT02643862) received omalizumab from baseline to week 16 and mOIT from week 8 to week 36. We compared the immune profile of PBMCs and plasma taken at baseline, week 8 and week 36 using high-dimensional mass cytometry, component-resolved diagnostics, the indirect basophil activation test, and Luminex.
Results:
We found (i) decreased frequency of IL4+ peanut-reactive CD4+ T cells and a marked downregulation of GPR15 expression and CXCR3 frequency among γδ and CD8+ T cell subsets at week 8 during the initial, omalizumab-alone induction phase; (ii) significant upregulation of the skin-homing receptor CCR4 in peanut-reactive CD4+ T and Th2 effector memory (EM) cells and of cutaneous lymphocyte-associated antigen (CLA) in peanut-reactive CD8+ T and CD8+ EM cells (iii) downregulation of CD86 expression among antigen-presenting cell subsets; and (iv) reduction in pro-inflammatory cytokines, notably IL-17, at week 36 post-OIT. We also observed significant attenuation of the Th2 phenotype post-OIT, defined by downregulation of IL-4 peanut-reactive T cells and OX40 in Th2EM cells, increased allergen component-specific IgG4/IgE ratio, and decreased allergen-driven activation of indirectly sensitized basophils.
Conclusions:
This exploratory study provides novel comprehensive insight into the immune underpinnings of desensitization through omalizumab-facilitated mOIT. Moreover, this study provides encouraging results to support the complex immune changes that can be induced by OIT.
Keywords: Biologics, food allergy, IgE, immunotherapy and tolerance induction, immunotherapy clinical, lymphocytes
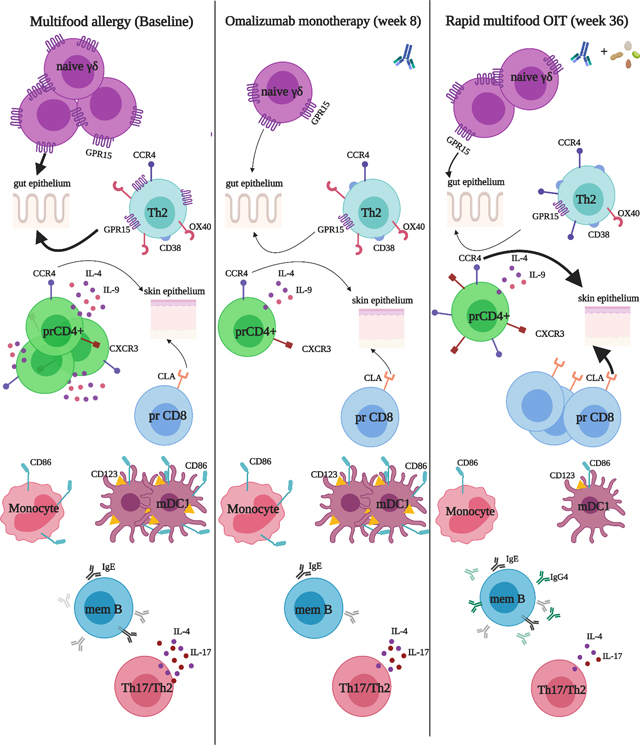
Graphical Abstract
Introduction
Food allergy, a major public health concern in the United States, affects ~8% of children under the age of 18, nearly 40% of whom suffer from allergies to multiple foods 1, a prevalence that is rising 2. Multi-food oral immunotherapy (mOIT), during which several food allergens are gradually introduced at increasing doses, provides safe and efficacious desensitization to multiple (2 to 5) offending foods 3. We and others have previously demonstrated that anti-IgE (omalizumab, Xolair®) combined with single-allergen OIT rapidly desensitized patients to single allergens such as milk or peanuts 4–8. Our phase 1/2 clinical trials 9–11 have demonstrated that incorporating omalizumab with mOIT also safely desensitizes patients with allergies to multiple foods. mOIT using omalizumab induction treatment is currently being tested in a phase 3 multicenter, placebo-controlled clinical trial (NCT03881696) under breakthrough designation by the FDA.
Previous analyses of PBMCs and plasma from OIT clinical trial participants have shown that desensitization is associated with (i) significant decreases in Th2-skewed allergen-specific CD4+ T cells coupled with a shift towards Th1-skewed response post-OIT 12, (ii) restored suppressor function of allergen-specific T-regulatory (Treg) cells post-OIT by reversing Th2-like Treg phenotype prevalent at baseline 13, and (iii) alterations in basophil reactivity but not Treg-cell frequency 14. Common features from these analyses included increases in allergen- and cognate component-specific IgG4/IgE ratios and decreases in basophil activation as evaluated by the expression of CD63, CD203 and/or histamine release 12, 14–16.
While some aspects of the immune mechanisms resulting in desensitization are becoming clearer, we lack a more comprehensive understanding of the biomarkers and immune pathways that drive the OIT-led desensitization to multiple foods, especially when facilitated with omalizumab. To address this gap in knowledge, we initiated a comprehensive mechanistic exploratory analysis of pre- and post-mOIT PBMCs and plasma from 30 study participants successfully desensitized through our phase 2 mOIT MAP-X trial: Multi oral immunotherapy in multi food Allergic Patients with Xolair induction (NCT02643862) 10. We hypothesized that mOIT would downregulate participants’ allergen-specific Type 2 response (i.e. IL4, IL9, IL13, OX40 expression). Based on previous studies, we expected that post-mOIT, participants’ plasma would show increased allergen-component-specific IgG4/IgE ratios, and decreased ability to sensitize basophils to activation on ensuing allergen challenge 12, 14–16. A secondary goal of our study was to understand the broad immune modulations brought about by treatment with omalizumab alone during the induction phase of the study, in contrast to those effected through allergen ingestion during the consequent mOIT phase. Therefore, we probed immune changes compared with baseline at two time points of the mOIT regimen: week 8 (omalizumab alone induction phase) and week 36 (after 16 weeks of omalizumab and 28 weeks of allergen-specific mOIT), compared with baseline.
Methods
Blood draws and processing
From each study participant, 40 mL blood was drawn by venipuncture at weeks 0, 8, 18, 24, and 36 over the course of treatment. In order to have blood drawn during the study, a participant had to not have a viral infection at the date of the sampling. Using validated, standardized, and published procedures 17, PBMCs and plasma isolated by Ficoll-based density gradient centrifugation were frozen in aliquots, and stored in liquid nitrogen at −80°C, respectively, until thawing for respective assays. In these analyses, we used samples taken at baseline (i.e., during the initial screening phase or at week 0 post-enrollment), week 8 (treatment with omalizumab alone), and week 36 (after 16 weeks of omalizumab and 28 weeks of mOIT) (Figure 1A). Our mechanistic analyses consisted of mass cytometry studies performed on peanut-stimulated PBMCs from the 15 participants who were successfully desensitized to peanut by treatment with omalizumab and mOIT, Luminex analysis of PBMC supernatants following a 4 hour-PMA/Ionomycin stimulation, component-resolved diagnostics (CRD) and the indirect BAT (iBAT) assay using participants’ plasma (Figure 1A, Figure S1).
Fig. 1.

(A) Timeline for administration of Omalizumab and OIT dosing to study participants. Time points of blood collection and performance of mechanistic assays are shown. (B) Overview of the assays that were performed for each participant, the foods in the OIT regimen that the active arm participants received and the foods in this panel to which the untreated controls were sensitized. One participant in the active arm failed the DBPCFC to egg at week 36 (highlighted in pink).
Mass Cytometry
Mass cytometry studies were performed using samples from the 15 participants from the active arm who were successfully desensitized to peanut and additional foods in their OIT. PBMCs taken at baseline, week 8, and week 36 from these 15 peanut-allergic, peanut-treated participants were thawed and rested overnight at 37°C with 5% CO2 in a combination of RPMI, 10% FBS, and Pen-Strep. Cells were plated in a round-bottom, 96-well plate at the density of 3×10⁶ cells in culture with 300 μL RPMI, 5% FBS, Pen-Strep per well. To evaluate the allergen (peanut)-induced response, PBMCs were stimulated with 200 μg/mL peanut solution for 24 hours with the addition of brefeldin A (5 μg/mL; Biolegend, San Diego, CA) for the last 4 hours. Unstimulated cells treated with brefeldin A for 4 hours before harvesting served as controls. Cells were harvested and stained with a broad panel of metal-conjugated antibodies (Table S1), as previously published 18 with an added barcoding step post-permeabilizing the cells. In-house metal conjugation of purified antibodies as indicated in Table S1 was carried out using Maxpar antibody labeling kits (Fluidigm Co., South San Francisco, CA). Cell-ID 20-plex Palladium barcoding set (Fluidigm Co.) was used for barcoding according to manufacturer’s instructions. Barcoded and pooled samples were acquired on a Helios mass cytometer (Fluidigm Co.). Data normalization, concatenation and debarcoding were performed using CyTOF software (Fluidigm Co.).
We used conventional manual gating in our study since the adaptive cell subtypes of key interest include cell types which often comprise < 1–5% of total live cells, and are not captured efficiently using the existing unsupervised clustering approaches, although unsupervised clustering analysis has been used for immunophenotyping of peanut-allergic and -sensitized infants.19 The detailed manual gating scheme for CD3+ and CD3− subsets based on cognate lineage markers is illustrated in Figures S2 and S3, respectively. In these studies no significant differences were observed in frequencies of CD4+, CD8+, γδ T cells, NK cells or NKT cells. CD4+ and CD8+ T cells that expressed the activation markers CD69 and CD40L were defined as peanut-reactive.20 We identified frequencies (i.e., percentage or abundance among a defined parent subset) and median intensity (i.e., expression) values that were significantly different between the three evaluated time points.
Manual gating on raw data files was carried out using FlowJo v10 (FlowJo LLC., Ashland, OR). For each individual marker, plots for both the percentage of parent population expressing that marker (i.e. frequency) as well as median intensities of that marker are shown, while only the significant readout among the two is elaborated in the main text. Each mentioned fold change is a median fold change, and represents the median of individual intra-participant fold changes for a given feature.
GPR15 ligand chemotaxis assay
Equal numbers of thawed and overnight rested PBMCs per time point per participant (range: 0.75–1 million) for 5 participants were individually loaded in the top chamber of a 6.5 mm wide, 0.5 μM pore-size polycarbonate membrane insert (Corning) in 100 μL medium. Human GPR15 ligand (0, 125, 250 nM; provided by Klaus Seuwen, Novartis) was added to the respective bottom chamber in 600 μL medium. CXCL12 (100 nM) was used as a positive control. The cells in the bottom chamber were harvested post 3-hour incubation at 37°C, 5% CO2, and stained with FACS antibody cocktail (CXCR3-FITC, GPR15-PE, CD127-PerCPCy5.5, CD3-PECy7, γδ TCR-APC, CD4-APCCy7, CD25-BV421, CD45RA-BV510, CCR4-BV605, CD8-BV650). Data was analyzed using FlowJo v10. Percentage specific migration was calculated as migration to GPR15L minus migration to medium-alone control.
Food and component-specific IgE and IgG4
Food-specific and allergen component-specific IgE and IgG4 levels for all the study participants were measured by ImmunoCAP fluorescence enzyme immunoassay (Phadia Immunology reference Laboratory/Thermo Fisher scientific). IgG4 values for the components had an upper detection limit of 30 mgA/L and a lower detection limit of 0.1 mgA/L. Values at these detection limits were replaced with 31 mgA/L and 0.01 mgA/L, respectively. IgE values for the components had an upper detection limit of 100 kUA/L and a lower detection limit of 0.1 kUA/L. Values at these detection limits were replaced with 101 kUA/L and 0.01 kUA/L, respectively. IgE and IgG4 values for the whole foods were calculated from our previous work 10 to measure concentrations greater than the upper detection limits of the component data. Antibodies to the following food allergen components were measured: peanut (Ara h 1, Ara h 2, Ara h 3, Ara h 8, Ara h 9), hazelnut (Cor a 1, Cor a 8, Cor a 9, Cor a 14), walnut (Jug r 1, Jug r 3), cashew (Ana o 3), egg white (Gal d 1, Gal d 2, Gal d 3), and cow’s milk (Bos d 4, Bos d 5, Bos d 8).
Indirect BAT
Indirect BAT (iBAT) 21, 22 was performed on baseline and week 36 plasma from 11 peanut-treated participants and 5 untreated peanut-allergic controls using the Flow CAST Basophil Activation Test kit (Bühlmann Laboratories, Schönenbuch, Switzerland) per manufacturer’s instructions. Briefly, 50 μL aliquots of non-peanut allergic whole blood were sensitized with 20% pre- or post-OIT plasma from test participants in 100 μL basophil stimulation buffer at 37°C in a water bath for 2 hours. Samples were incubated for 15 minutes at 37°C with 2 μg/mL peanut extract and Flow CAST staining reagent (including CCR3 and CD63). An anti-FcεRI mAb and N-formyl-L-methionyl-L-leucyl-phenylalanine (fMLP) were used as positive controls for IgE mediated and non-IgE mediated basophil activation. After simultaneous erythrocyte lysis and fixing, cells were washed and subjected to flow cytometry. Basophils were identified as SSClowCCR3+ cells, and activation was measured by CD63 expression. In independent control experiments, cells in this gate were confirmed to be uniformly CD123+CD3−CD19−FcγRI+IgE+c-kit− basophils. A minimum of 200 basophils were obtained for each sample. Peripheral blood from non-peanut allergic adult donors was obtained with approval from the Institutional Review Board of Boston Children’s Hospital. Blood was drawn in sodium heparin tubes and used within 1 hour of obtaining the sample. Four replicates were measured per participant time point.
Luminex assay
Thawed and overnight rested PBMCs for each time point for 16 participants were plated in a 96-well plate at the density of 1×10⁶/mL (0.2 ×10⁶ per well) in quadruplicate. Two wells were stimulated with 20 ng/mL PMA plus 1 μg/mL ionomycin (Sigma-Aldrich) for 4 hours, while the other two wells were left unstimulated. A total of 120 μL culture supernatant was harvested per well in prelabeled microfuge tubes, spun at 300g for 10 minutes at 4°C, followed by a second spin at 10,000g for 10 minutes at 4°C. A total of 100 μL supernatant was transferred to fresh, prelabeled microfuge tubes, and stored at −80°C until performing the assay. All the supernatant samples were measured in a single batch using a Human 41-plex Cytokine/Chemokine magnetic bead panel (MilliporeSigma, Burlington, MA).
Statistics
The statistical analyses were performed in R (version 3.5.2) and GraphPad Prism (version 8.0.2), and plotting was carried out using the ggplot2 R package 23 (version 3.1.0). All statistical tests were performed two-sided. In the boxplots, medians are shown, and the ‘hinges’ represent the first and third quartile. The whiskers are the smallest and largest values after exclusion of outliers (greater than the 75th percentile plus 1.5 times the interquartile range (IQR), or less than 25th percentile minus 1.5 times the IQR).
Mass cytometry dataset:
The individual frequencies and median intensities were compared between the three time points using a linear mixed effects model with participant and batch (5 batches) as random effects. P values were determined by χ2 test (2 degrees of freedom [DF]), and to adjust for multiple comparisons we controlled the false discovery rate (FDR) as described by Benjamini and Hochberg 24 to be no more than 0.20 for this exploratory analysis. For each of the features (frequencies or median intensities) showing a significant difference between the three time points, a post-hoc analysis by a series of additional mixed effects models and χ2 tests (1 DF) between 2 time points were performed.
GPR15 ligand chemotaxis assay dataset:
For each participant, percent specific migration at a given time point (baseline, week 8, or week 36) was compared pairwise to another time point among the remaining two time points using the Wilcoxon signed-rank test.
IgE and IgG4 dataset:
IgE and IgG4 levels, as well as IgG4/IgE ratios, were compared for each food and component between baseline and week 36 using the Wilcoxon signed-rank test. P values were adjusted for multiple hypothesis testing using the approach by Benjamini and Hochberg. The resulting FDR-adjusted P values were noted as Q values in the figure.
Indirect BAT assay dataset:
The median values of the replicates were compared between baseline and week 36 using the Wilcoxon signed-rank test.
Luminex dataset:
Luminex panel (Cat. No.: HCYTMAG-60K-PX41, EMD Millipore Sigma); Markers evaluated: sCD40L, EGF, Eotaxin/CCL11, FGF-2, Flt-3 ligand, Fractalkine, G-CSF, GM-CSF, GRO, IFN-α2, IFN-γ, IL-1α, IL-1β, IL-1ra, IL-2, IL-3, IL-4, IL-5, IL-6, IL-7, IL-8, IL-9, IL-10, IL-12 (p40), IL-12 (p70), IL-13, IL-15, IL-17A, IP-10, MCP-1, MCP-3, MDC (CCL22), MIP-1α, MIP-1β, PDGF-AA, PDGF-AB/BB, RANTES, TGF-α, TNF-α, TNF-β, VEGF was used in these experiments. The median fluorescence intensity (MFI) values for unstimulated and PMA/Ionomycin-stimulated supernatants were individually compared between the three time points using Friedman rank sum test. To adjust for multiple comparisons, we controlled the FDR as described by Benjamini and Hochberg to be no more than 0.20 for this exploratory analysis. For changes in cytokine/chemokine expression found to be significant, a post-hoc analysis between two time points was performed using the Wilcoxon signed-rank test. Linear regression analysis was performed to assess potential correlation among fold downregulation at week 36 (MFI at week 36/ MFI at baseline or week 8) and the number of food allergens in the OIT mix.
Study approval
The Institutional Review Board of Stanford University School of Medicine approved the protocol. Written informed consent was obtained from parents or guardians of all study participants along with assent from participants of age 7 years and older. This study was registered on ClinicalTrials.gov (NCT02643862).
Results
Study participants and analytical approach
The study design, protocol, clinical endpoints and outcomes, and demographic details of the complete cohort of 48 study participants (n=36 in the omalizumab arm, n=12 in the placebo arm) have been previously published 10. As previously published in the clinical trial (NCT02643862) description 10, active arm participants received omalizumab from baseline to week 16 and mOIT from week 8 to week 36 (Figure 1A). Baseline demographic characteristics of the 30 successfully desensitized active arm participants, 15 of whom were desensitized to peanut among other foods, and 12 non-randomized, untreated control participants are summarized in Table S2. The 30 active-arm trial participants were between 4 and 15 years of age with an approximately equal distribution of males and females. At study entry, median plasma IgE levels of the 30 active study participants was significantly elevated (median 425 kU/L, range 76.6 to 1492.0). Most active arm participants entered the trial with a history of atopic dermatitis (80%) and/or allergic rhinitis (76.7%), with 40% also reporting a history of asthma. The 12 control participants shared the same eligibility criteria as the active arm participants but they declined the active study due to work schedules of the parents. Similar to the active study participants, control participants entered the trial with a history of atopic dermatitis (83.4%) and/or allergic rhinitis (75%), with 58.3% reporting a history of asthma. For the mechanistic studies described here we utilized samples from the 30 participants who were originally enrolled in the active arm of the trial and were successfully desensitized. Time points of blood collection and mechanistic assays are shown in Figure 1A. The foods in the OIT regimen that the active arm participants received and the foods in the panel to which the untreated controls were sensitized are shown in Figure 1B.
Induction phase with omalizumab treatment alone leads to decreased frequency of IL4+ peanut-reactive CD4+ T cells and downregulation of GPR15
To probe immune changes that occurred following omalizumab treatment, mass cytometry studies were performed on peanut-stimulated PBMCs from the 15 participants who were successfully desensitized to peanut by treatment with omalizumab and mOIT. We screened our mass cytometry dataset to identify significant differences in a baseline to week 8 comparison (i.e. omalizumab-alone induction phase). We observed a significant decrease in the frequency of GPR15+ peanut-reactive CD8+ T cells (CD69+ CD8+) (fold change = 0.7, P=0.0097), and GPR15 median intensity in CD8+ EM (CD8+ CD69− CD45RA− CCR7− CD27+) and in Th2 EM cells (CD4+ CD127+ CD45RA− CCR7− CD27+ CCR4+ CXCR3−) at week 8 compared to baseline (respective fold change and P value: 0.94, P=0.0086; 0.71, P=0.02). Moreover, a significantly reduced frequency of GPR15+ naïve γδ T cells (γδ TCRhi CD3hi CD45RAhi CD27hi) was also observed at week 8 compared to baseline (0.79, P=0.003) (Figure 2A). The observed downmodulation of GPR15 was retained in peanut-reactive CD8+ and Th2 EM cell subsets through week 36, although it was partially restored in some participants for naïve γδ T and CD8+ EM cells.
Fig. 2. Induction phase with anti-IgE treatment alone leads to downregulation of GPR15 and peanut (allergen)-induced IL-4.

Mass cytometry dataset on ex vivo peanut-stimulated baseline, week 8 and week 36 PBMCs from 15 peanut-treated participants was screened to identify significant differences between baseline and week 8. For each significant feature, the corresponding frequency and median expression plots are shown. (A) The frequency of GPR15+ peanut-reactive CD8+ T cells, the median expression of GPR15 among CD8+ EM and Th2 EM cells, and the frequency of GPR15+ naïve γδ T cells was significantly downregulated at week 8 compared to baseline. (B) Reduced percentage of naïve γδ T cells among week 8 vs. baseline PBMCs migrating to GPR15L placed in the lower chamber of a transwell. % Specific migration = % migrated towards GPR15L minus mean basal % migration to control medium (pairwise P value by Wilcoxon signed-rank test; P < 0.05 considered significant. Note: For n=5, the lowest possible P value in a Wilcoxon signed-rank test is 0.0625.). (C) The frequency of IL4+ peanut-reactive CD4+ T cells decreased significantly at week 8 vs. baseline. (For A and C: Pairwise P value by χ2 test < 0.05 considered significant. Pairwise P values were computed only when linear mixed effects models including the three time points had an FDR-adjusted P < 0.2 by χ2 tests.)
GPR15L has been recently characterized as a bona fide ligand for GPR15 25, 26, and we therefore assayed the chemotactic migration potential of naïve γδ T cells at each time point to evaluate the functional implications of decreased GPR15 expression. As anticipated, naïve γδ T cells demonstrated a dose-dependent (at 125 nM and 250 nM) reduced migration towards GPR15L from baseline to week 8 and to week 36, although the differences did not reach statistical significance in the assayed subset of 5 participants (Figure 2B).
In addition, the frequency of IL4+ peanut-reactive CD4+ T cells (CD69+ CD40L+ CD4+) was significantly decreased in the week 8 vs. baseline comparison (fold change=0.68, P=0.011; Figure 2C), and this reduced percentage of IL4+ peanut-reactive CD4+ T cells was retained through week 36. The frequency of another Th2-associated cytokine, IL9-expressing peanut-reactive CD4+ T cells, showed a similar, although statistically non-significant trend (FDR-adjusted P value > 0.2; Figure S4A).
The frequency of memory γδ T cells (γδ TCRlo CD3lo CD45RAlo CD27lo) and peanut-reactive and total CD8+ EM cells expressing the Th1-polarization surrogate marker CXCR3 was significantly decreased at week 8 compared to baseline (respective fold change and P value: 0.93, P=0.024; 0.92, P=0.026; 0.9, P=0.0067) (Figure S4B). However, for each of these subsets, the frequency of CXCR3+ cells was restored to the baseline level by week 36, rendering this change transient. In addition, Th2 EM cells showed an increase in the median intensity of the activation marker CD38 from baseline to week 8 (P= 0.047) (Figure S4C). This increase became more evident by week 36, and is further discussed in the following section. Lastly, we observed a decrease in the frequency of Teffectors (Teff; CD127+ CD25lo), and a concomitant modest increase in the frequency of Tregs (CD25hi CD127−) among total non-peanut-reactive (CD69− CD40L−) CD4+ T cells at week 8 compared to baseline (respective fold change and P value: 0.97, P=0.012; 1.07, P= 0.032) (Figure S4D). The frequencies of Teffectors as well as Tregs were restored to levels similar to those at baseline by week 36.
Allergen ingestion through mOIT enhances skin-homing potential, and modulates activation marker expression of select T cell subsets
To understand immunomodulation induced through allergen ingestion during the OIT phase of mOIT regimen, we examined immune changes unique to week 8 vs. week 36 and baseline vs. week 36 comparisons. Comparisons of week 36 to week 8 revealed a marked increase in skin-homing receptor CCR4 median intensity on peanut-reactive CD4+ T cells (fold change=1.3, P<0.001) and CD4+ EM cells (fold change= 1.17, P<0.001) (Figure 3A). We also noted an increased frequency of skin-homing marker CLA+ peanut-reactive CD8+ T cells (fold change=1.37, P= 0.024) and, to a modest extent, an increased frequency of CLA+ CD8+ EM cells (fold change=1.11, P=0.035) (Figure 3B).
Fig. 3. Allergen ingestion during mOIT enhances skin-homing potential, and modulates activation marker expression of select T cell subsets.

Mass cytometry dataset on ex vivo peanut-stimulated baseline, week 8 and week 36 PBMCs from 15 peanut-treated participants was screened to identify significant differences in week 8 vs. week 36 comparison. For each significant feature, the corresponding median expression or frequency plot is shown. (A) Increase in median expression of CCR4 on peanut-reactive CD4+ T cells and Th2 EM cells at week 36 vs. week 8. (B) Increase in the frequency of CLA+ peanut-reactive CD8+ T cells and CD8+ EM cells at week 36 vs. week 8. (C) The frequency of OX40+ Th2 EM cells was significantly downregulated at week 36 vs. week 8, and the frequency of PD1+ CD8+ EM, and median expression of PD1 on CD8+ EM cells, was decreased at week 36 vs. week 8. (Pairwise P value by χ2 test < 0.05 considered significant. Pairwise P values were computed only when linear mixed effects models including the three time points had an FDR-adjusted P < 0.2 by χ2 tests.)
Th2 EM cells demonstrated a reduced frequency of expression of Th2-polarization promoting costimulatory molecule OX40 27 at week 36 compared to week 8 (fold change= 0.81, P=0.028; Figure 3C). The frequency of peanut-reactive CD4+ T cells expressing OX40, as well as their OX40 expression level, showed a similar, although statistically non-significant, trend (FDR-adjusted P value > 0.2; Figure S5A). The frequency of inhibitory receptor PD1+CD8+ EM cells as well as the median intensity of PD1 on CD8+ EM cells was also downregulated at week 36 compared to baseline and week 8 (fold change and P value for frequency and median intensity, respectively, in week 36 vs. baseline comparison: 0.8 fold, P= 0.035; 0.94 fold, P= 0.008) (Figure 3C). In addition, increase in the median intensity of CD38 on Th2 EM cells at week 36 compared to baseline (fold change=1.1, P=0.012, Figure S4C). Importantly, in the setting of multifood OIT, the Th2 EM and CD8+ EM cell subsets outside the peanut-reactive gate would include CD4+ and CD8+ T cells responsive to other offending allergens. Thus, together these results suggest an enhancement of skin-homing potential and changes in activation of allergen-reactive T cell subsets following allergen ingestion.
In the context of an immune shift away from Th2 and towards Th1 phenotype, we observed a significant increase in the median intensity of CXCR3+ in peanut-reactive CD4+ T cells at week 36 compared to week 8 (fold change=1.2, P= 0.0099, Figure S5B). Despite this increased expression of CXCR3, an IFNγ–inducible chemokine receptor, no significant change was observed in the overall expression of IFNγ, or percentage of IFNγ+ peanut-reactive CD4+ T cells (Figure S5C). Also for other markers (GPR15, CLA, PD1), no statistically significant change of median intensity or frequency was observed in the peanut-reactive CD4+ T cells among the three time points (Figure S6).
Crucial role of allergen-specific OIT in immunomodulation of APC subsets
Most interestingly, it was at the week 36 time point that the most significant changes were observed among the evaluated APC subsets, viz., classical (CD14+), intermediate (CD14+ CD16+), and non-classical (CD16+) monocytes, myeloid dendritic cells 1 (mDC1; CD11c+ CD123+), myeloid dendritic cells 2 (mDC2; CD11c+ CD123−), and memory B cells (CD19+ CD27+). A decreased frequency of cells expressing, and /or the median intensity of CD86 at week 36 was an immunomodulation feature common to all these subsets (Figure 4A–C). In addition, mDC1s which express FcεRI and are implicated in promoting Th2 polarization 28 were significantly reduced in frequency at week 36 compared to baseline (fold change=0.59 fold, P= 0.0012) and also showed a significant downregulation of CD123 expression in week 36 vs. baseline comparison (fold change=0.82, P=0.0061) (Figure S5D). This result is consistent with a crucial role of allergen-specific OIT in immunomodulation of APC subsets.
Fig. 4. Role of allergen-specific OIT in immunomodulation of APC subsets.

Mass cytometry dataset on ex vivo peanut-stimulated baseline, week 8 and week 36 PBMCs from 15 peanut-treated participants was screened to identify significant differences in week 8 vs. week 36. For each significant feature, the corresponding median expression or frequency plot is shown. (A-C) Significant decrease in the frequency of cells expressing CD86, and/or the median expression of CD86, among the evaluated APC subsets at week 36 vs. week 8. (A) Monocyte subsets (viz. classical, intermediate and non-classical monocytes), (B) DC subsets (viz. mDC1 and mDC2) and (C) memory B cells. (Pairwise P value by χ2 test < 0.05 considered significant. Pairwise P values were computed only when linear mixed effects models including the three time points had an FDR-adjusted P < 0.2 by χ2 tests.)
mOIT regimen induced a significant increase in individual allergen component-specific IgG4, and dampened indirect basophil activation
B cells play a central role in the allergic cascade as a source of pathogenic IgE specific to the offending food allergen. We therefore evaluated individual allergen-component-specific IgE and IgG4 in plasma as B cell biomarkers, and assessed the function of these specific immunoglobulin subclasses through iBAT. In these assays employing IgE as a direct or indirect key readout, respectively, we compared the plasma at baseline with week 36 only since readouts with week 8 plasma would have been confounded due to omalizumab in the circulation during omalizumab induction therapy.
We probed the changes in cognate allergen-component-specific IgE and IgG4 post-mOIT in the 30 desensitized study participants and 12 untreated multifood allergic control patients. Figure 5A shows the color-coded component classes: (1) storage proteins (blue), (2) pathogenesis-related class-10 (PR-10; yellow) proteins, and (3) non-specific lipid transfer proteins (LTP; red) for peanut, hazelnut, walnut, and cashew, as well as individual components of egg and milk allergens. We observed significant increases in IgG4/IgE ratios for the storage protein class of components for peanut and tested tree nuts (hazelnut, walnut, cashew) (Q < 0.1, Figure 5A) at week 36 compared to baseline, primarily driven by a larger increase in IgG4 than the increase in IgE post-mOIT (Figures S7A–D). Each of the IgG4/IgE ratios for the 3 egg components tested were significantly increased at week 36 compared to baseline (Q < 0.1, Figure 5A). IgG4/IgE ratios for tested milk components, Bos d 4, 5, and 8, were significantly increased at week 36 compared to baseline (Q < 0.1, Figure 5A). By contrast, in the untreated controls, no significant change in the IgG4/IgE ratio was detected for any of the allergens or associated components (Figure 5B).
Fig. 5. Component-resolved diagnostics and indirect BAT.


(A) Cognate food-specific and allergen component-specific IgE and IgG4 was measured in baseline and week 36 plasma from 30 active participants desensitized through rapid multifood OIT (A) and 12 untreated multifood allergic controls (B). Components in the storage protein family of peanut and treenut allergens showed a marked increase in IgG4/IgE ratio. (P values calculated using Wilcoxon signed-rank test. FDR-adjusted P are shown as Q. Q < 0.1 were considered significant. [In (B), all Q = 1, thus not included in the figure] (C) Baseline and week 36 plasma from 11 active, peanut-allergic, peanut-treated participants desensitized by rapid multifood OIT, and 5 peanut-allergic untreated controls, was assessed for its potential to activate basophils (i.e., to increase frequency of CD63+ basophils) in whole blood from a healthy donor through the indirect BAT assay. (P values calculated using Wilcoxon signed-rank test. P < 0.05 considered significant.)
Plasma from food-allergic participants contains allergen-specific IgE that can passively sensitize basophils from nonallergic donors. These basophils, in which donor IgE is now bound to FcεRI, become activated upon in vitro allergen challenge, quantitated by the surface expression of CD63 in the iBAT assay using flow cytometry. This approach can be used to interrogate the sera of allergic patients for activating and/or suppressive antibodies. We performed iBAT assays for a subset of 16 peanut-allergic study participants [11 active arm (omalizumab + peanut-OIT) and 5 untreated controls]. Compared with participants’ plasma taken at baseline, paired plasma at week 36 significantly decreased basophil activation as reflected by CD63+ basophils in iBAT (Figure 5C, P=0.00098). As expected, plasma from each of the 5 untreated control participants isolated at the corresponding time points retained its ability to activate basophils on peanut stimulation, thus showing no significant change in %CD63+ basophils (Fig 5C, P > 0.05). Thus, the results of CRD and iBAT analysis were in agreement.
Downregulated Th2 and inflammatory cytokines post-OIT revealed through Luminex
Lastly, we sought to gain a broader insight into the cytokine and chemokine profile of baseline, week 8, and week 36 PBMCs stimulated non-specifically with PMA and Ionomycin. We employed 41-plex Luminex to evaluate cytokine profiles beyond our mass cytometry panel and investigated any potential impact of the total number of food allergens in the OIT mix in the context of this mOIT trial. Of the total (n=30) desensitized participants, we performed this analysis for n=16 participants, 4 each with 2, 3, 4, or 5 as the total number of food allergens in their respective OIT mix. Among the total 30 study participants, only 4 participants had 5 food allergens in their OIT mix, hence we chose n=4 per group.
Figure 6A and B illustrate heatmaps depicting cytokines and chemokines with significant (FDR-adjusted P < 0.2) expression changes in unstimulated and PMA/Ionomycin-stimulated PBMC supernatants, respectively. Notably, all the readouts identified to be statistically significant were down-modulations at week 36 compared to baseline or week 8; there were no significant changes in the baseline to week 8 comparisons. Expression of Th2 cytokines IL-13 and IL-9 in the unstimulated culture supernatants (Figure 6A), and expression of IL-4 in PMA/ionomycin-stimulated culture supernatants (Figure 6B), were found to be significantly decreased at week 36 compared to baseline and week 8, supporting a shift away from a Type 2 profile.
Fig. 6. OIT-induced decrease in Th2 cytokines and inflammation-associated cytokines and chemokines.

Culture supernatants harvested from baseline, week 8 and week 36 PBMCs from 16 (4 each for #FA = 2, 3, 4 and 5 respectively) study participants were assessed for 41 select cytokine and chemokines using Luminex. (A) Heatmap depicting cytokines and chemokines with significant expression changes in unstimulated supernatants. (B) Heatmap depicting cytokines and chemokines with significant expression changes in PMA/Ionomycin-stimulated supernatants. (C) Expression pattern for IL-4, IL-17, and FLT3L in PMA/Ionomycin-stimulated supernatants at the three assessed time points is highlighted with individual violin plots. (Pairwise P value by Wilcoxon signed-rank test < 0.05 considered significant. Pairwise P values were computed only when Friedman rank sum test including the three time points had an FDR-adjusted P < 0.2.)
Interestingly, cytokines down-modulated at week 36 post-OIT also included IL-17 in unstimulated as well as PMA/Ionomycin-stimulated culture supernatants (Figure 6A, B). Notably, multiple cytokines contributing to inflammatory pathways viz., IL-1β, MCP1, IL12p40 (unstimulated supernatants; Figure 6A) and IL-8, MIP1α (PMA/Ionomycin-stimulated supernatants; Figure 6B) showed reduced expression at week 36. In addition, Granulocyte-Macrophage Stimulating Factor (GMCSF) and FMS-like tyrosine kinase 3 (FLT3L), mediators crucial to DC differentiation and proliferation, were also found to be significantly decreased at week 36 (Figure 6A), thus possibly corroborating the observed decrease in the frequency of mDC1s. Expression patterns for IL-4, IL-17, and FLT3L, each found to be downregulated at week 36 compared to baseline, are highlighted in violin plots (Figure 6C). The expression of IFN-γ and IL-10 did not change significantly post-OIT. We did not find any significant correlation between the number of food allergens in the OIT mix and the observed fold decrease in IL-4, IL-17 and FLT3L at week 36 in these16 participants (data not shown).
Discussion
We performed a detailed mechanistic investigation to identify key immune changes associated with rapid OIT-induced desensitization. Previous evaluations of the mechanisms of successful OIT desensitization have primarily focused upon total and allergen-specific CD4+ T cell subsets, IgE and IgG4 readouts, and basophil activation tests 12–16. To examine additional cell types that have been historically neglected, we used high dimensional, multi-parametric assays, to identify alterations in cell types in addition to CD4+ T cells that occur during OIT, including subsets of CD8+, γδ, monocytes, DCs, and B cells. The findings from this exploratory study provide a clearer and more comprehensive picture of the dysregulated immune mechanisms and cell types driving atopy, and their possible reversal through omalizumab facilitated-OIT-induced desensitization.
Our analyses yielded several novel findings as well as results that confirmed previously published data. First, we found that treatment with omalizumab alone had immunomodulatory effects. Thus after 8 weeks of treatment with omalizumab alone the frequency of IL-4+ peanut-reactive CD4+ T cells was significantly decreased. In allergen-reactive CD8+ T cells and Th2 EM cells GPR15 expression was downregulated. Moreover, these changes continued through week 36 (after initiation of OIT at week 8). Important changes that occurred following the addition of OIT (observed at week 36) were (i) a significant upregulation of the skin-homing receptors CCR4 and CLA in CD4+ and CD8+ T effector memory cells, respectively, (ii) downregulation of CD86 expression among antigen-presenting cell subsets, and (iii) abatement of a Th17/Th2-skewed 20, 29–31, pro-inflammatory cytokine and chemokine milieu. We also confirmed at week 36 compared to baseline, a downregulation of T cells with a Th2 phenotype (through downregulation of IL-4, IL-9, OX40), an increase in allergen component-specific IgG4/IgE ratio, decreased basophil activation 12–16 and decreased CD86 expression on APC subsets as was also observed in a previous report of immune mechanisms of peanut-OIT 32. These results are summarized in Table S3.
The immunomodulatory effects of omalizumab alone in the context of OIT with omalizumab adjunctive treatment has been studied previously in the context of allergen-specific CD4+ T cells and basophils. Basophils from omalizumab-treated subjects were found to have decreased milk-induced CD63 expression relative to baseline 4 months after starting omalizumab, before initiating OIT14. In addition, Abdel-Gadir noted a sharp decrease in peanut-specific CD4+ T cell proliferation in patients tested 12 weeks after initiation of omalizumab therapy, prior to onset of OIT13. In our studies, we observed a significant decrease in IL-4+ peanut-reactive CD4+ T cells following 8 weeks of omalizumab treatment alone. Together with the observed downregulation of the homing receptor GPR15 in peanut-reactive CD8+ T cells and Th2 EM cells, these findings indicate that omalizumab alone reduces mast cell/basophil reactivity and downregulates the Type 2 inflammatory cascade. Consistent with this notion is the report that severe refractory atopic dermatitis patients treated with omalizumab for 24 weeks had strikingly decreased levels of cytokines involved in Th2 polarization including TSLP, OX40L, TARC and IL-933. In our studies, some changes observed after 8 weeks of omalizumab treatment were restored to baseline level by week 36. Studies are in progress to determine if treatment with omalizumab for a period longer than 16 weeks would be beneficial for some patients, and if in that case, changes such as these would persist.
Following omalizumab-facilitated mOIT, a decreased frequency of mDC1s and reduced expression of CD86 in all APC subsets examined were noted. Decreased costimulatory molecule expression on APCs upon co-culture with allergen and PBMCs from participants at week 36 may reflect both the reduced frequency of allergen-reactive T cells and the concurrent shift in cytokine production following OIT. The decreased activation of APCs may then contribute to maintain the downmodulation of the Type 2 response.
We recently showed that individuals with IgE-mediated peanut allergy have increased numbers of peanut-specific CD8+ T cells, and that these T cells, many of which express the Th2-associated chemokine CCR4, recognize specific peanut-derived peptides, suggesting involvement in IgE-mediated food allergy 34, 35. In the present study following omalizumab-facilitated OIT, peanut-reactive CD8+ T cells and EM CD8 cells showed a decreased expression of GPR15 and increased expression of CLA, both of which are cell surface receptors associated with lymphocyte homing. This suggests that the CD8+ cells in these patients are responding to the changes in dietary allergen with alterations in potential trafficking patterns, which is again consistent with the notion that CD8+ T cells are involved in food allergy.
We found that the frequency of GPR15+ peanut-reactive CD8+ T cells, and the expression of GPR15 in Th2 EM cells and EM CD8+ cells, were significantly decreased following treatment with omalizumab and persisted throughout the 36 week course of OIT. The homing receptor GPR15 has been shown to mediate T cell trafficking to the skin and lamina propria of the colon 25, 26, 36. GPR15 is expressed in humans by effector T cells, including pathogenic Th2 cells, while the GPR15 ligand (GPR15L) is expressed in epithelia of the digestive tract, skin and cervix 25, 26, particularly under inflammatory conditions 37. While GPR15-mediated trafficking of pathogenic Th2 cells in ulcerative colitis 36 and to the skin has been described, GPR15L expression at mucosal surfaces suggests it may function in recruiting effector T cells to the small intestine in food allergic patients as well. This suggests that the migration potential of these cells was reduced by treatment with omalizumab and dietary allergen exposure.
With regard to the skin-homing receptors CCR4 and CLA, we found significant upregulation of CCR4 and CLA at week 36. This suggests that in vivo proliferation of allergen-specific, skin-homing “progenitor” cells occurs following allergen ingestion, i.e., during the mOIT protocol. The skin barrier is thought to play a critical role in preventing the “atopic march”, a concept based on the observation that skin barrier dysfunction with atopic dermatitis and eczema seen early in infants often progresses to food allergies and asthma later in life 38, 39. In this context, groups have reported food allergen-specific CD4+ T cells with increased expression of the skin chemokine receptor CCR4 40, 41. The specific role for such cells is not clear at this time.
Since Treg development following allergen desensitization has been the subject of conflicting reports 12–14, 42, we screened our mass cytometry dataset for Tregs. We could not analyze allergen (peanut)-specific Treg cells since the total frequency of peanut-specific CD4+ T cells, defined by CD69 and CD40L upregulation post 24 hours of ex vivo peanut stimulation, was limited. Although we did observe an increase in the frequency of non-allergen-reactive Tregs (CD25hi, CD127− CD69− CD40L− CD4+) at week 8 compared to baseline, this was restored to baseline level by week 36. Our findings are consistent with those of others who reported no change in the frequency of allergen-specific Tregs during OIT 12, 43. We did not observe upregulation of IFN-γ in the allergen-reactive CD4+ T cells at week 36 post-mOIT contrary to two previous reports 12, 13, although a significant increase in the expression of CXCR3, an IFN-inducible chemokine receptor, was observed at week 36.
In our cohort of MAP-X participants, we previously reported changes in whole allergen-specific IgE and IgG4 pre- and post-OIT 10, and published baseline IgE and IgG4 levels for individual cognate allergen-specific components 44. We used CRD (component resolved diagnostics) to detect specific IgEs against individual allergen molecules or components, which helps dissect the individual allergen component responses. Sensitization to major storage proteins (2S albumins, 7S globulins, and 11S globulins) and LTPs in peanut and tree nuts has been associated with severe allergic reactions, while sensitization to PR-10 family is associated with relatively mild reactions 45, 46. In agreement with our previous findings for single whole-food allergens 4–8, we observed a marked increase in specific IgG4/IgE ratio at week 36 post-OIT for components belonging to storage protein family, but not for the LTP and PR-10 family. However, we cannot rule out the possibility that patients suffering from mild to moderate reactions, as often is seen as a result of sensitization to PR-10 and LTPs, were excluded from our study enrollment.
In the present studies, we examined week 36 plasma in an indirect BAT (iBAT) and found a significant decrease in basophil activation compared to that using baseline plasma from peanut-allergic participants. This decrease in the iBAT response was in agreement with the observed increase in IgG4/IgE ratio in our serological readouts as well as that reported in other single-allergen rush OIT studies 21. We and others have shown that OIT decreases the ability of plasma to sensitize basophils, as shown in the iBAT 21, 22, resulting from the interaction of food-specific IgG antibodies induced during OIT with the inhibitory IgG receptor FcγR2b on basophils. Thus, the iBAT is a highly sensitive indicator of the balance between functionally activating IgE vs. suppressive IgG antibodies in the plasma of OIT participants.
Our study design had some limitations. In this phase 2 clinical trial, 30 out of 36 omalizumab-treated study participants were treatment successes as per the study protocol definition 10. We focused on comparing the pre- vs. post-mOIT immune changes in the 30 successfully desensitized participants rather than comparing those with the 6 treatment failures due to the limited sample size of the latter. Our studies were limited to responses to food allergens, and we have not examined responses to other types of allergens such as pollen, dust mite or insect venom which are rarely administered by OIT. We used only peanut as a representative allergen for our allergen-reactive readouts. Ex vivo stimulation with all of the allergens in the OIT mix, independently and together, would have been more ideal, especially in the context of mOIT. However, the amount of PBMCs available did not permit such experiments. In addition, time points beyond weeks 8 and 36 in the original clinical trial would have been informative. Moreover, we are cognizant of the spread of data points among our mass cytometry and Luminex readouts. Further studies with larger numbers of patient samples are needed to allow stratification of the results according to age, sex or ethnicity. We are now investing efforts into developing sample-sparing assays that would allow multi-allergen stimulation, and planning collection of a greater number of sample time points in our future studies.
The addition of omalizumab to facilitate OIT has been demonstrated in multiple previous studies 4–7, 10, 47. Omalizumab reduces the activation of mast cells and basophils, thereby allowing OIT to proceed more rapidly with a great reduction in allergic responses. Our study confirms the beneficial role of using omalizumab to facilitate OIT, and provides mechanistic understanding of how it downregulates allergic responses. Further studies are in progress to determine if longer duration of treatment with omalizumab would be beneficial for some patients, e.g., for those patients who do not achieve sustained unresponsiveness. Moreover, identification of biomarkers which would predict groups of patients most likely to achieve desensitization and those who may benefit from omalizumab treatment will allow design of personalized treatment protocols aimed at establishing long-term tolerance in food allergy.
Supplementary Material
Acknowledgments:
We thank the staff members of the Sean N Parker Center for their support, and Drs. Borja Ocon Moreno, Klaus Seuwen, Ramona Hoh, Yueh-hsiu Chien, Elizabeth Mellins and Claudia Macaubas, Catherine Blish, Jeff Sasaki, Jonas Lidholm, Yael Rosenberg-Hasson, Christopher Dant, Dale Umetsu and Karen Sachs for their advice.
Funding for this study was provided by NIH NIAID AADCRC (Grant U19AI104209), R01AI140134-02, 5UM2AI130836-04, U01 AI140498-03, R01AI119918 (HCO), 5T32AI007512 (SM), the Friend Family Foundation, the Crown Family Foundation, the Sean N Parker Center for Allergy and Asthma Research at Stanford University, the Simons Foundation, the Myra Reinhard Foundation, Carell Family Foundation, the Food Allergy Research and Education (FARE) Center of Excellence, and the Department of Pathology and Department of Pediatrics, Stanford University.
Competing interests:
Dr. Nadeau reports grants from National Institute of Allergy and Infectious Diseases (NIAID), National Heart, Lung, and Blood Institute (NHLBI), and National Institute of Environmental Health Sciences (NIEHS); Food Allergy Research & Education (FARE), Director of World Allergy Organization (WAO) Center of Excellence at Stanford; Advisor at Cour Pharma; Co-founder of Before Brands, Alladapt, Latitude, and IgGenix; National Scientific Committee member at Immune Tolerance Network (ITN) and National Institutes of Health (NIH) clinical research centers; DSMB member for NHLBI, US patents for basophil testing, multifood immunotherapy and prevention, monoclonal antibody from plasmablasts, and device for diagnostics. Dr. Galli reports grants from the NIH. Dr. Boyd has consulted for Regeneron, Sanofi and Novartis on topics unrelated to this study; owns shares in AbCellera and CareDx; has patents awarded or submitted related to immunoglobulin gene and protein analysis; and reports grants from the NIH. Dr. Chinthrajah receives grant support from CoFAR NIAID, Aimmune, DBV Technologies, Astellas, AnaptysBio, Novartis, and Regeneron, and is an advisory board member for Alladapt Immunotherapeutics, Novartis, and Genentech. Dr. Andorf reports grants from the NIH. All other authors have declared that no conflict of interest exists.
Abbreviations:
- CLA
Cutaneous Lymphocyte-associated Antigen
- CM
Central Memory
- CRD
Component-resolved diagnostics
- DC
Dendritic Cell
- EM
Effector Memory
- FDR
False Discovery Rate
- FLT3L
FMS-like tyrosine kinase 3 Ligand
- fMLP
N-formyl-L-methionyl-L-leucyl-phenylalanine
- GMCSF
Granulocyte-Macrophage Stimulating Factor
- GPR15
G Protein-coupled Receptor 15
- iBAT
Indirect Basophil Activation Test
- IQR
Interquartile range
- LTP
Non-specific lipid transfer proteins
- MFI
Median fluorescence intensity
- mOIT
Multi-food Oral Immunotherapy
- PR-10
Pathogenesis-related class-10
- Treg
Regulatory T cells
References
- 1.Gupta RS, Warren CM, Smith BM, et al. The Public Health Impact of Parent-Reported Childhood Food Allergies in the United States. Pediatrics 2018;142. [DOI] [PMC free article] [PubMed] [Google Scholar]
- 2.Koplin JJ, Mills EN, Allen KJ. Epidemiology of food allergy and food-induced anaphylaxis: is there really a Western world epidemic? Curr Opin Allergy Clin Immunol 2015;15:409–416. [DOI] [PubMed] [Google Scholar]
- 3.Bégin P, Winterroth LC, Dominguez T, et al. Safety and feasibility of oral immunotherapy to multiple allergens for food allergy. Allergy Asthma Clin Immunol. 2014;10:1. [DOI] [PMC free article] [PubMed] [Google Scholar]
- 4.Nadeau KC, Schneider LC, Hoyte L, Borras I, Umetsu DT. Rapid oral desensitization in combination with omalizumab therapy in patients with cow’s milk allergy. J Allergy Clin Immunol 2011;127:1622–1624. [DOI] [PMC free article] [PubMed] [Google Scholar]
- 5.Schneider LC, Rachid R, LeBovidge J, Blood E, Mittal M, Umetsu DT. A pilot study of omalizumab to facilitate rapid oral desensitization in high-risk peanut-allergic patients. J Allergy Clin Immunol 2013;132:1368–1374. [DOI] [PMC free article] [PubMed] [Google Scholar]
- 6.Wood RA, Kim JS, Lindblad R, et al. A randomized, double-blind, placebo-controlled study of omalizumab combined with oral immunotherapy for the treatment of cow’s milk allergy. J Allergy Clin Immunol 2016;137:1103–1110.e1111. [DOI] [PMC free article] [PubMed] [Google Scholar]
- 7.MacGinnitie AJ, Rachid R, Gragg H, et al. Omalizumab facilitates rapid oral desensitization for peanut allergy. J Allergy Clin Immunol 2017;139:873–881.e878. [DOI] [PMC free article] [PubMed] [Google Scholar]
- 8.Brandstrom J, Vetander M, Sundqvist AC, et al. Individually dosed omalizumab facilitates peanut oral immunotherapy in peanut allergic adolescents. Clin Exp Allergy 2019. [DOI] [PubMed] [Google Scholar]
- 9.Bégin P, Dominguez T, Wilson SP, et al. Phase 1 results of safety and tolerability in a rush oral immunotherapy protocol to multiple foods using omalizumab. Allergy Asthma Clin Immunol. 2014;10:7. [DOI] [PMC free article] [PubMed] [Google Scholar]
- 10.Andorf S, Purington N, Block WM, et al. Anti-IgE treatment with oral immunotherapy in multifood allergic participants: a double-blind, randomised, controlled trial. Lancet Gastroenterol Hepatol 2018;3:85–94. [DOI] [PMC free article] [PubMed] [Google Scholar]
- 11.Andorf S, Purington N, Kumar D, et al. A Phase 2 Randomized Controlled Multisite Study Using Omalizumab-facilitated Rapid Desensitization to Test Continued vs Discontinued Dosing in Multifood Allergic Individuals. EClinicalMedicine 2019;7:27–38. [DOI] [PMC free article] [PubMed] [Google Scholar]
- 12.Bedoret D, Singh AK, Shaw V, et al. Changes in antigen-specific T-cell number and function during oral desensitization in cow’s milk allergy enabled with omalizumab. Mucosal Immunol 2012;5:267–276. [DOI] [PMC free article] [PubMed] [Google Scholar]
- 13.Abdel-Gadir A, Schneider L, Casini A, et al. Oral immunotherapy with omalizumab reverses the Th2 cell-like programme of regulatory T cells and restores their function. Clin Exp Allergy 2018;48:825–836. [DOI] [PMC free article] [PubMed] [Google Scholar]
- 14.Frischmeyer-Guerrerio PA, Masilamani M, Gu W, et al. Mechanistic correlates of clinical responses to omalizumab in the setting of oral immunotherapy for milk allergy. J Allergy Clin Immunol 2017;140:1043–1053.e1048. [DOI] [PMC free article] [PubMed] [Google Scholar]
- 15.Yee CSK, Albuhairi S, Noh E, et al. Long-Term Outcome of Peanut Oral Immunotherapy Facilitated Initially by Omalizumab. J Allergy Clin Immunol Pract 2019;7:451–461.e457. [DOI] [PubMed] [Google Scholar]
- 16.Stranks AJ, Minnicozzi SC, Miller SJ, et al. Immunoglobulin E blockade during food allergen ingestion enhances the induction of inhibitory immunoglobulin G antibodies. Ann Allergy Asthma Immunol 2019;122:213–215. [DOI] [PMC free article] [PubMed] [Google Scholar]
- 17.Fuss IJ, Kanof ME, Smith PD, Zola H. Isolation of whole mononuclear cells from peripheral blood and cord blood. Curr Protoc Immunol 2009;Chapter 7:Unit7 1. [DOI] [PubMed] [Google Scholar]
- 18.Lin D, Gupta S, Maecker HT. Intracellular Cytokine Staining on PBMCs Using CyTOF Mass Cytometry. Bio Protoc 2015;5. [DOI] [PMC free article] [PubMed] [Google Scholar]
- 19.Neeland MR, Andorf S, Manohar M, et al. Mass cytometry reveals cellular fingerprint associated with IgE+ peanut tolerance and allergy in early life. Nature communications 2020;11:1091–1091. [DOI] [PMC free article] [PubMed] [Google Scholar]
- 20.Ruiter B, Smith NP, Monian B, et al. Expansion of the CD4(+) effector T-cell repertoire characterizes peanut-allergic patients with heightened clinical sensitivity. The Journal of allergy and clinical immunology 2020;145:270–282. [DOI] [PMC free article] [PubMed] [Google Scholar]
- 21.Burton OT, Logsdon SL, Zhou JS, et al. Oral immunotherapy induces IgG antibodies that act through FcγRIIb to suppress IgE-mediated hypersensitivity. Journal of Allergy and Clinical Immunology 2014;134:1310–1317.e1316. [DOI] [PMC free article] [PubMed] [Google Scholar]
- 22.Santos AF, James LK, Bahnson HT, et al. IgG4 inhibits peanut-induced basophil and mast cell activation in peanut-tolerant children sensitized to peanut major allergens. J Allergy Clin Immunol 2015;135:1249–1256. [DOI] [PMC free article] [PubMed] [Google Scholar]
- 23.Wickham H ggplot2: Elegant Graphics for Data Analysis. 1 ed. Springer, New York: Springer Verlag; 2009. [Google Scholar]
- 24.Benjamini Y, Hochberg Y. Controlling the False Discovery Rate: A Practical and Powerful Approach to Multiple Testing. Journal of the Royal Statistical Society: Series B (Methodological) 1995;57:289–300. [Google Scholar]
- 25.Suply T, Hannedouche S, Carte N, et al. A natural ligand for the orphan receptor GPR15 modulates lymphocyte recruitment to epithelia. Sci Signal 2017;10. [DOI] [PubMed] [Google Scholar]
- 26.Ocón B, Pan J, Dinh TT, et al. A Mucosal and Cutaneous Chemokine Ligand for the Lymphocyte Chemoattractant Receptor GPR15. Frontiers in immunology 2017;8:1111–1111. [DOI] [PMC free article] [PubMed] [Google Scholar]
- 27.Kaur D, Brightling C. OX40/OX40 ligand interactions in T-cell regulation and asthma. Chest 2012;141:494–499. [DOI] [PMC free article] [PubMed] [Google Scholar]
- 28.Bieber T, Kraft S, Geiger E, Wollenberg A, Koch S, Novak N. Fc epsilon RI expressing dendritic cells: the missing link in the pathophysiology of atopic dermatitis? The Journal of dermatology 2000;27:698–699. [DOI] [PubMed] [Google Scholar]
- 29.Cosmi L, Maggi L, Santarlasci V, et al. Identification of a novel subset of human circulating memory CD4(+) T cells that produce both IL-17A and IL-4. Journal of Allergy and Clinical Immunology 2010;125:222–230.e224. [DOI] [PubMed] [Google Scholar]
- 30.Wambre E, Bajzik V, DeLong JH, et al. A phenotypically and functionally distinct human TH2 cell subpopulation is associated with allergic disorders. Sci Transl Med 2017;9. [DOI] [PMC free article] [PubMed] [Google Scholar]
- 31.Ammitzboll C, von Essen MR, Bornsen L, et al. GPR15(+) T cells are Th17 like, increased in smokers and associated with multiple sclerosis. J Autoimmun 2019;97:114–121. [DOI] [PubMed] [Google Scholar]
- 32.Gorelik M, Narisety SD, Guerrerio AL, et al. Suppression of the immunologic response to peanut during immunotherapy is often transient. J Allergy Clin Immunol 2015;135:1283–1292. [DOI] [PMC free article] [PubMed] [Google Scholar]
- 33.Iyengar SR, Hoyte EG, Loza A, et al. Immunologic effects of omalizumab in children with severe refractory atopic dermatitis: a randomized, placebo-controlled clinical trial. Int Arch Allergy Immunol 2013;162:89–93. [DOI] [PMC free article] [PubMed] [Google Scholar]
- 34.Yu W, Zhou X, Dunham D, et al. Allergen-specific CD8(+) T cells in peanut-allergic individuals. J Allergy Clin Immunol 2019;143:1948–1952. [DOI] [PMC free article] [PubMed] [Google Scholar]
- 35.Yu W, Zhou X, Davis MM, Nadeau KC. Regulation of peanut-specific CD8+ T cells from nonallergic individuals. J Allergy Clin Immunol. :Accepted August 2020. In press. [DOI] [PMC free article] [PubMed] [Google Scholar]
- 36.Nguyen LP, Pan J, Dinh TT, et al. Role and species-specific expression of colon T cell homing receptor GPR15 in colitis. Nat Immunol 2015;16:207–213. [DOI] [PMC free article] [PubMed] [Google Scholar]
- 37.Guo P, Luo Y, Mai G, et al. Gene expression profile based classification models of psoriasis. Genomics 2014;103:48–55. [DOI] [PubMed] [Google Scholar]
- 38.Davidson WF, Leung DYM, Beck LA, et al. Report from the National Institute of Allergy and Infectious Diseases workshop on “Atopic dermatitis and the atopic march: Mechanisms and interventions”. J Allergy Clin Immunol 2019;143:894–913. [DOI] [PMC free article] [PubMed] [Google Scholar]
- 39.DeKruyff RH, Zhang W, Nadeau KC, Leung DYM, Wills-Karp M. Summary of the Keystone Symposium “Origins of allergic disease: Microbial, epithelial and immune interactions,” March 24–27, Tahoe City, California. J Allergy Clin Immunol 2020;145:1072–1081 e1071. [DOI] [PubMed] [Google Scholar]
- 40.Archila LD, Jeong D, Pascal M, et al. Jug r 2-reactive CD4(+) T cells have a dominant immune role in walnut allergy. J Allergy Clin Immunol 2015;136:983–992.e987. [DOI] [PMC free article] [PubMed] [Google Scholar]
- 41.Chiang D, Chen X, Jones SM, et al. Single-cell profiling of peanut-responsive T cells in patients with peanut allergy reveals heterogeneous effector TH2 subsets. J Allergy Clin Immunol 2018;141:2107–2120. [DOI] [PMC free article] [PubMed] [Google Scholar]
- 42.Syed A, Garcia MA, Lyu SC, et al. Peanut oral immunotherapy results in increased antigen-induced regulatory T-cell function and hypomethylation of forkhead box protein 3 (FOXP3). J Allergy Clin Immunol 2014;133:500–510. [DOI] [PMC free article] [PubMed] [Google Scholar]
- 43.Kulis MD, Patil SU, Wambre E, Vickery BP. Immune mechanisms of oral immunotherapy. J Allergy Clin Immunol 2018;141:491–498. [DOI] [PMC free article] [PubMed] [Google Scholar]
- 44.Andorf S, Borres MP, Block W, et al. Association of Clinical Reactivity with Sensitization to Allergen Components in Multifood-Allergic Children. J Allergy Clin Immunol Pract 2017;5:1325–1334.e1324. [DOI] [PMC free article] [PubMed] [Google Scholar]
- 45.Geiselhart S, Hoffmann-Sommergruber K, Bublin M. Tree nut allergens. Mol Immunol 2018;100:71–81. [DOI] [PubMed] [Google Scholar]
- 46.Weinberger T, Sicherer S. Current perspectives on tree nut allergy: a review. J Asthma Allergy 2018;11:41–51. [DOI] [PMC free article] [PubMed] [Google Scholar]
- 47.Lin C, Lee IT, Sampath V, et al. Combining anti-IgE with oral immunotherapy. Pediatr Allergy Immunol 2017;28:619–627. [DOI] [PubMed] [Google Scholar]
Associated Data
This section collects any data citations, data availability statements, or supplementary materials included in this article.